OH megamasers, starburst and AGN activity in Markarian 231
Abstract
We present MERLIN observations of OH maser and radio continuum emission within a few hundred pc of the core of the Ultra Luminous IR Galaxy Markarian 231. This is the only known OH megamaser galaxy classed as a Seyfert 1. Maser emission is identified with the 1665- and 1667-MHz transitions over a velocity extent of 720 km s-1. Both lines show a similar position-velocity structure including a gradient of 1.7 km s-1 pc-1 from NW to SE along the 420-pc major axis. The (unresolved) inner few tens of pc possess a much steeper velocity gradient. The maser distribution is modelled as a torus rotating about an axis inclined at to the plane of the sky. We estimate the enclosed mass density to be M⊙ pc-3 in a flattened distribution. This includes a central unresolved mass of M⊙. All the maser emission is projected against a region with a radio continuum brightness temperature K, giving a maser gain of . The 1667:1665-MHz line ratio is close to 1.8 (the value predicted for thermal emission) consistent with radiatively pumped, unsaturated masers. This behaviour and the kinematics of the torus suggest that the size of individual masing regions is in the range pc with a covering factor close to unity. There are no very bright compact masers, in contrast to galaxies such as the Seyfert 2 Markarian 273 where the masing torus is viewed nearer edge-on. The comparatively modest maser amplification seen from Markarian 231 is consistent with its classification in the unification scheme for Seyfert galaxies. Most of the radio continuum emission on 50-500 pc scales is probably of starburst origin but the compact peak is per cent polarized by a magnetic field running north-south, similar to the jet direction on these scales. There is no close correlation between maser and continuum intensity, suggesting that much of the radio continuum must originate in the foreground and indeed the relative continuum brightness is slightly greater in the direction of the approaching jet. Comparisons with other data show that the jet changes direction close the nucleus and suggest that the sub-kpc disc hosting the masers and starburst activity is severely warped.
keywords:
masers — galaxies: active — galaxies: kinematics and dynamics — radio continuum: galaxies — radio lines: galaxies — galaxies: individual: Markarian 2311 INTRODUCTION
Ultraluminous infrared galaxies (ULIRGs) were first discovered using IRAS (see review by ?). They are defined as having luminosities ,. They are thought to be powered mainly by bursts of extreme star formation, with contributions from active nuclei in at least some cases (e.g. ?). Seemingly without exception, and in contrast to lower-luminosity starbursts, ULIRGs show evidence for dramatic intergalactic collisions or mergers when observed in the optical or NIR (?; ?). At such extreme luminosities, ULIRGS would be detectable out to redshifts by new IR telescopes such as Spitzer. The galaxy interaction rate is expected to be greater at larger look-back times (?). The study of these rare objects in the local universe is crucial to our understanding of galaxy interactions and the triggering of star-formation at all epochs and, by implication, the development of structure in the early universe (?).
? proposed that ULIRGs are part of a sequence in which spiral galaxies merge, evolve through a starburst phase and become optically visible QSOs. They postulate that gas is funnelled into the merging nuclei causing nuclear starbursts and the formation of a self-gravitating nuclear disc on a scale of 1 kpc. The disc is thought to fuel the activity of the nucleus. Furthermore, starburst activity produces enough fast-evolving stars to give rise to a high rate of mass loss back into the interstellar medium (ISM) leading to sustained fuelling of the central black hole (?). The merger activity produces a warm ( K) dusty environment in the nuclear region, providing good conditions for OH megamaser activity (?).
Markarian (Mrk) 231 is one of the most luminous and best studied IRAS galaxies, with . It has a redshift of 0.042, yielding an estimated distance of 170 Mpc111We adopt km s-1 Mpc-1. At the distance of Markarian 231 one arcsec corresponds to 820 pc.. Optical spectroscopy shows broad lines characteristic of a Seyfert 1 nucleus (?). A radio jet is apparent in VLBI and VLA images on scales of sub-pc to hundreds of pc, with a weak counter-jet (? and references therein), providing unusually strong evidence for the presence of an AGN in an OH megamaser region. The IR luminosity has been partly attributed to starburst activity (?) and partly to the AGN (?), discussed further in Section 4.1. On scales pc the radio-continuum emission is AGN dominated (?). On greater than kpc scales it is starburst-dominated although the contribution from the dissipated radio jet may be significant (?). The spectral indices of the intermediate-scale radio continuum suggest a diffuse component powered by a disc or halo of star formation as well as fragmented jet emission to the south (?).
Mrk 231 shows powerful OH megamaser emission first detected by ?. ? reported emission in all 4 ground-state transitions; the 1667-MHz line was stronger than the 1665-, 1720- and 1612-MHz lines by factors of approximately 2.3, 13 and 30, respectively. Using the Lovell telescope with a beam size of 10 arcmin, ? measured emission over 6.9 MHz and estimated the total velocity width of the 1667-MHz emission to be km s-1 with a peak maser flux density of 48 mJy. ? obtained similar results using the Westerbork array at a resolution of 14 arcsec, but the European VLBI Network (EVN) at 39 milli-arcsec (mas) resolution only detected just over half the OH emission within a region of maximum angular size 150 mas.
The Multi Element Radio Linked Interferometer Network (MERLIN) is sensitive to 1.4–1.6 GHz emission on scales up to arcsec (1.6 kpc) with a resolution of mas. We describe our observations using MERLIN in Section 2. We present the continuum and line results in Section 3. In Section 4 we explain the radio morphology and polarization and analyse the maser kinematics in comparison with other observations of the galaxy on various scales, which provides limits on the size of masing clouds and the enclosed mass. In Section 5 we analyse our findings and information from the literature in order to estimate the maser optical depths and other characteristics, further constraining the size of masing regions and their number density. We make some comparisons with other megamaser galaxies in Section 6 and summarise our conclusions in Section 7.
2 OBSERVATIONS
2.1 Continuum observations
We observed Mrk 231 at 1658 MHz on 1997 June 20 using 6 antennas of MERLIN for 10 hr with a 16-MHz bandwidth. We also retrieved MERLIN archive observations at 1420 and 1658 MHz made on 1993 May 23-25 for hr at each frequency, using 8 antennas including the Lovell and Wardle telescopes, giving improved sensitivity on angular scales up to 6 arcsec. J1302+578 was used as the phase-reference source, observed alternately with Mrk 231 in a 10-12-min cycle. Its position is known to better than 1 mas (?) and it is only 13 from Mrk 231. Details of the sources used for calibration of the bandpass and the flux scale (by comparision with with 3C286, ?) are given in Table 1. The data were reduced using standard MERLIN procedures (?) and the aips package. For each epoch, we self-calibrated J1302+578 and interpolated the phase and amplitude solutions over the Mrk 231 data. We also corrected for polarization leakage and polarization angle offset (with respect to 3C286). The pointing position for Mrk 231 (referred to hereafter as the reference position) was 12h 56m142383 +56° 52′ 25210 (J2000). The absolute position uncertainty of our images is about 10 mas, taking into account the errors in the positions of the antennas and J1302+578 and in transferring the phase corrections to Mrk 231.
Table 1 gives the properties of images made using the same restoring beam at all epochs/frequencies. This shows that the peak flux densities are the same within the flux scale uncertainy, but the total flux detected in 1997 is only 86 per cent of that detected in 1993. The 1993 1658-MHz data were imaged using natural weighting to give optimum fidelity and sensitivity in studying extended continuum emission. The 1997 data were imaged at the same resolution as the masers for the comparison in Section 5.1.
| Epoch | Freq. | Flux cal. | Peak | Total | ||
|---|---|---|---|---|---|---|
| (yr) | (MHz) | (source) | (Jy) | (mJy beam-1) | (mJy) | |
| (1) | (2) | (3) | (4) | (5) | (6) | (7) |
| 1993 | 1420 | OQ208 | 0.935 | 177.93 | 0.07 | 266.95 |
| 1993 | 1658 | OQ208 | 1.187 | 175.14 | 0.06 | 265.04 |
| 1997 | 1658 | 2134+004 | 4.9 | 173.00 | 0.07 | 229.24 |
2.2 Maser line observations
We observed Mrk 231 in spectral line mode on 1997 June 20, using the same calibration sources and initial procedures as for the contemporaneous continuum observations (Section 2.1). We used a bandwidth of 8 MHz divided into 64 frequency channels, giving a channel width of 22.5 km s-1. Mrk 231 has a velocity relative to the Local Standard of Rest, , of 12137 km s-1 using the radio convention in which the fractional shift in line frequency is proportional to the recession velocity as a fraction of . This corresponds to 12639 km s-1 in the optical heliocentric convention ( at the epoch of observation. Mrk 231 was observed alternately at frequencies corresponding to the redshifted 1665- and 1667-MHz OH mainline maser transitions. ? describes the additional data reduction stages for MERLIN megamaser observations.

We combined the datasets (rejecting noisy end channels) into a single sequence of 79 consecutive frequency channels. The velocity profile of the whole spectral data set before continuum subtraction is shown in Fig. 1, with line emission in channels 19 to 66. The slanting line shows a linear fit to the continuum-only end channels. The slope of this line is probably an artefact due to interference which was only serious at the low frequency end of the spectrum, making these data less reliable despite editing. The mean and rms of the continuum bandpass is () mJy. We averaged and imaged the continuum-only channels and used the clean components for self-calibration; the solutions were applied to all data. After calibration, the data from each antenna were weighted in proportion to antenna sensitivity.
To obtain line-only data, we Fourier transformed the visibility data to make a dirty datacube of images and then subtracted the continuum using a linear extrapolation between the average of the two groups of end channels (aips task imlin). Finally we cleaned the resulting datacube by deconvolving the dirty beam. We found that partial uniform weighting (extrapolating into the undersampled parts of the visibility plane to improve resolution) and using a 120-mas circular restoring beam gave the best resolution without increasing the noise noticeably nor losing sensitivity. This gives an off-source 3 noise level of (2-3) mJy beam-1 per channel. The noise distribution in the cleaned region is Gaussian and no emission is .
We fitted 2-dimensional Gaussian components to measure the position and intensity of each patch of maser emission in each channel, using criteria similar to those described in ?. The continuum emission from Mrk 231 is much brighter, and hence the calibration solutions and continuum subtraction are more accurate than in the case of Mrk 273. Moreover, the masers in Mrk 231 cover a larger region and are easier to separate spatially. We rejected components if they were and did not fall in a series occuring at the same position (within the errors) in at least 3 consecutive channels at the start and end of each series. We assumed that the occasional gap within a faint series was probably due to emission falling just below our detection threshold in that channel, rather than representing a significant discontinuity.
The errors associated with fitting Gaussian components are analysed for ideal situations in ? and ?; applications to sparsely sampled arrays are described for VLA snapshots by ? and for MERLIN by ?. For the present observations the position uncertainty is given by the naturally weighted beamsize divided by the signal to noise ratio of each component, plus fitting errors due to non-Gaussian flux density distribution. For a 10 mJy beam-1 component the uncertainty is typically 20 mas. In many channels the emission was resolved into up to four components.
3 RESULTS
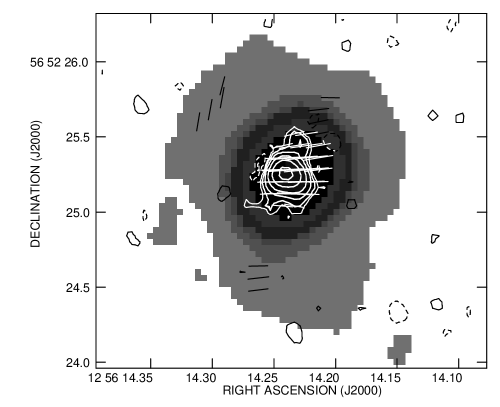
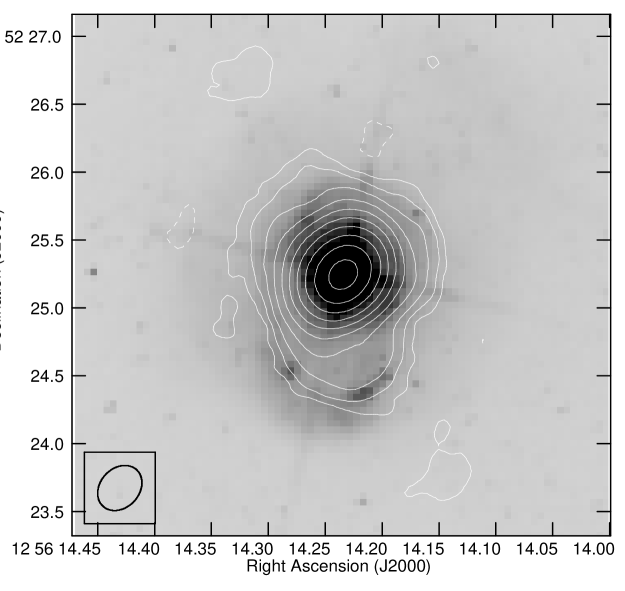
The results are summarized in Fig. 2 which shows contours of the OH emission superimposed on a gray scale image of the radio continuum. MERLIN detected continuum emission over 2 arcsec, with a bright core that is covered by the OH emission. The OH is just over 0.5 arcsec in angular extent, about three times wider than the compact core detected by ? using the EVN. The OH peak is slightly displaced (40 mas), from the continuum peak. The continuum is weakly polarized in the E–W direction. The continuum results are described in more detail in the following Section 3.1, and the OH results in Section 3.2.
3.1 Radiocontinuum morphology and polarization
The continuum emission had a similar elongated heart-shaped appearance in both 1658-MHz images and in the 1420-MHz image. There is no significant difference in peak intensity (Table 1) nor any significant position offset or difference in polarization properties between any of the images so we discuss the 1993 1658-MHz image which provides the most sensitive highest-resolution data. This is shown in greyscale in Fig. 2. The continuum peak of 196 mJy beam-1 is located at 12h 56m14 2337 +56° 52′ 25237 (total uncertainty 10 mas; uncertainty relative to the MERLIN maser positions 1 mas). This is (1, –8) mas from the position reported by ? using the VLBA with phase referencing at 15 GHz and (–6, 0) from the astrometric position measured by ? using the VLA at 8.4 GHz with an accuracy of 12 mas. The continuum emission detected by MERLIN has a maximum elongation of almost 2 arcsec N–S. Increasing the resolution by using uniform weighting shows a faint ridge running S from the peak (corresponding to the trough in the maser:continuum ratio described in Section 5.1). This is in the direction of the radio jet seen on scales of tens of mas upwards (?; ?; ?; ?). Elongated radio emission is seen on both larger and smaller scales, see Sections 1, 4.4 and 4.5.
The 1.6-GHz continuum peak brightness temperature is K (derived from ?) and all the emission detected by MERLIN is K, indicating its synchrotron origin. The total flux density above 3, measured from the continuum image shown in Fig. 2, is 265.5(0.4) mJy in 2.49 arcsec2. In the continuum peak region, we detected compact linearly polarized radio emission with a polarized flux density of mJy beam-1 and a polarization position angle of °, shown by the white vectors in Fig. 2. The polarized intensity is per cent of the total intensity. There is difference between the polarization angles at 1420 and 1658 MHz. We infer that a core region mas across is significantly polarized in the presence of a magnetic field oriented N–S, similar to the direction of the jet on scales of 10–100 pc.
3.2 Maser distribution
Figure 1 shows that MERLIN detected OH line flux above the continuum level across at least 6 MHz of the 8 MHz observing band. There are two major peaks, one of 53 mJy at 1599.992 MHz and one of 26 mJy at 1597.867 MHz, a separation of 2.125 MHz. The peaks are within one spectral channel of the OH mainline frequencies 1667.359 and 1665.402 MHz respectively, redshifted to the velocity of Mrk 231. Fig. 1 shows additional faint emission around 1596 MHz but this could not be imaged. This is the region of the spectrum more affected by interference and it is not possible to tell if the emission is astrophysical. The peak flux densities and other details of the MERLIN spectrum are in good quantitative agreement with the single-dish spectrum of Stavely-Smith et al. (1987). The total flux density of all the fitted components listed in Table 2 is W m-2, almost exactly the single dish flux density integral of W m-2 from ?. We are satisfied that the MERLIN images represent the main features of the maser distribution accurately.
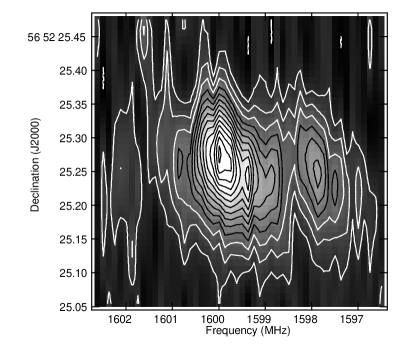
Fig. 3 shows a declination-frequency plot of the OH emission above 6 per cent of the peak (about ). The brightest emission, between 1599 and 1602 MHz, shows an increasing displacement towards higher declination with higher frequency. A fainter copy of this pattern is seen between 1596.5 and 1598.5 MHz. The 1667-MHz line is almost always brighter than the 1665-MHz line in megamaser galaxies (?), by a factor similar to the LTE (local thermodynamic equilibrium) line ratio of 1.8:1, or greater. We therefore assume that the brighter emission is dominated by the 1667-MHz line and the fainter copy by the 1665-MHz line. There is emission across the whole frequency range near the centre of the declination range. There is also a halo of fainter emission.
The contours in Fig. 2 show all maser emission summed in frequency; the maser peak at 12h 56m142351 +56° 52′ 25274) is significantly offset by (12, –37) mas (uncertainty 2 mas) from the continuum peak. The total maser flux density in fitted components in the channels corresponding to the 1667- and 1665-MHz peaks is 48 and 21 mJy beam-1 respectively. In both cases there is a difference of mJy between the spectral flux (Fig. 1) and that appearing in fitted components, suggesting that an insignificant amount of maser emission has escaped fitting.
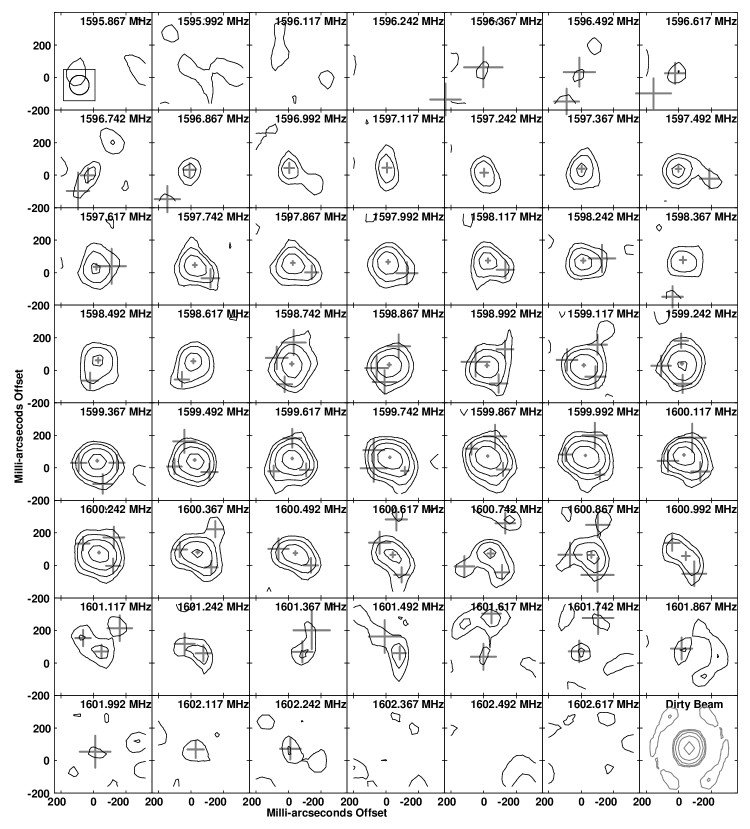
Channel maps of the maser emission with the positions of the fitted components overlaid are given in Fig. 4. Negative contours are not shown in the crowded plots but there is no negative emission . The dirty beam pattern is shown in the last panel.
We allocated the fitted components to one or other transition using these assumptions:
-
•
The brightest component in the main/secondary peak originated at 1667/1665 MHz;
-
•
The most extreme blue-/red-shifted components originated at 1667/1665 MHz;
-
•
Components with a similar angular position separated by MHz in frequency arose from both transitions.
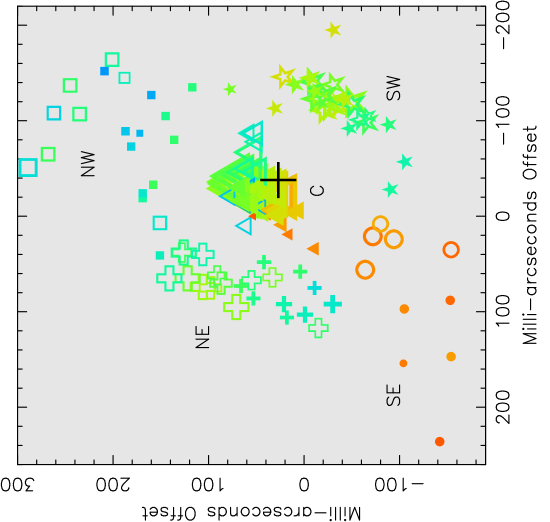
Seventy-one components were allocated to five spatially separate 1667-MHz features and 54 components were allocated to corresponding features in the 1665-MHz line. These regions are labelled on Fig. 5. The brightest region, C, occurs near the centre of the maser distribution. The peak flux density of 38 mJy beam-1 occurs in the 1667-MHz transition at 12113 km s-1 ( 12613 km s-1), position (, ) = (–29, 66) mas, mas. The closest, brightest emission in the 1665-MHz transition, 17 mJy beam-1, occurs in the adjacent channel, 12135 km s-1 ( 12636 km s-1), at (–14, 56) mas, mas. Emission at the same intensity is co-located within the position errors, two channels away in velocity at 12180 km s-1 ( 12685 km s-1),. The combined error-weighted average maser peak position is (–26, 64) mas, uncertainty 5 mas. Additional blue-shifted emission occurs in the region labelled NW and more red-shifted emission in SE. The regions marked NE and SW contain emission at intermediate velocities.
The core region C contains most of the total maser flux, 71 per cent whilst the halo regions NE, SE, SW and NW contain 9, 3, 11 and 6 per cent of the total, respectively. The outer regions have peaks of 30 per cent or less of the region C peak for the same transition.
The peaks are well-separated but the edges of some or all of the five regions could be overlapping in space and/or velocity and some component blending is likely. For example, 1667-MHz emission from the brightest maser region (labelled C) appears spectrally asymmetric with a longer blue-shifted wing whilst the opposite is true at 1665 MHz. This is probably due to truncation of the lines where it is difficult to separate broad components in regions where they overlap in position and velocity. If each line has an intrinsically symmetric velocity profile then components in 7–8 channels ( km s-1) are missing from the fits to the overlap region. This may also be the case to a lesser extent for the NE, SW and NW regions, in addition to emission which is below our sensitivity level. It is unlikely that more than one or two components at each overlap have been wrongly allocated (i.e. less than 10 per cent of all components).
In all regions there is a tendency for the 1665-MHz emission to be offset to the SE from the 1667-MHz emission. This could be due to misalignment of the two input data sets due to uncertainties in phase-referencing but this is very unlikely to exceed a few mas due to the use of a very nearby phase reference source (Section 2.2) and the fact that the observations were interleaved. The offset is often less than the position uncertainty due to noise for individual components so we cannot speculate about any possible astrophysical origins.
We used the rest frequencies to estimate the Doppler velocity () of the emitting gas for each component. In this and similar contexts red- and blue-shifted are used to describe velocities with respect to the systemic velocity of Mrk 231. The component parameters are tabulated in Table 2. Column (1) gives the region identification, column (2) gives the channel observing frequency and columns (3) and (4) give the velocities in the optical heliocentric and radio LSR conventions. Columns (5)–(7) give the component offsets (, ) from the reference position and the position uncertainty and column (8) gives the component flux density with an uncertainty of mJy beam-1.
4 The structure and dynamics of Mrk 231
4.1 A compact, polarized core
The radio emission within pc of the core is per cent polarized with °, which implies a N–S magnetic field (Section 3.1). ? report a similar core polarization angle on the VLA (2.25-arcsec) scale, but the fractional polarized intensity is per cent, suggesting that beam dilution reduces the VLA measurement. ? measured at 5000–7000 Å using the William Herschel telescope, as part of a survey of polarized optical emission from Seyfert galaxies. They place Mrk 231 in a class of galaxies showing scattering of AGN light in regions between 1–300 pc from the nucleus along a polar axis at an angle of inclination °, with the direction of outflow perpendicular to the polarization angle. Its polarization properties are similar in the NIR ?. ISO polarimetry by ? at 12.0 and 14.3 m gave °. The authors state that this is in relative agreement with the NIR results although the MIR polarization is probably not due to scattering but to dichroic spheroidal dust grains aligned with the magnetic field in a torus perpendicular to the outflow. If there is a genuine difference between and measurements at other wavelengths, it is in the same direction as the difference in position angle between the pc-scale jet (?) and its direction on larger scales (see Section 4.5). This implies that the MIR emission originates from the innermost torus.
? took Keck images of Mrk 231 at 7 wavelengths between 7.9–17.9 m at a resolution similar to MERLIN at 1.6 GHz and retrieved longer-wavelength IRAS data. They deduce that at m, the IR source is mas in diameter, increasing to 400 mas at 60 m (assuming a dust temperature of 85 K in the extended region). This shows that either there is a temperature gradient (decreasing with distance from the core), or that the shorter-wavelength emission is dominated by AGN-related activity, whilst a cooler region which is a few hundred pc in extent is significant at longer IR wavelengths. The latter explanation is consistent with the association of polarized radio and shorter-wavelength IR emission with the compact base of the jet and with emission of starburst origin around 60-m dominating in the masing region. The polarization mechanisms differ in the various wavelength regimes but the similarities in polarization angle within the inner few hundred pc support our assumption that is the same at 1420 and 1658 MHz because Faraday rotation is negligible (rather than some exact multiple of ).
4.2 Maser kinematics
4.2.1 Sub-kpc scales
Regions SW and NE (marked in Fig. 5), separated by () mas, define the minor axis of an ellipse containing the masers and cover the central 400 km s-1 of the velocity range. Regions SE and NW contain only red- and blue-shifted emission respectively, including the most extreme velocities (separated by 720 km s-1) and have an angular separation of () mas which defines the maser major axis . The gradient between SE and NW is ) km s-1 mas-1 km s-1 pc-1. This suggests rotation (towards the observer in the NW) at radii pc. The axis of rotation, projected against SW and NE, is at a position angle of °°. The axial ratio of the ellipse containing the masers shows that the rotation axis is at an angle of inclination to the plane of the sky of °°. The radio jets appear to point approximately S on all but the smallest scales (Section 3.1) but the maser axis direction is less inconsistent with the jets if it is pointing towards the observer in the SE. We will refer to the masing region as a torus although it could have some other shape such as a disc.
The smallest velocity gradient along the line of sight is found projected against the rotation axis in a thin torus in Keplerian or solid body rotation. The largest velocity gradient along the line of sight would then be km s-1 pc-1 for regions in the orthogonal direction in the plane of the sky. The lower velocity gradient may be allowing greater maser amplification (in our direction), since regions NE and SW contain the flux of NW and SE.
The total velocity gradient perpendicular to the rotation axis is given by km s-1 pc-1 where is the maser rotation velocity in km s-1. The enclosed mass density is given by
| (1) |
in units of M⊙ pc-3. This gives M⊙ pc-3 and a maximum enclosed mass of M⊙, if it has a uniform spherical distribution or is a compact object. If the mass distribution is flattened, or the torus is nearer edge-on, this would reduce the enclosed mass by a factor of up to about two. ? deduce from NIR data that (depending on the star formation history) a total mass of stars of at least M⊙ is contained within the inner 200 pc in a disc-like distribution. This would amount to of the dynamical mass implied by our OH data, assuming a flattened distribution.
The EVN observations by ? detected just over half the OH maser emission imaged by MERLIN, covering a 200 km s-1 velocity range within the innermost 150 mas, a similar angular extent to the MERLIN region C. The EVN did not detect the fainter red- and blue-shifted tails seen in MERLIN regions C, SE and NW, nor most of the extended intermediate-velocity regions NE and SW. ? measure a velocity gradient corresponding to 1.2 km s-1 mas-1, similar to the value of which we measure over 510 mas. They present a model of a torus inclined at 56rotating about an axis at position angle 35(their fig. 3c), almost parallel to the axis of symmetry deduced from the MERLIN data. They deduce a central mass concentration of M⊙ within a radius of pc. This is consistent with the mass concentration measured using MERLIN if the mass distribution between 50–200 pc is flattened. The inner radius of the torus is unresolved by the EVN, so mas and continuing the extrapolation would suggest that M⊙ is enclosed.
4.2.2 Innermost masers
The distinct ‘core-halo’ maser distribution seen in Fig. 5 suggests that this is not the whole story. If the kinematics of a torus are determined by a smooth mass distribution, or by a central point-like mass alone, we would expect the maser emission to have a smooth radial profile in any given direction. For solid-body rotation, the most extreme velocities should be seen at the outer rim. This is a reasonable description of the broad ring traced by NE, NW, SW and SE. The exponential nature of unsaturated maser amplification means that small differences in local density or turbulence can be greatly exaggerated so small fluctuations should not be over-interpreted. However, the flux density gradient steepens towards the central region C (which is not spatially resolved by MERLIN); this is best seen in the linearly-spaced contours of Fig. 3. Region C includes weak tails covering the total range of 720 km s-1 within 120 mas (100 pc). Interaction between the jet and the torus is a possible but unlikely explanation, see Section 4.5. A higher mass concentration is more probable. This could imply a very dense nuclear starburst but there is no evidence for this in results of ? and ?.
We suggest that the extreme velocity gradient is due to a supermassive black hole starting to dominate the dynamics at . Applying Equation (1) gives an enclosed mass of M⊙ within pc (for ). ? did not consider any black hole mass estimates below M⊙ secure, apart from those in the Milky Way and M32. The mass of the nucleus of Mrk 231 was estimated at M⊙ by ?. This was based on the velocity width of the H line and an estimate of the inner radius of the broad-line region (BLR) of pc, derived from the UV:X-ray spectral index, but, as noted by ?, the relationship used is only reliable in a statistical sense. ? found that it could be in error by an order of magnitude in comparison with less model-dependent reverberation mapping. More recent Chandra observations by ? showed that X-ray emission from the unresolved nucleus of Mrk 231 is variable on a timescale of hours, suggesting an origin within tens of AU. The 2 keV flux is underluminous with respect to the UV continuum and is best fitted by a model of absorption and scattering on scales pc. If this is so, then the black hole mass estimated using the BLR radius is reduced by at least an order of magnitude, closer to our value.
4.3 Maser clouds
The component positions (fitted as explained in Section 2.2) measure the locations of the maximum line-of-sight amplification of maser emission from unresolved clouds within the area enclosed by the contours in Fig. 2. We use the term cloud to represent a discrete region which may be defined by the density, temperature or OH abundance required for masing, or by the local velocity gradient. The individual maser components are unresolved so that the size of the restoring beam ( pc) provides the highest upper limit to cloud size.
OH amplification occurs over at least the distance wherein the velocity changes by less than the thermal line width, which is km s-1 at the probable temperature of 85 K in the maser region (?). The model of a rotating torus described in Section 4.2 leads to an estimate of km s-1 pc-1 for the maximum line of sight velocity gradient, implying a minimum gain length of 0.25 pc. ? show that propagation is possible over a larger velocity difference, see Section 5.2.
The OH masers were resolved out by ? using global VLBI at 5-mas (4-pc) resolution but, using a tapered beam (coarsened resolution), they detected weak emission from the 1667-MHz line only. The position and peak flux density appear similar to those in the EVN image. This implies a maximum cloud size pc, since maser emission from a single 5-mas cloud would be beamed into a much smaller angle, but the emission per interferometer beam from a collection of clouds of smaller radii decreases in proportion to the beam area. These constraints suggest that the masers propagate through clouds in the size range of 0.25–4 pc (if they are approximately spherical) giving a typical diameter pc.
? infer an ionised number density of m-3 at 20 pc from the nucleus (see Section 4.5), close to our estimate of . This is only one or two orders of magnitude smaller than the total number density supporting OH maser emission (see ? as applied in Section 5.2) and such a high ionised fraction seems unlikely in clouds cool enough to support masing, suggesting that the torus contains cool dense molecular clumps embedded in a highly ionised medium. ? present a disc model in which the inner 20 pc is predominantly ionised, the next 100 pc contains neutral atomic gas and molecules and dust extends out to 400 pc, with a height:depth ratio . Our results broadly support this, as ? also note that the phases may be present in mixtures of differing proportions at different radii, allowing the presence of OH within 120 pc of the nucleus. The thickness of the OH torus would then be 10 pc or less. A similar stratification of all 3 phases in a thin disc has only been directly measured in a few other active galaxies such as NGC 4261 (?; ?; ?). This is not, however, the whole story, as the disc is also warped, see Section 4.5.
4.4 Starburst and jet emission
? and ? deduce that the radio continuum emission within kpc of the nucleus is mostly of starburst origin, probably triggered by a merger – years ago. A Hubble Space Telescope Wide Field and Planetary Camera 2 (HST WFPC2) image taken using the F814W (red) filter (Fig. 6) shows bright knots which are probably sites of star formation, near the southern rim of the MERLIN radio contours (corresponding to a 1.6-GHz brightness temperature of K). The transfer function for the optical image has been chosen to show extended emission at the expense of saturating the brightest regions. There is in fact a compact core and the images were registered by aligning this with the radio peak. The absence of strong optical emission at intermediate distances does not rule out a starburst origin for the radio emission since obscuring dust would only allow us to detect the longer wavelengths. The core could still be visible through a central cavity in the dusty disc as suggested by the free-free absorption model of ?.
Whilst star formation can explain most of the smooth extended emission on MERLIN scales, the jet and its base are likely to be the source of the southern ridge and the polarized emission, supporting an N–S direction of the approaching jet from a few tens to a few hundred pc from the nucleus. This seems to be in front of the OH torus, see Section 5.1. ? show that the spectral index in this direction is steeper than in the surrounding diffuse emission, suggesting a jet extending due south out to pc. This is supported by other VLBA and global VLBI images with 10 – 100 mas resolution (?; ?). VLA observations on larger scales show a 50-kpc region of diffuse 1.4-GHz emission extended to the south (?; ?). This is not aligned with the apparently tidal optical tails seen on a similar scale to the north and south (?). WSRT observations reveal radio emission out to 120 kpc (?). The extended radio emission may be associated with star formation (e.g. as a result of a superwind) and/or with the extension of the jet (see discussion in ?).
4.5 Misalignments
The axes of symmetry of the OH velocity distribution deduced from observations using MERLIN (Section 4.2) and the EVN (?) are within 10of a NW-SE direction. ? used the VLBA to measure HI absorption modelled by a torus with an axis at an angle of inclination of 45°, similar to that of the OH torus. Absorption is not detected towards the core nor the brighter jet lobe, reinforcing the model in which the southern/western jet is approaching and the neutral material is in a torus with a sufficiently large central cavity ( mas) that the core is not obscured at our viewing angle. However, the HI velocity gradient, of 1.15 km s-1 mas-1 across 200 mas, runs W to E, giving an N–S symmetry axis. The magnitude of the velocity gradient is consistent with solid body rotation of a flattened mass distribution as discussed in Section 4.2. CO emission on arcsec scales (?) suggests an almost face-on disc rotating about an axis running N–S. These results imply misalignements of in both spatial axes between the OH and CO emission regions, with the HI disc partially aligned with both. These misalignments can be understood in terms of a warped disc seen almost face on. The kinematic axis of such a model can shift with distance from the centre and even appear to change direction (see fig. 3 in ?). A warped disc was also found in the inner 0.3 arcsec of Mrk 231 by ? using Keck NIR - and -band spectroscopy of stellar absorption, at an angle of inclination of only 10°. Alternatively, misaligned orbital systems of ionised and neutral gas are seen in e.g. M82, explained by ? using the barred potential model of ?. Such models cannot, however, explain fully the segregation of different neutral species seen in Mrk 231.
The highest resolution images (?), made using the VLBA at 15 GHz, show a mas-scale jet at a position angle of 245. All other available radio images show that from mas outwards the jet (and counter jet, where detected) run approximately N-S (Section 4.4). The OH axis on scales of 60–250 mas is at an angle close to the direction of the jet in the innermost few mas, so we must examine whether the jet is being deflected by collision with the masing torus. If this produced a large shocked slab, efficient maser amplification could occur perpendicular to the shock (?). If the mas-scale jet was at to the line of sight, its deprojected trajectory would be comparable to the size of the maser region. Proper motion measurements imply that a jet at such a small angle would be strongly relativistic, but ? measure an apparent proper motion of only . They argue that free-free absorption is a better explanation (than relativistic boosting) for the high jet-counterjet brightness ratio. Moreover, in order to impede the jet, the OH torus should be close to edge-on, but in fact it is at an angle of inclination of °, making the jet collision hypothesis very unlikely on the scale of the maser region.
? found a region of high velocity dispersion in the north west of the inner part of the torus which they suggest could be due to jet-cloud interactions. We found even higher anomalous velocities in the central region but in Section 4.2.2 we showed that could be due to the black hole. As ? also point out, outflows would produce a separation between red-and blue-shifted molecular emission, but the detailed velocity gradients resolved by HI and OH observations are more characteristic of rotation than of outflow although local anomalies caused by interactions are possible.
5 Maser amplification constraints
5.1 Maser gain
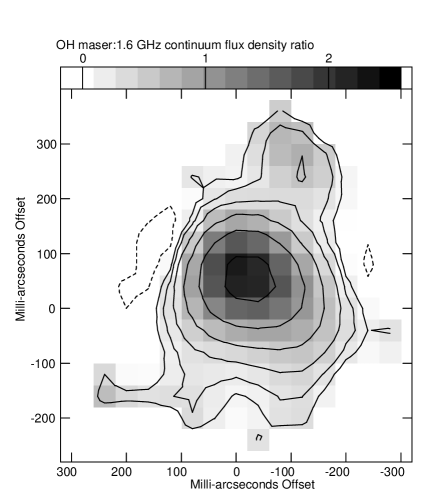
All the maser emission is projected against a region enclosed by the 20 mJy beam-1 contour of continuum emission at () mas2 resolution. The corresponding 1.6-GHz continuum brightness temperature of K is a more effective source of 1.6-GHz seed photons than spontaneous emission from OH at 85 K. Summing all the maser emission from both transitions into one image gives a peak at (, ) = (–28, 49) mas, 22 mas from the continuum peak (Section 3.1). We use the continuum image at 120-mas resolution for comparison with the summed maser-only image in order to estimate the ratio of maser emission to 1.6-GHz continuum emission, shown in Fig. 7. The lowest maser contour is error-dominated and not used in analysis. The maximum occurs in the brightest central region, at (, ) = (–22, 55) mas with an uncertainty 7 mas, located 8 mas from the peak of the combined maser emission. Note that the apparent will be an underestimate in any regions where appreciable continuum emission is in the foreground with respect to the masers. The site of the maximum ratio is a more significant distance of () mas north of the continuum peak, in the direction of stronger HI absorption (?), suggesting that, in this region, the observed neutral material is in front of the radio continuum and that the maximum observed gain is close to the true value. In the whole area with significant maser emission the average .
Fig. 7 shows that is higher in the NW region than in SE and SW and there is a slightly lower-ratio trough running due S from the centre, in the direction of the jet on similar scales (see references in Section 4.4). Bright continuum hotspots which reach K at 1.6 GHz are revealed by global VLBI (?) but these are not coincident with enhanced OH emission. The brightest radio continuum might originate in regions hostile to masers and/or in the foreground, such as from the approaching jet. Both would lead to an underestimate of the maser gain.
The peak of the integrated OH emission imaged by the EVN observations of ? is mJy beam-1. This is 1/13 of the MERLIN peak, the same ratio as that between the EVN and MERLIN beam areas. Maser emission outside the central 150 mas would have a maximum flux density of mJy in the EVN beam, just below the limit for reliable detection. ? detect continuum emission down to 4 mJy beam-1 in the innermost 70 mas of their maser region but the brightest maser emission is outside any detectable continuum at their resolution. They argue that this indicates a maser gain of in all but a few patches, consistent with the MERLIN value of for region C. This is confirmed by scaling the MERLIN continuum flux density to the EVN resolution, which shows that all the maser emission detected by the EVN is associated with radio continuum mJy per EVN beam. The EVN maser – continuum peak offset is similar to the offset seen in the MERLIN images.
The hyperfine ratio between emission from the 1667- and 1665-MHz transitions is often quoted as the ratio of the peaks in the frequency spectrum, in Fig. 1, but this could be misleading as both peaks contain tails of emission from the other transition. Comparing the total resolved emission from the images could lead to an overestimate as a greater proportion of the fainter 1665-MHz transition is likely to be below our detection limit. To get the most accurate hyperfine ratio we compared the peak flux densities in each of the 5 spatial regions. The error in each case (derived from the signal to noise ratio) is . The maximum value of occurs in the brightest region, C. The ratios in the other 4 regions have a flux-weighted mean of . The overall mean is , the same as the LTE line ratio, indicating that the masers are unsaturated and that the opacity is low at the masing frequencies. In this regime, the relationships expressed by ? are applicable and we use them to derive the filling factor. The 1667:1665 MHz line ratio is related to the unsaturated optical depth of the 1667-MHz line by
| (2) |
The line-to-continuum ratio is derived from the images containing emission from both lines, so the ratio for the 1667-MHz line alone is given by . The apparent optical depth at 1667 MHz is derived from the line-to-continuum ratio using
| (3) |
and this is related to the maser cloud covering factor by
| (4) |
Using Equation (3), we obtain , and for the central peak, the other regions and the overall average, respectively. The error in the central region is 0.1; elsewhere the dispersion of dominates the uncertainty. For each region, if we take , Equation (2) is satisfied within the uncertainties, so from Equation (4) we deduce that . Note that ? obtained values of , similar to our peak value and , similar to our overall average. This is likely to be due to the good spectral resolution but low angular resolution of the data then available and comparison of such values leads to an underestimate of the covering factor if inhomogeneities in the masing region are unresolved.
A covering factor close to unity is supported by the lack of any very bright compact masers (?; Section 4.3) since two or more clouds overlapping along the line of sight produce spectacular maser amplification (e.g. ?) which favours 1667-MHz emission ( ?; see Section 6). This is not seen: higher resolution VLBI observations (including upper limits) by ? and ? (see Section 4.3) are consistent with a similar hyperfine ratio on all angular scales in Mrk 231.
5.2 Physical properties of masing regions
The megamaser model of ? provides constraints on the physical conditions producing the Mrk 231 masers. Their ‘standard’ model shows that a velocity change of 1.7 km s-1 across a 3-pc cloud supports mainline maser gains in the range we observe. It is also compatible with the 1667:1665-MHz line ratio which we observe and with the relative strengths of the satellite lines (?; see Section 1). ? do not consider clouds less than 3 pc in size but find that emission is suppressed in substantially larger clouds and that smaller velocity gradients produce a much higher value of than is seen in Mrk 231.
In Section 4.3 we estimated a typical maser cloud size of 1 pc, over which the velocity change = 1.7 km s-1. The size is uncertain to within at least a factor of 4 but within a regular, thin, torus we can assume that the velocity gradient is constant along any particular line of sight. Using equation 9.1.2 from ?, in our units,
| (5) |
where the number density of OH, , is in m-3 and the excitation temperature is –10 K assuming 1 per cent inversion. This gives an average m-3 for , and an OH column density of m-2 in 1-pc masing clouds. CO observations (?) show an average molecular column density of m-2 within 500 mas of the nucleus. If the OH and the CO are cospatial the fractional OH number density is and the clouds have a molecular number density of m-3. The fractional abundance of OH could be even higher if the CO extends to a greater depth than the OH which we observe.
The 85 K dust temperature obtained by ? and ? produces too high a value of for m-3, in the standard model of ?. The models do, however, show a trend towards lower for smaller clouds and/or a larger velocity gradient so our results might be compatible with our preferred -pc clouds. The biggest discrepancy arises from our estimated m-3, which is twice the highest value considered by ?. If the OH maser pump in Mrk 231 is extremely effective with respect to the rate of stimulated emission (consistent with the unsaturated maser behaviour), a lower is possible; for example an inversion as high as 10 per cent would reduce to m-3.
5.3 Maser efficiency
The efficiency of a radiative maser pump is the product of the ratio of the OH maser to IR pump photon rates and the the line profile ratio. IR and optical data including polarimetry on various scales (?; ?; ?; see Section 4.1) suggest that the IR emission within the central arcsec has two distinct origins; a polarized MIR source close to the core and a cooler 60-m source at up to a few hundred pc, of mainly starburst origin, providing the maser pump.
The main IR lines exciting the maser population inversion are at 35 and 53 m. The contribution of the 35-m line was demonstrated by absorption measurements of the megamaser galaxy Arp 220 (?) in relation to the 1667-MHz maser luminosity. The photon rate ratio between frequencies , , is given by , where and are the flux densities and is the maser beaming angle. We assume that the IR emission covers 4 Sr as ? have shown that emission in this range comes from a region comparable in size to the maser region of Mrk 231 (Section 4.1). The line profile ratio is equivalent to where is the OH thermal line width. Combining these expressions and cancelling common terms gives
| (6) |
We extrapolate between the IRAS measurements of Mrk 231 at 25 and 60 m given by ? to estimate that, at THz (corresponding to 35 m), Jy with per cent accuracy. The OH maser peak Jy at MHz. The maser emission from Mrk 231 almost certainly covers most of Sr and might even appear brighter to an observer looking at the torus edge-on (see Section 6). This leads to which is indeed low for maser models such as those of ? who suggest that lies between 0.001 – 0.01. The low efficiency and the maximum gain constrained by (Section 5.1) are consistent with unsaturated maser amplification due to a population inversion provided by IR radiation from dust (?). In other words, the maser population inversion is probably high but only absorbs a tiny fraction of the IR radiation produced by this ULIRG.
6 Mrk 231 among other megamaser galaxies
Mrk 231 is the only known Seyfert 1 which supports OH megamasers. They are distributed in a torus which is more nearly face-on (see Section 4) than the distributions in other megamaser galaxies with Seyfert 2 characteristics. The OH masers in Mrk 273, III Zw 35 and Arp 220, have been modelled as discs or tori rotating about axes at inclinations of to the line of sight (?; ?; ?, respectively).
Mrk 273 is classed as a Seyfert 2 and has an HI absorption column density of m-2 (spin temperature/filling factor), almost three times greater than estimates for Mrk 231, assuming the same conditions (?; ?). MERLIN observations (?) show that the brightest maser peak in Mrk 273 is 67 mJy beam-1, slightly offset from the 12 mJy beam-1, 1.6-GHz continuum peak. The maser gain is much greater than in Mrk 231, suggesting amplification along a longer path length in Mrk 273, through an edge-on torus. The 1667:1665-MHz peak ratio in Mrk 273 is . ? measure a lower ratio on larger scales (e.g. WSRT) and a higher ratio on smaller EVN scales, but even the most compact masers in Mrk 273 are still unsaturated. Using the method outlined in Section 5.3 gives for the pumping efficiency in Mrk 273, higher than in Mrk 231 by a factor of 4, which may be due to a combination of a smaller beaming angle and better maser amplification (which can be achieved without saturation if clouds overlap along the line of sight). ? estimate an enclosed compact mass of M⊙, larger than the value of M⊙ measured on MERLIN scales (?; ?)222Note that the method is fully explained in ? but an arithmetic slip leads to the wrong result; the correct value is given in ?. which suggests that Mrk 273 also contains a massive compact core determining the maser kinematics on the smallest scales. Moreover, Arp 220 (?), III Zw 35 and IRAS 17208-0014 (?) all have indications of tori closer to edge-on and higher maser gains and/or hyperfine ratios than Mrk 231.
The classical relation between OH megamaser, radio continuum and IR luminosities (?) is given by
| (7) |
where , and are the maser, radio and continuum luminosities respectively and . This rests on the assumptions that the masers are in a position to amplify the radio continuum, that they are unsaturated and that the radio continuum and IR flux densities have a linear relationship. These are justified if the dominant sources of all three types of radiation have a common origin in starburst activity, but not if an AGN or jets are significant radio sources. ? obtain (1.66) with (without) taking the Malmquist bias into account, whilst ? find for various samples, with a wide range even for a more complete nearby sample or by using other completeness qualifiers. ?, using high signal-to-noise OH profiles, find that , and are increasingly poorly correlated for fainter sub-samples, arriving at a best value of . This could be due to near-saturation of most OH megamasers (but our results suggest otherwise), or because the single pan-galactic values of and usually employed mask local variations in emissivity. Such intrinsic differences are very probable in ULIRGs viewed at various times since the original mergers apparently responsible. There is another possibility, suggested by ?, which is simply orientation. This is clearly important in explaining the maser differences between Mrk 231 and Mrk 273 and other edge-on systems, as it is in explaining their Seyfert characteristics.
The status of an AGN in the maser region of Mrk 273 is contentious but the central mass condensation ( M⊙, ?; ?) appears to be orders of magnitude larger than that in Mrk 231. If galaxy mergers are responsible for funnelling material into the cores, the initial core mass or the time since merger must be greater for Mrk 273. In the latter case, the starburst activity in both galaxies suggests that it preceeds the emergence of an AGN but also outlives obvious nuclear activity.
7 Conclusions
MERLIN detects and resolves all the OH mainline maser emission and 1.6-GHz radio continuum within several hundred pc of the Seyfert 1 nucleus of Mrk 231. The continuum emission declines fairly smoothly in all directions from a central peak but is more extended to the S. It is 0.4 per cent polarized and the polarization angle implies that the associated magnetic field runs N-S, similar to the jet direction on MERLIN scales e.g. ?. Most of the extended radio emission detected by MERLIN is probably of starburst origin but we see a region of apparently low maser gain running S which might be due higher foreground radio continuum from the approaching jet .
The maser distribution shows a gradient of () km s-1 pc-1 along the 420-pc major axis from SE to NW. The NE and SW contain extended regions at intermediate velocities. This is compelling evidence for a molecular region rotating about an axis at at a position angle of (Section 4.2.1). The maser kinematics suggest that the torus contains a mass density of M⊙ pc-3. Comparison with the EVN results for the innermost 60 pc (?) shows that the most likely configuration at pc is solid body rotation of a flattened mass distribution. VLBI observations (?; ?) suggest that the inner rim of the torus is at pc. The MERLIN data alone reveal anomalously high velocity emission within 50 pc of the core. If this is at and arises from material in Keplerian orbit around the central black hole, a mass of M⊙ is implied, making it one of the lightest active black holes yet weighed.
The orientation of the axis of the maser torus is consistent with EVN data but misaligned with the radio jets on comparable scales and with the axes of HI and larger-scale CO rotation, all of which are projected in roughly N–S directions (Section 4.4). It is likely that the molecular torus is warped and it is also possible for different species to follow different trajectories if neutrals, ions and stars are influenced differently in a barred potential.
The maser intensity as a function of position is not closely correlated with the 1.6-GHz continuum. The apparent optical depth is consistently close to the unsaturated maser optical depth. The maser gain with respect to the radio continuum is . The average 1667:1665-MHz hyperfine emission ratio is the thermal equillibrium value of 1.8. The fraction of maser emission detected from both mainline transitions remains proportional to the resolution over 4 orders of magnitude, from single-dish (9 arcmin, ?) through WSRT, MERLIN and EVN resolutions (14 arcsec to 40 mas, this paper and ?) to global VLBI (5 mas, ?). These properties imply that the maser emission is unsaturated with a negative optical depth less than one (?), from clouds with a covering factor close to unity.
The kinematics of the torus suggest that the maser emission can be amplified over a velocity coherent path length of pc, see Section 4.3. The peak maser brightness temperature appears to be K for the 1667-MHz line for all spatially resolved observations. This suggests that the maser clouds have a consistent distribution and filling factor on scales from the global VLBI resolution (4 pc) up to the MERLIN resolution of 100 pc, and that they are smaller than the finest resolution. These results imply cloud sizes within a factor of four of 1 pc. The models of ? give a number density of m-3 with m-3 for a 10 per cent population inversion in the masing transitions. The efficiency with which MIR radiation (?) is converted to maser emission is low, (Section 5.3), so only radiative pumping (?) is required.
These results show conclusively that there are no very high surface brightness 1667-MHz masers in Mrk 231, which can be explained if they are located in a torus which is thinner in the tangential direction than in the radial direction (with respect to the galactic dynamic centre). From our viewpoint, the more face-on orientation of a Seyfert 1 like Mrk 231 produces a shorter maser amplification depth and lower gain than occurs in megamaser galaxies such as Mrk 273 which have Seyfert 2 characteristics, as discussed in Section 6. The unified scheme model (?) explains the optical characteristics of Seyfert galaxies in terms of the orientation of an inner pc-scale torus. We find that, where an associated larger-scale torus containing starburst activity is traced by megamasers, it appears that orientation can also explain some of the variation in apparent maser intensity relative to the radio continuum.
8 Acknowledgements
MERLIN is the multi-element radio linked interferometer network, operated by the University of Manchester on behalf of PPARC. We warmly thank Drs. Alan Pedlar and Rob Beswick and Professors Phil Diamond and Robert Laing for useful discussions. We are very grateful to Dr. Pedlar for encouraging our use of his MERLIN archive continuum data and to Drs. Peter Thomasson, Tom Muxlow and Simon Garrington and the other MERLIN staff for assistance with the observations and data reduction. We have made use of observations made with the NASA/ESA Hubble Space Telescope, obtained from the data archive at the Space Telescope Science Institute. STScI is operated by the Association of Universities for Research in Astronomy, Inc. under NASA contract NAS 5-26555.
We thank the anonymous referee for very perceptive and helpful comments which have added depth to this paper. We acknowledge the use of data reduction software and hardware provided by the PPARC STARLINK project and of the services provided by NASA ADS and by CDS. AMSR thanks the AVO and AstroGrid for funding during this project and has made use of their Virtual Observatory tools.
References
- [Antonucci & Miller¡1985¿] Antonucci R. R. J., Miller J. S., 1985, ApJ, 297, 621
- [Baars et al.¡1977¿] Baars J. W. M., Genzel R., Pauliny-Toth I. I. K., Witzel A., 1977, A&A, 61, 99
- [Baan¡1985¿] Baan W. A., 1985, Nature, 315, 26
- [Baan¡1989¿] Baan W. A., 1989, ApJ., 338, 804
- [Baan, Haschick & Henckel¡1992¿] Baan W. A., Haschick A., Henckel C., 1992, AJ, 103, 728
- [Baan et al.¡1992¿]
- [Baum et al.¡1993¿] Baum S. A., O’Dea C. P., Dallacassa D., de Bruyn A. G., Pedlar A., 1993, ApJ, 419, 553
- [Binney & Tremaine¡1987¿] Binney J., Tremaine S., 1987, Galactic Dynamics. Princetown Univ. Press, Princetown, NJ
- [Boksenberg et al.¡1977¿] Boksenberg A., Carswell R. F., Allen D. A., Fosbury R. A. E., Penston M. V., Sargent W. L. W., 1977, MNRAS, 178, 451
- [Bryant & Scoville¡1996¿] Bryant P. M., Scoville N. Z., 1996, ApJ, 457, 678
- [Carilli, Wrobel & Ulvestad¡1998¿] Carilli C. L., Wrobel J. M., Ulvestad J. S., 1998, AJ, 115, 928
- [Carilli et al.¡1998¿]
- [Cohen¡1979¿] Cohen R. J., 1979, MNRAS, 187, 839
- [Cole et al.¡1999¿] Cole G. H. J., Pedlar A., Holloway A.J., Mundell C. G., 1999, MNRAS, 310, 1033
- [Condon¡1997¿] Condon J. J., 1997, PASP, 109, 166
- [Condon et al.¡1998¿] Condon J. J., Cotton W. D., Greisen E. W., Yin Q. F., Perley R. A., Taylor G. B., Broderick J. J., 1998, AJ, 115, 1693
- [Darling & Giovanelli¡2002¿] Darling, J., Giovanelli, R., 2002, AJ, 124, 100
- [Davies, Tacconi & Genzel¡2004¿] Davies R. I., Tacconi L. J, Genzel R., 2004, ApJ, 613, 781
- [Davies et al.¡2004¿]
- [Diamond et al.¡2002¿] Diamond P., Garrington S. T., Gunn A G., Leahy J. P., McDonald A., Muxlow T. W. B., Richards A M S., Thomasson P., 2002, The MERLIN User Guide, www.merlin.ac.uk/user_guide/OnlineMUG/
- [Diamond et al.¡1999¿] Diamond P. J., Lonsdale C. J., Smith H. E., Lonsdale C. J., 1999, ApJ, 511, 178.
- [Downes & Solomon¡1998¿] Downes D., Solomon P. M., 1998, ApJ, 507, 615
- [Elitzur¡1992¿] Elitzur M., 1992, Astronomical Masers, Kluwer, Dordrecht
- [Ferrarese¡2002¿] Ferrarese L., in Lee C. H., Chang H.-Y., eds, Current high-energy emission around black holes, World Scientific Publishing, Singapore, p3
- [Gallagher¡2002¿] Gallagher S. C., Brandt W. N., Chartas G., Garmire G. P., 2002, ApJ, 569, 655
- [Genzel et al.¡1998¿] Genzel R. et al., 1998, ApJ, 498, 579
- [Henkel & Wilson¡1990¿] Henkel C., Wilson T. L., 1990, A&A, 229, 431
- [Hutchings & Neff¡1987¿] Hutchings J. B., Neff S. G., 1987, AJ, 93, 14
- [Jaffe et al.¡1996¿] Jaffe W., Ford H. C., Ferrarese L., van den Bosch F., O’Connell R. W., 1996, ApJ, 460, 214
- [Jones & Klebe¡1989¿] Jones T. J., Klebe D., 1989, ApJ, 341, 707
- [Jones & Wehrle¡1997¿] Jones D. L., Wehrle A. E., 1997, ApJ, 484, 186
- [Joseph & Wright¡1985¿] Joseph R. D., Wright G. S., 1985, MNRAS, 214, 87
- [Kandalian¡1997¿] Kandalian R. A., 1997, Astrophysics, 39, 237
- [Kartje, Königl & Elitzur¡1999¿] Kartje J. F., Königl A., Elitzur M., 1999, ApJ, 513, 180
- [Klöckner et al.¡2003¿]
- [Klöckner, Baan & Garrett¡2003¿] Klöckner H.-R., Baan W. A., Garrett M. A., 2003, Nature, 42, 821
- [Klöckner¡2004¿] Klöckner H.-R., 2004, PhD Thesis, Rijksuniversiteit Groningen
- [Klöckner & Baan¡2004¿] Klöckner H.-R., Baan W. A., 2004, A&A, 419, 887
- [Knapen¡2004¿] Knapen, J. H. 2004, in Block D. L., Puerari I., Freeman K. C., Groess R., Block E. K., eds, Penetrating Bars through Masks of Cosmic Dust, Springer, Dordrecht, Ap&SS, 319, 189
- [Knapen et al.¡1997¿] Knapen J. H., Laine S., Yates J. A., Robinson A., Richards A. M. S., Doyon R. & Nadeau D., 1997, ApJL, 490, L29
- [Kneib et al.¡2004¿] Kneib J., van der Werf P. P., Kraiberg Knudsen K., Smail I., Blain A., Frayer D., Barnard V., Ivison, R., 2004, MNRAS, 349, 1211
- [Lonsdale et al.¡2003¿] Lonsdale C. J., Lonsdale C. J., Smith H. E., Diamond P. J., 2003, ApJ, 592, 804.
- [Lonsdale et al.¡1998¿] Lonsdale C. J., Diamond P. J., Smith H. E.& Lonsdale C. J., 1998, ApJ, 493, L13.
- [Ma et al.¡1998¿] Ma C., et al., 1998, AJ, 116, 516
- [Melnick & Mirabel¡1990¿] Melnick J., Mirabel I. F., 1990, A&A, 231, L19
- [Neff & Ulvestad¡1988¿] Neff S. G., Ulvestad J. S., 1988, AJ, 96, 841
- [Norman & Scoville¡1988¿] Norman C., Scoville, N., 1988, ApJ, 332, 163
- [Patnaik et al.¡1992¿] Patnaik A. R., Browne I. W. A., Wilkinson P. N., Wrobel, J. M., 1992, MNRAS, 254, 655
- [Padovani, Burg & Edelson¡1990¿] Padovani P., Burg. R., Edelson R. A., 1990, ApJ, 353, 438
- [Padovani et al.¡1990¿]
- [Pihlström et al.¡2001¿] Pihlström Y. M., Conway J. E., Booth R. S., Diamond P. J., Polatidis A. G., 2001, A&A, 377, 413
- [Randell et al.¡1995¿] Randell J., Field D., Jones K. N., Yates J. A., Gray M. D., 1995, A&A, 300, 659
- [Richards, Yates & Cohen¡1999¿] Richards A. M. S., Yates J. A., Cohen R. J., 1999, MNRAS, 306, 954
- [Richards et al.¡2001¿] Richards A. M. S. et al., 2001, in Schilizzi R., Vogel S. N., Paresce F., Elvis S., eds, Proceedings of IAU Symposium 205, ASP, San Francisco, 205, 212
- [Roche & Chandler¡1993¿] Roche P. F., Chandler C. J., 1993, MNRAS, 265, 486
- [Rovilos et al.¡2003¿] Rovilos E. Diamond P. J., Lonsdale C. J., Lonsdale C. J., Smith H. E, 2003, MNRAS, 342, 373
- [Sanders & Mirabel¡1996¿] Sanders D. B., Mirabel I. F., 1996, ARA&A, 34, 749
- [Sanders, Scoville & Soifer¡1991¿] Sanders D.B., Scoville N. Z., Soifer B. T., 1991, ApJ, 370, 158
- [Sanders et al.¡1988¿] Sanders D.B., Soifer B. T., Elias J. H., Madore B. F., Matthews K., Neugebauer G., Scoville N. Z., 1988, ApJ, 325, 74
- [Schweizer¡1998¿] Schweizer F., 1998, in Kennicutt Jr. R. C., Schweizer F., Barnes J.E., Friedli D., Martinet L., Pfenniger D., eds, Saas-Fee Advanced Course 26, Springer-Verlag, Berlin/Heidelberg, 105
- [Siebenmorgen & Efstathiou¡2001¿] Siebenmorgen R., Efstathiou, A., 2001, A&A, 376, L35
- [Skinner et al.¡1997¿] Skinner C. J., Smith H. A., Sturm E., Barlow M. J., Cohen R. J., Stacey G. J., 1997, Nat., 386, 472
- [Smith et al.¡2004¿] Smith J. E., Robinson A., Alexander D. A., Young S., Axon D. J., Corbett E. A., 2004, MNRAS, 350, 140
- [Soifer et al.¡2000¿] Soifer B. T. et al., 2000, AJ, 119, 509
- [Stavely-Smith et al.¡1987¿] Stavely-Smith L., Cohen R. J., Chapman J. M., Pointon L., Unger S. W., 1987, MNRAS, 226, 689
- [Taylor et al.¡1999¿] Taylor G. B., Silver C. S., Ulvestad J. S., Carilli C. L., 1999, ApJ, 519, 185
- [Thomson, Moran & Swenson¡2001¿] Thomson A. R., Moran J. M., Swenson J. R., 2001, Interferometry and Synthesis in Radio Astronomy, Wiley, New York
- [Ulvestad, Wrobel & Carilli¡1999¿] Ulvestad J. S., Wrobel J. M., Carilli C. L., ApJ, 1999, 516, 127
- [Ulvestad et al.¡1999a¿]
- [Ulvestad et al.¡1999b¿] Ulvestad J. S., Wrobel J. M., Roy A. L., Wilson A. S., Falcke H., Krichbaum T. P., 1999, ApJ, 517, L81
- [van Langevelde et al.¡2000¿] van Langevelde H. J., Pihlstroëm Y. M., Conway J. E., Jaffe W., Schilizzi, R. T., 2000, A&A, 354, L45
- [Wills et al.¡2000¿] Wills K. A., Das M., Pedlar A., Muxlow T. W. B., Robinson T. G., 2000, MNRAS, 316, 33
- [Yates et al.¡2000¿] Yates J. A., Richards A. M. S., Wright M. M., Collett J. L., Gray M. D., Field D., Cohen R. J., 2000, MNRAS, 317, 28
Appendix A
| Reg. | Freq. | y | |||||
| (MHz) | (km s-1) | (mas) | (mJy | ||||
| b-1) | |||||||
| (1) | (2) | (3) | (4) | (5) | (6) | (7) | (8) |
| Identified with 1665 MHz line | |||||||
| SE | 1596.367 | 12954 | 12427 | 236 | –142 | 96 | 3 |
| SE | 1596.492 | 12930 | 12405 | 88 | –153 | 77 | 3 |
| SE | 1596.617 | 12905 | 12382 | 154 | –104 | 91 | 2 |
| SE | 1596.742 | 12881 | 12360 | 97 | –105 | 112 | 3 |
| SE | 1596.867 | 12856 | 12337 | 147 | –154 | 79 | 3 |
| C | 1596.367 | 12954 | 12427 | 0 | 53 | 120 | 2 |
| C | 1596.492 | 12930 | 12405 | 8 | 23 | 87 | 2 |
| C | 1596.617 | 12905 | 12382 | 19 | 16 | 63 | 4 |
| C | 1596.742 | 12881 | 12360 | 34 | –11 | 44 | 5 |
| C | 1596.867 | 12856 | 12337 | 9 | 23 | 39 | 6 |
| C | 1596.992 | 12832 | 12315 | –5 | 34 | 31 | 7 |
| C | 1597.117 | 12807 | 12292 | –7 | 35 | 29 | 8 |
| C | 1597.242 | 12783 | 12270 | –6 | 6 | 24 | 9 |
| C | 1597.367 | 12758 | 12247 | –6 | 29 | 19 | 11 |
| C | 1597.492 | 12734 | 12225 | –1 | 28 | 17 | 12 |
| C | 1597.617 | 12709 | 12202 | –18 | 26 | 18 | 11 |
| C | 1597.742 | 12685 | 12180 | –24 | 37 | 12 | 17 |
| C | 1597.867 | 12660 | 12157 | –28 | 50 | 12 | 16 |
| C | 1597.992 | 12636 | 12135 | –14 | 56 | 11 | 17 |
| C | 1598.117 | 12611 | 12112 | –29 | 64 | 13 | 14 |
| C | 1598.242 | 12588 | 12090 | –16 | 64 | 14 | 14 |
| C | 1598.367 | 12563 | 12067 | –30 | 68 | 20 | 10 |
| SW | 1597.492 | 12734 | 12225 | –195 | –31 | 59 | 3 |
| SW | 1597.617 | 12709 | 12202 | –113 | 30 | 105 | 3 |
| SW | 1597.742 | 12685 | 12180 | –122 | –43 | 55 | 4 |
| SW | 1597.867 | 12660 | 12157 | –145 | –7 | 41 | 5 |
| SW | 1597.992 | 12636 | 12135 | –131 | –12 | 67 | 3 |
| SW | 1598.117 | 12611 | 12112 | –138 | 9 | 54 | 4 |
| SW | 1598.242 | 12588 | 12090 | –133 | 77 | 83 | 2 |
| SW | 1598.992 | 12441 | 11955 | –96 | –89 | 55 | 3 |
| SW | 1599.117 | 12416 | 11932 | –92 | –48 | 63 | 3 |
| SW | 1599.242 | 12392 | 11910 | –28 | –91 | 55 | 3 |
| SW | 1599.367 | 12367 | 11887 | –57 | –106 | 59 | 3 |
| NE | 1598.742 | 12490 | 12000 | 73 | 66 | 68 | 3 |
| NE | 1598.867 | 12465 | 11977 | 58 | 4 | 71 | 3 |
| NE | 1598.992 | 12441 | 11955 | 48 | 42 | 88 | 3 |
| NE | 1599.117 | 12416 | 11932 | 86 | 53 | 65 | 3 |
| NE | 1599.242 | 12392 | 11910 | 106 | 18 | 61 | 3 |
| NE | 1599.367 | 12367 | 11887 | 92 | 21 | 49 | 4 |
| NE | 1599.492 | 12343 | 11865 | 103 | –1 | 46 | 4 |
| NE | 1599.617 | 12318 | 11842 | 92 | –30 | 34 | 5 |
| NE | 1599.742 | 12295 | 11820 | 75 | –11 | 82 | 3 |
| NW | 1598.742 | 12490 | 12000 | –33 | 158 | 75 | 3 |
| NW | 1598.867 | 12465 | 11977 | –80 | 136 | 71 | 3 |
| NW | 1598.992 | 12441 | 11955 | –135 | 117 | 53 | 3 |
| NW | 1599.117 | 12416 | 11932 | –105 | 145 | 59 | 3 |
| NW | 1599.242 | 12392 | 11910 | –19 | 169 | 43 | 3 |
| NW | 1599.492 | 12343 | 11865 | 41 | 151 | 70 | 3 |
| NW | 1599.617 | 12318 | 11842 | –24 | 169 | 56 | 3 |
| NW | 1599.867 | 12270 | 11797 | –73 | 181 | 70 | 3 |
| NW | 1599.992 | 12246 | 11775 | –89 | 187 | 76 | 3 |
| NW | 1600.117 | 12221 | 11752 | –87 | 172 | 85 | 2 |
| NW | 1600.242 | 12197 | 11730 | –127 | 160 | 65 | 3 |
| NW | 1600.367 | 12172 | 11707 | –152 | 209 | 49 | 3 |
Maser components in Mrk 231. Reg. Freq. y (MHz) (km s-1) (mas) (mJy b-1) (1) (2) (3) (4) (5) (6) (7) (8) Identified with 1667 MHz line SE 1598.367 12930 12405 35 –154 64 3 SE 1598.492 12906 12383 21 –72 49 4 SE 1598.617 12881 12360 56 –64 45 4 SE 1598.742 12857 12338 24 –94 47 4 SE 1598.867 12832 12315 8 –80 71 3 C 1598.492 12906 12383 –29 51 15 12 C 1598.617 12881 12360 –15 46 13 14 C 1598.742 12857 12338 –21 30 11 17 C 1598.867 12832 12315 –21 24 11 18 C 1598.992 12808 12293 –23 20 10 18 C 1599.117 12783 12270 –19 21 9 21 C 1599.242 12759 12248 –23 31 8 23 C 1599.367 12734 12225 –23 34 7 27 C 1599.492 12710 12203 –24 39 7 27 C 1599.617 12685 12180 –24 47 6 31 C 1599.742 12661 12158 –25 55 5 35 C 1599.867 12636 12135 –28 62 5 37 C 1599.992 12613 12113 –29 66 5 38 C 1600.117 12588 12090 –36 69 6 32 C 1600.242 12564 12068 –34 69 7 30 C 1600.367 12540 12046 –42 71 9 23 C 1600.492 12515 12023 –44 65 12 17 C 1600.617 12491 12001 –44 55 16 13 C 1600.742 12466 11978 –46 63 19 11 C 1600.867 12442 11956 –67 54 18 12 C 1600.992 12417 11933 –47 48 24 9 C 1601.117 12393 11911 –50 60 40 6 C 1601.242 12368 11888 –78 50 48 5 C 1601.367 12345 11866 –87 58 64 4 C 1601.492 12320 11843 –87 51 38 7 C 1601.617 12296 11821 –1 29 78 3 C 1601.742 12271 11798 10 61 65 4 C 1601.867 12247 11776 –21 78 66 4 C 1601.992 12222 11753 –10 45 96 3 C 1602.117 12198 11731 –29 58 51 5 C 1602.242 12173 11708 –13 62 64 4
Maser components in Mrk 231.
| Reg. | Freq. | y | |||||
| (MHz) | (km s-1) | (mas) | (mJy | ||||
| b-1) | |||||||
| (1) | (2) | (3) | (4) | (5) | (6) | (7) | (8) |
| Identified with 1667 MHz line | |||||||
| SW | 1599.367 | 12734 | 12225 | –146 | 21 | 47 | 4 |
| SW | 1599.492 | 12710 | 12203 | –116 | –35 | 51 | 4 |
| SW | 1599.617 | 12685 | 12180 | –111 | –21 | 39 | 5 |
| SW | 1599.742 | 12661 | 12158 | –118 | –27 | 23 | 8 |
| SW | 1599.867 | 12636 | 12135 | –123 | –19 | 39 | 6 |
| SW | 1599.992 | 12613 | 12113 | –120 | –50 | 27 | 7 |
| SW | 1600.117 | 12588 | 12090 | –138 | –31 | 56 | 4 |
| SW | 1600.242 | 12564 | 12068 | –123 | –12 | 44 | 5 |
| SW | 1600.367 | 12540 | 12046 | –127 | –21 | 39 | 5 |
| SW | 1600.492 | 12515 | 12023 | –141 | –9 | 44 | 5 |
| SW | 1600.617 | 12491 | 12001 | –98 | –66 | 46 | 4 |
| SW | 1600.742 | 12466 | 11978 | –117 | –51 | 45 | 5 |
| SW | 1600.867 | 12442 | 11956 | –105 | –67 | 101 | 2 |
| SW | 1600.992 | 12417 | 11933 | –101 | –59 | 75 | 3 |
| NE | 1599.742 | 12661 | 12158 | 75 | 98 | 65 | 4 |
| NE | 1599.867 | 12636 | 12135 | 74 | 106 | 35 | 5 |
| NE | 1599.992 | 12613 | 12113 | 95 | 71 | 39 | 5 |
| NE | 1600.117 | 12588 | 12090 | 64 | 33 | 65 | 3 |
| NE | 1600.242 | 12564 | 12068 | 65 | 122 | 40 | 5 |
| NE | 1600.367 | 12540 | 12046 | 70 | 87 | 45 | 4 |
| NE | 1600.492 | 12515 | 12023 | 62 | 91 | 63 | 3 |
| NE | 1600.617 | 12491 | 12001 | 38 | 128 | 67 | 3 |
| NE | 1600.742 | 12466 | 11978 | 117 | –15 | 62 | 3 |
| NE | 1600.867 | 12442 | 11956 | 67 | 55 | 73 | 3 |
| NE | 1600.992 | 12417 | 11933 | 38 | 126 | 47 | 5 |
| NE | 1601.117 | 12393 | 11911 | 65 | 141 | 49 | 5 |
| NE | 1601.242 | 12368 | 11888 | 40 | 106 | 63 | 4 |
| NW | 1600.617 | 12491 | 12001 | –65 | 268 | 67 | 3 |
| NW | 1600.742 | 12466 | 11978 | –137 | 245 | 62 | 3 |
| NW | 1600.867 | 12442 | 11956 | –107 | 235 | 73 | 3 |
| NW | 1601.117 | 12393 | 11911 | –164 | 201 | 77 | 3 |
| NW | 1601.367 | 12345 | 11866 | –145 | 188 | 114 | 2 |
| NW | 1601.492 | 12320 | 11843 | 7 | 151 | 98 | 3 |
| NW | 1601.617 | 12296 | 11821 | –51 | 289 | 58 | 5 |
| NW | 1601.742 | 12271 | 11798 | –108 | 262 | 96 | 3 |