17 new very low-mass members in Taurus
Recent studies of the substellar population in the Taurus cloud have revealed a deficit of brown dwarfs compared to the Trapezium cluster population (Briceño et al., 1998; Luhman, 2000; Luhman et al., 2003a; Luhman, 2004). However, these works have concentrated on the highest stellar density regions of the Taurus cloud. We have performed a large scale optical survey of this region, covering a total area of , and encompassing the densest parts of the cloud as well as their surroundings, down to a mass detection limits of 15 MJ. In this paper, we present the optical spectroscopic follow-up observations of 97 photometrically selected potential new low-mass Taurus members, of which 27 are strong late-M spectral type () candidates. Our spectroscopic survey is 87 % complete down to 20 for spectral types later than M4V, which corresponds to a mass completeness limit of 30 MJ for ages 10 Myr and Av 4. We derive spectral types, visual absorption and luminosity class estimates and discuss our criteria to assess Taurus membership. These observations reveal 5 new VLM Taurus members and 12 new BDs. Two of the new VLM sources and four of the new substellar members exhibit accretion/outflow signatures similar to the higher mass classical T Tauri stars. From levels of emission we derive a fraction of accreting sources of 42 % in the substellar Taurus population. Combining our observations with previously published results, we derive an updated substellar to stellar ratio in Taurus of . This ratio now appears consistent with the value previously derived in the Trapezium cluster under similar assumptions of . We find indication that the relative numbers of BDs with respect to stars is decreased by a factor 2 in the central regions of the aggregates with respect to the more distributed population. Our findings are best explained in the context of the embryo-ejection model where brown dwarfs originate from dynamical interactions in small N unstable multiple systems.
Key Words.:
Stars: low-mass, brown dwarfs – Stars: late-type – Stars: luminosity function, mass function – Stars: pre-main sequence1 Introduction
Recent works by Briceño et al. (1998); Luhman (2000); Briceño et al. (2002); Luhman et al. (2003a); Luhman (2004), have revealed a factor of 1.4 to 1.8 deficit of Brown Dwarfs (BDs) in the Taurus cloud compared to the Trapezium cluster, possibly indicating that sub-stellar object formation depends on the environment. If confirmed, the lower abundance of BDs in Taurus could have strong implications on substellar Initial Mass Function (IMF) models. However, as these previous studies were concentrated on high stellar density regions, the majority of the volume occupied by the molecular clouds was left unexplored. There is a possibility that Taurus BDs are not clustered in the same regions as most of the T Tauri stars, or that they have scattered away from their birth sites as proposed by Reipurth & Clarke (2001). If BDs are ejected during their formation, a significant fraction of the substellar content of the central parts of the cloud may have been missed. Indeed, with ejection velocities 1 km.s-1, as predicted by some of the ejection models (Reipurth & Clarke, 2001; Kroupa & Bouvier, 2003a), BDs could have travelled as far as 1o from their birth sites at the Taurus distance in Myr.
The recent availability of large visible and infrared cameras makes it possible to quickly survey large portions of the sky encompassing tens of square degrees down to the sensitivity needed to study the substellar domain. In order to check for the existence of a widespread BD population in Taurus, we have used the Canada-France-Hawaii telescope to perform a large optical survey covering a total of down to completeness limits of =21.8, z′=20.9, corresponding to a mass detection limit of 15 MJ for an age 5 Myr and , according to the pre-main sequence DUSTY model of Chabrier et al. (2000). In this paper, we report on medium resolution optical spectroscopic follow-up observations of 97 photometrically selected Taurus candidate members, of which 27 are strong late-M () candidates. This work is the continuation and completion of the preliminary spectroscopic study published in Martín et al. (2001), where initial candidates were selected from a photometric survey conducted with the CFHT12k camera, which is a subset of the full CFHT Taurus survey described here.
In section 2, we first briefly describe the CFHT photometric survey and candidate selection procedures, then the spectroscopic observations presented here. We derive spectral types, reddenings and luminosity class estimates from both a spectral fitting procedure and the analysis of colors and Na i equivalent widths in section 3. We assess Taurus membership in section 4 and discuss the properties of the new 5 VLM members and 12 BDs identified in this study. In particular, we investigate their accretion/outflow signatures and spatial distribution and update the stellar to brown dwarf ratio in Taurus. Finally, we discuss the implications of our results on the models for substellar object formation in section 5 and summarize our findings in section 6.
2 Observations
2.1 The CFHT optical photometric survey
| Instrument | FOV | Pixel | Date | Area | Band | Detection | Mass limit |
|---|---|---|---|---|---|---|---|
| (deg2) | (′′/pixel) | (deg2) | limit | (, 5Myr) | |||
| CFHT12k | 0.33 | 0.21 | 1999-2001 | 3.6 | R, I, Z’ | 23, 22, 21 | 15 |
| CFHT12k | 0.33 | 0.21 | 2002 | 8.8 | I, Z’ | 22, 21 | 15 |
| Megacam | 1 | 0.19 | 2003-2004 | 24 | i’, z’ | 24, 23 | 10 |
The overall Taurus survey has been performed in 4 successive periods on the Canada-France-Hawaii telescope with the CFH12k and MEGACAM large-scale optical cameras (see Table 1 for a detailed journal). The technical characteristics of the CFH12k and MEGACAM cameras are presented in Cuillandre et al. (2000) and Boulade et al. (2003) respectively. The first part of the CFH12k survey (centered on the densest part of the Taurus cloud, from 1999 to 2001), has been obtained as part of CFHT director’s discretionary time, while the remaining larger set of data has been obtained, in service mode, as part of a larger key program devoted to the study of young clusters. A detailed description of the optical photometric survey is deferred to a forthcoming publication (Guieu et al 2005 in preparation). We summarize here its main characteristics.
Data reduction, performed at CFHT using elements of the Elixir system (Magnier & Cuillandre, 2004), included bias and dark subtraction, flat-fielding, fringing correction, bad pixels removal and individual frame combination. Point source detection was performed on the combined images. For the CFH12k data, PSF fitting photometry was extracted with the PSFex routine from the SExtractor program (Bertin & Arnouts, 1996), while aperture photometry was obtained for the MEGACAM data with the same program. Photometric catalogs were combined, using the following transformation between CFH12k (,) and MEGACAM (,) photometric systems, computed from overlapping fields:
and
The total survey yielded more than sources detected down to =24 and =23. From the turn-over at the faint end of the magnitude distribution, we estimate the completeness limits of our optical photometric survey to be =21.8 and =20.9. Concerning the brightest sources in the survey, the saturation limits are and
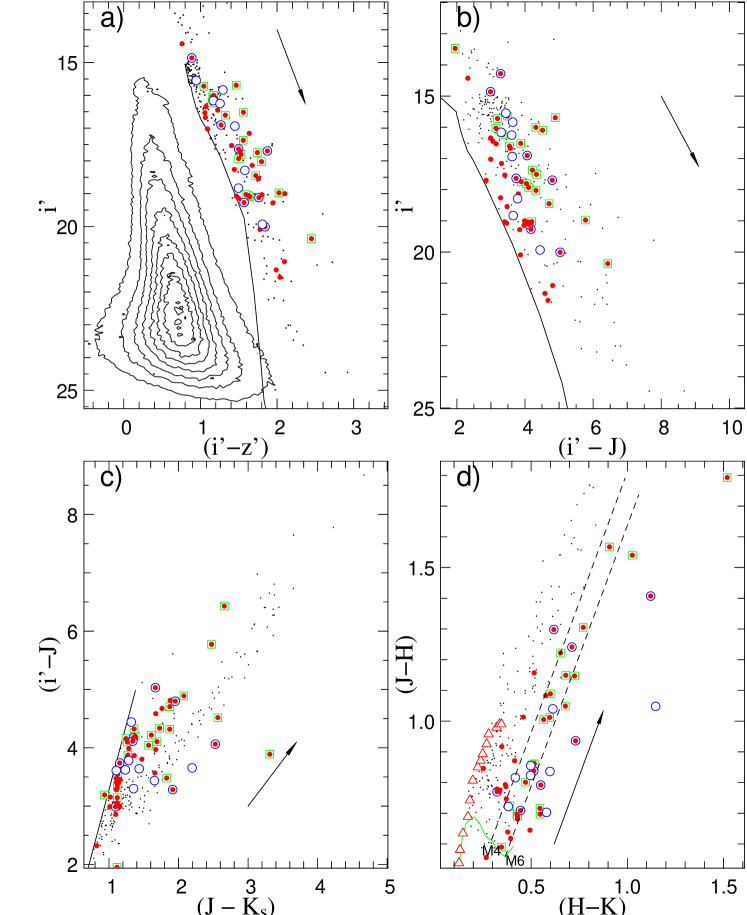
We identify Taurus low-mass candidate members with the following procedure. We first select optical sources with a detection in the near-infrared 2MASS catalogue at both J, H and K bands with quality flags A, B or C. We then evaluate a rough estimate of the reddening vector towards each source by assuming a maximum intrinsic color of 0.8, which corresponds to a spectral type M9-L0 for a main sequence dwarf (Kirkpatrick et al., 2000; Dahn et al., 2002). Reddening values estimated this way will be conservative lower estimates for earlier spectral type sources. Candidate Taurus members are then selected according to their location in the various color-magnitude and color-color diagrams plotted in Figure 1. We dereddened each candidate and required its position in the (or when available) and color-magnitude diagrams to be compatible with stars younger than 10 Myr, derived from comparison with the Chabrier et al. (2000) pre-main sequence tracks. We also require colors compatible with a dwarf M spectral type in the diagram. This selection procedure yielded 264 Taurus low-mass candidates, of which 227 have band magnitudes 20 .
Strong galactic contamination from primarily early M-type background giants is expected. In order to properly assess Taurus membership, spectroscopic follow-up of the photometrically selected candidates is therefore mandatory. We restrict ourselves to the 227 sources with band magnitudes 20, in order to allow a proper spectroscopic follow-up in the optical domain. We further use the diagram to separate early and late M candidates. This procedure also allows to minimize the background giant contamination, expected to be very strong at the early M spectral types. Among the 227 sources with band magnitudes 20, 47 sources appear later than M4V in the (see Figure 1d).
Among these 47 sources, are included 4 sources already published in Martín et al. (2001) (CFHT-Tau 1, CFHT-Tau 2, CFHT-Tau 3 and CFHT-Tau 4) and 10 previously known Taurus low-mass members (V410 Tau Anon 13, ZZ Tau IRS, J04442713+2512164, J04381486+2611399, KPNO-Tau 9, KPNO-Tau 7, KPNO-TAU 5, KPNO-Tau 3, J04284263+2714039, J04202555+2700355). We present in this paper medium resolution (R 1000) optical spectroscopic observations obtained for 27 of the remaining 33 unknown late-M () candidates including KPNO Tau 1-2-4 and 6 published in Briceño et al. (2002); Luhman et al. (2003a). Thus, combining observations presented in this work and previously published results, spectroscopic information is available for 87 % (41/47) of the Taurus candidates later then M4V identified from our CFHT survey. We also included in our spectroscopic survey 13 candidates with , which represent 7 % (13/180) of the remaining early M-type candidates with 20. A very strong galactic contamination is expected in this latter sample. We note that our spectroscopy survey is 100 % complete in the substellar domain: all the 13 sources that appear later than M6V in the diagram are included in our spectroscopic study.
In addition to the 44 (40 with ) sources selected with the procedure just described, we have also observed in the course of the different spectroscopic campaigns, 53 additional sources selected with less restrictive criteria. These include in particular sources selected from the diagram, observed at the WHT in September 2000 but not published in Martín et al. (2001). All of these additional objects, turn out to be spectroscopically confirmed as non Taurus members (see §3). They are however included in this paper and their derived properties are summarized in Table 3.
Due to our selection procedure, the mass-completeness limit of our spectroscopic sample is set both by the 2MASS completeness limits (J=15.25, H=14.4, K=13.75) and the sensitivity limit of our optical spectroscopic observations (20). Both are equally restrictive in terms of mass completeness (see §4.4).
2.2 Spectroscopy
| id | Instrument | Telescope | Dates | Wavelength | Dispersion | Number of sources |
|---|---|---|---|---|---|---|
| Å | Å/pixel | |||||
| 1 | FORS1 | VLT-UT3 | 2001-10-25 to 2002-02-20 | 6000-11000 | 2.59 | 10 |
| 2 | FORS1 | VLT-UT1 | 2002-12-11 to 2003-03-05 | 6000-11000 | 2.59 | 10 |
| 3 | LRIS | Keck I | 2003-01-08, 2003-01-09 | 6000-10000 | 1.87 | 26 |
| 4 | LRIS | Keck I | 2004-12-03, 2004-12-04 | 6000-10000 | 1.87 | 32 |
| 5 | ISIS | WHT | 2000-09-28, 2000-09-29 | 6490-9365 | 2.88 | 19 |
Spectroscopic observations have been conducted with the WHT/ISIS, FORS1/VLT (Appenzeller et al., 1998) and LRIS/Keck instruments over 5 runs between September 2000 and December 2004. The detailed journal of the spectroscopic observations is presented in Table 2.
2.2.1 WHT/ISIS observations
Spectroscopic observations were carried out using the Intermediate-dispersion Spectrograph and Imaging System (ISIS) at the 4.2 m William Herschel Telescope (WHT) in La Palma on 2000 September 2829. The R158R grating on ISIS’s red arm gave a wavelength coverage from 640.9 to 936.5 nm. The spectral resolution was 2.5 pixels (7.2 ). The data were reduced using standard routines for bias subtraction and flat-field correction within the IRAF7 environment. Wavelength calibration was made using the spectrum of an NeAr lamp. Instrumental response was calibrated out using spectra of the flux standard Feige 24. A total of 29 sources were observed during this campaign, 4 were published in Martín et al. (2001) and 6 turn out to be already known Taurus members. We publish here the remaining 19 sources.
2.2.2 VLT/FORS observations
FORS1111FOcal Reducer/low dispersion Spectrograph observations were performed in service mode between 2001 and 2003. In both cases, the grism 300I was used, providing a dispersion of 2.59 Å/pixel and a wavelength coverage of 6000 to 11000 Å. The slit width was 0.7′′. The standard ESO pipeline reduction procedure has been applied. This includes bias correction, flat-fielding and wavelength calibration. Individual spectra were extracted using the IRAF222IRAF distributed by National Optical Observatories apextract routine. The spectral response was calibrated with observations of the standard M9 field BD DENIS-P-J1048-3956 (Delfosse et al., 2001).
2.2.3 Keck/LRIS observations
Two observing runs were conducted with the LRIS/Keck I spectrograph in January 2003 and December 2004. The spectral dispersion was 1.87 Å/pixel and wavelength coverage 6000-10000 Å. The slit width was 1.0′′ for the first run and 1.5′′ for the second one, due to worse seeing conditions. Individual exposures were first bias corrected and flat-fielded. Spectra were extracted with the IRAF apextract routine, then wavelength calibrated with a reference arc lamp exposure. The spectral response is calibrated with observations of the following standards: LTT 377, Feige 110, BD+28 4211, BD+25 4655, PG 0918+029, G193-74, G191B2B, Feige 11.
3 Data analysis
3.1 Spectral-type and reddening determination
3.1.1 Numerical spectral fitting
Spectral types can be derived from spectro-photometric indices, such as the ones defined by Martín et al. (1999). However, these indices are affected by the strong extinction expected towards Taurus members. From simulations of artificially reddened standard spectra, we have computed that for a visual extinction of 5 magnitudes, spectral types estimated from the PC3 indice (Martín et al., 1999) are wrong by 2 classes for types around M7V. We therefore chose to apply a spectral fitting procedure similar to the one presented in Luhman et al. (1998), allowing to derive simultaneously spectral type and reddening. We built a library of reference dwarf and giant spectra spanning the range between M1 and L0. The dwarfs reference library was built from the combination of spectra published in Kirkpatrick et al. (1999), Martín et al. (1999) and Leggett et al. (2000), with 4 individual spectra, on average, for each M-spectral subclass. The giant reference library, built from a sample of 97 very bright M-giants, was taken from Fluks et al. (1994). Half and quarter sub-classes were constructed by combination of adjacent classes (for instance ). For a given spectral type, each candidate spectrum can be fitted either by the dwarf template, the giant template or the average of both. This procedure therefore allows for an estimate of the luminosity class.
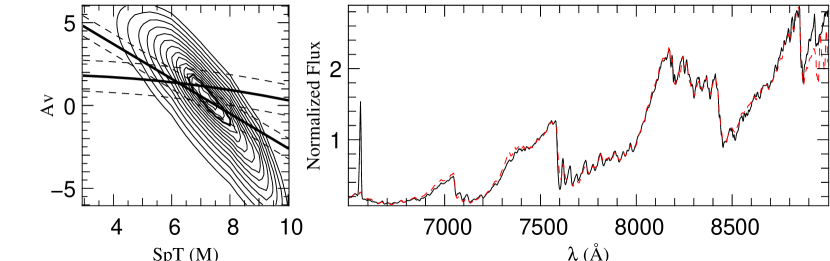
The fit is performed in the wavelength range 7000-8500 Å, where the signal to noise is maximized and the spectral response is best determined. Figure 2 shows the map in the ( - spectral type) plane for one of our Taurus candidate (2MASS J04390396+2544264) with the corresponding best fit solution. In the map, we have also added the versus spectral type relations predicted by the (I-J) and (J-H) colors. The calibration relations of broad band colors versus spectral type are derived from linear fits to the photometry of M-type dwarf standards observed by Leggett et al. (1996, 1998, 2001) and Dahn et al. (2002). In the example shown in Figure 2, the best fit solution found by our numerical fitting procedure appears compatible, within the estimated 1 uncertainties, with the solution predicted by the (I-J) and (J-H) colors. From simulations of artificially reddened standard star spectra, we estimate typical internal uncertainties for our numerical fitting procedure of half a class in spectral type and 0.8 magnitudes in . Among our initial spectroscopic sample, 33 sources are classified as giants, 38 as field dwarfs and 26 as sub-giants (ie best represented by the average of a dwarf template and giant template). These 26 sub-giants appear as our primary Taurus pre-main sequence candidates. We investigate below in more details the reliability of the parameters, in particular reddenings and luminosity classes, determined by the spectral fitting procedure.
3.1.2 Reddening estimates from color-color diagrams
 |
 |
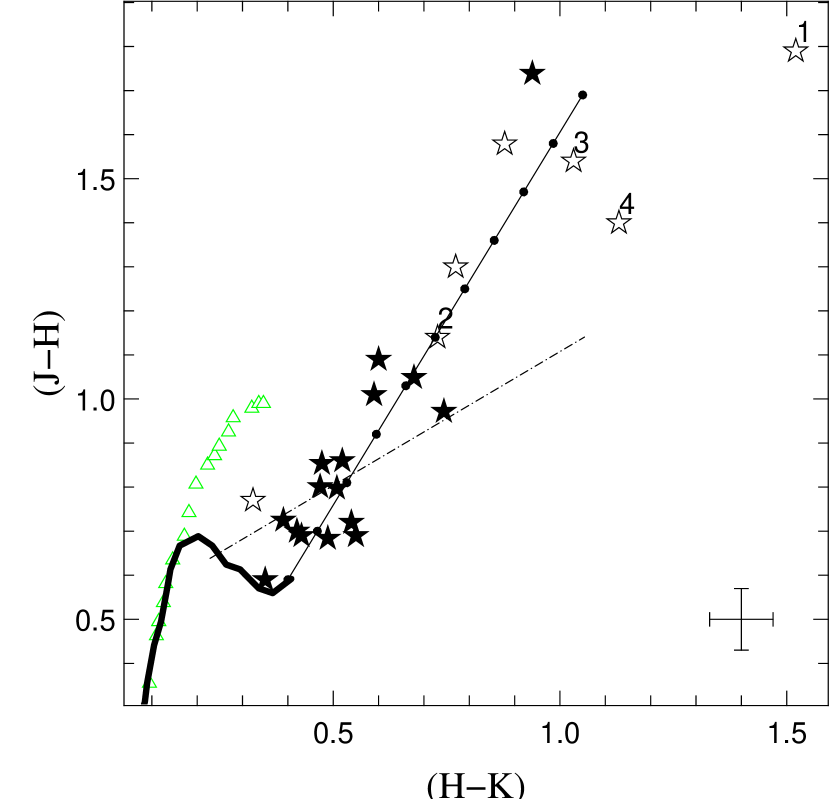
In order to assess in more details the reliability of the values derived from our numerical fitting procedure, we independently estimate extinction values from the (J-H)/(H-K) and (I-J)/(J-K) color-color diagrams. We exclude from the following analysis the 33 sources classified as giants by the spectral fitting procedure. Most of these turn out to be early type (SpT M2III) background giants. We are therefore left with a sample of 64 sources classified either as M dwarfs or sub-giants. Sources with no detectable excess infrared emission in the (J-H) versus (H-K) diagram are dereddened back to the locus of dwarfs, while those lying to the right of the reddened dwarf sequence in the near-IR color-color diagram are dereddened back to the locus of actively accreting T Tauri stars, as defined by Meyer et al. (1997). In the (I-J) versus (J-K) diagram, sources are dereddened back to the dwarf sequence.
We compare in Figure 3 (Left) values derived in these two ways. Four sources (individually labelled) show large differences in excess of 2 magnitudes. Two of these sources also show significant near-infrared excess emission in the (J-H)/(H-K) diagram (Figure 8), indicating that the determination of is likely very uncertain. Except for these 4 sources, values derived from both color-color diagrams agree remarkably well: the distribution of differences peaks at =0 with a dispersion of 0.3 magnitudes. On the other hand, we find a systematic difference between the values obtained from the spectral fitting procedure and the ones derived from the color-color diagrams (Figure 3, Right), especially for the sources classified as sub-giants: the distribution of differences peaks at =1 with a dispersion of 0.3 magnitudes. For sources classified as dwarfs the distribution of differences peaks at =0.25 with a dispersion of 0.3 magnitudes.
The discrepancy observed in determinations for the sub-giant population likely arises from an improper calibration of the intrinsic broad-band colors for sources with surface gravities intermediate between dwarfs and giants. Indeed the derivation of reddening values from main-sequence colors assumes that a young object has the same intrinsic continuum slope as a dwarf. However, Luhman (1999) noted that intrinsic colors of pre-main sequence sources are significantly redder than the ones of dwarfs at spectral types later than M5V. Indeed, the spectra of the mid to late M young stellar objects always rise more rapidly beyond 8000Å than the spectra of main-sequence dwarfs of the same spectral type. The derivation of reddening values from dwarf colors involving the I band will therefore systematically overestimate for young mid to late-M stars. Our analysis seems to indicate that this is also true for reddening values derived from near-infrared colors. The spectral fitting procedure on the other hand takes into account the fact that the surface gravity of young stars is intermediate between the ones of dwarfs and giants. Although we note that the continuum slope of a young star may not be exactly the average of a dwarf and giant continuum, we estimate that the Av values derived from the spectral fitting procedure are less biased and we adopt them in the following.
3.2 Luminosity class and Sodium equivalent widths
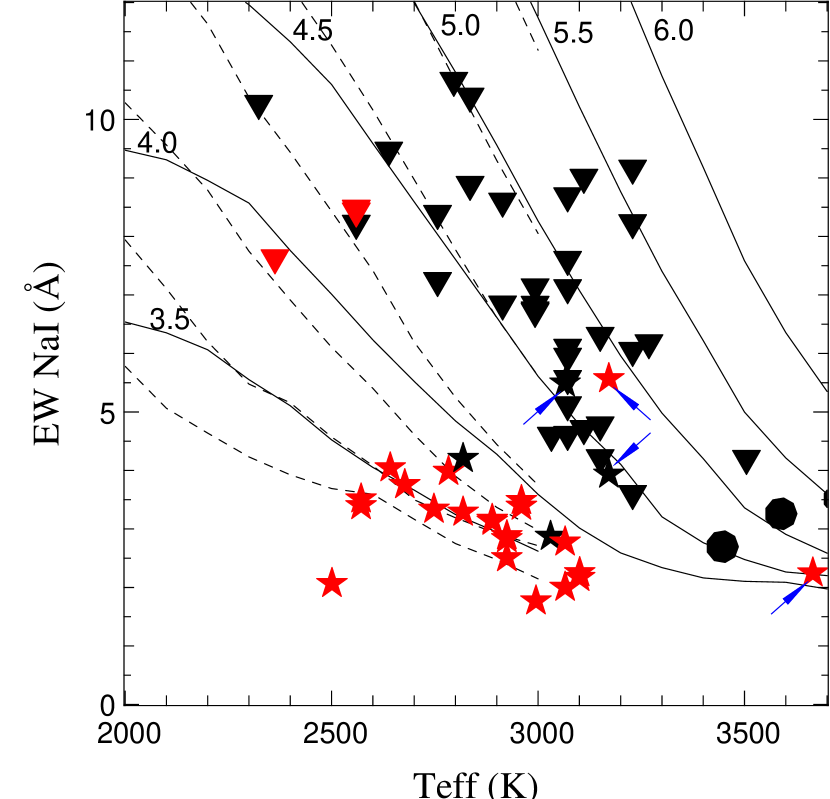
The Nai doublet at 8183 and 8195 Å is sensitive to surface gravity effects (Martín et al., 1999) for effective temperatures in the range 2500 to 3500 K. We therefore compare the luminosity class estimated for our sources from the spectral fitting procedure with Na i equivalent widths measurements. The EW(Nai) is computed between 8172 Å and 8207 Å (the doublet is not fully resolved at the moderate spectral resolution of our observations). The local continuum is estimated by a linear fit to the three highest points in each of the following spectral intervals: [8090:8172 Å] and [8207:8280 Å]. We estimate typical uncertainties on the equivalent widths to be on the order of 5 %.
Figure 4 illustrates the excellent agreement between the luminosity class estimated from our spectral fitting procedure and the Nai equivalent widths. In this figure, we plot the measured EW(Nai) versus effective temperature Teff. Spectral types, derived from the spectral fitting procedure, are converted into effective temperatures using the relationships given by Luhman (1999) for pre-main sequence stars, dwarfs and giants respectively. Eighteen sources classified as early-type ( M1) giants are not included in the graph. Figure 4 shows a clear separation between sources spectroscopically classified as field dwarfs and sources identified as sub-giants. All the sources classified as field dwarfs show EW(Nai) comparable to the predictions of the model atmospheres from Chabrier et al. (2000) with surface gravities 4. On the other hand, all but 4 of the estimated luminosity class IV sources show EW(Nai) consistent with predictions from the model atmospheres for low surface gravities ( 4). In the following, we therefore adopt the luminosity class estimated from the spectral fitting procedure and discuss the nature of these 4 discrepant low surface gravity candidates (indicated by an arrow in Figure 4). We notice that one known Taurus BD (KPNO-Tau 4) shows an unusually small Nai equivalent width (2.07 Å) for its estimated effective temperature ( 2500 K). However, the detailed profile of the Nai doublet in this source appears to differ significantly from both the model predictions and the corresponding dwarf template line profile, suggesting a core emission which could explain its low position in Figure 4.
| 2MASS Name | Run | RA(J2000) | DEC(J2000) | Av | EW(Na) | EW() | SpT | |
| Field stars | ||||||||
| J04015740+2626199 | 4 | 04:01:57.409 | 26:26:19.993 | 1.59 | 4.20 | 0.55 | 2.00 | V |
| J04130888+2805559 | 1 | 04:13:08.887 | 28:05:55.943 | 0.00 | 8.39 | 1.69 | 6.75 | V |
| J04141928+2804118 | 5 | 04:14:19.283 | 28:04:11.813 | 0.47 | 6.18 | 0.58 | 3.50 | V |
| J04141951+2757014 | 1 | 04:14:19.519 | 27:57:01.451 | 0.90 | 8.60 | -7.90 | 5.75 | V |
| J04170178+2821593 | 5 | 04:17:01.787 | 28:21:59.375 | 8.39 | 3.62 | 0.00 | 1.00 | III |
| J04173746+2811230 | 5 | 04:17:37.463 | 28:11:23.046 | 9.82 | 2.77 | 0.00 | 1.00 | III |
| J04180215+2817487 | 1 | 04:18:02.157 | 28:17:48.790 | 4.74 | 8.69 | -1.10 | 4.75 | V |
| J04180537+2828011 | 5 | 04:18:05.374 | 28:28:01.114 | 8.00 | 1.67 | 0.00 | 1.00 | III |
| J04202471+2703532 | 4 | 04:20:24.713 | 27:03:53.219 | 6.14 | 1.39 | 3.94 | 1.00 | III |
| J04245748+2402016 | 4 | 04:24:57.485 | 24:02:01.687 | 0.46 | 9.47 | -5.26 | 7.50 | V |
| J04274047+2610193 | 2 | 04:27:40.473 | 26:10:19.340 | 4.18 | 3.68 | 0.91 | 1.00 | III |
| J04274721+2602405 | 2 | 04:27:47.210 | 26:02:40.531 | 1.23 | 10.27 | -4.25 | 9.50 | V |
| J04280147+2618101 | 3 | 04:28:01.440 | 26:18:10.440 | 2.00 | 1.02 | 2.90 | 1.00 | III |
| J04281440+2622409 | 3 | 04:28:14.400 | 26:22:40.800 | 2.36 | 1.41 | 2.52 | 1.00 | III |
| J04281884+2623169 | 3 | 04:28:18.840 | 26:23:16.800 | 2.41 | 1.15 | 1.36 | 1.00 | III |
| J04282842+2608177 | 3 | 04:28:28.425 | 26:08:17.700 | 2.65 | 3.26 | 0.67 | 3.00 | III |
| J04284464+2424202 | 4 | 04:28:44.644 | 24:24:20.214 | 0.00 | 8.89 | -7.19 | 6.25 | V |
| J04290207+2558061 | 3 | 04:29:02.074 | 25:58:06.132 | 0.10 | 4.71 | -0.36 | 4.50 | V |
| J04291217+2618592 | 3 | 04:29:12.168 | 26:18:59.760 | 2.66 | 1.16 | 0.82 | 1.00 | III |
| J04294344+2436224 | 3 | 04:29:43.446 | 24:36:22.475 | 4.18 | 9.01 | 0.81 | 4.50 | V |
| J04294651+2431493 | 5 | 04:29:46.519 | 24:31:49.328 | 10.48 | 1.48 | 0.00 | 1.00 | III |
| J04294723+2529188 | 4 | 04:29:47.236 | 25:29:18.892 | 0.00 | 8.43 | -23.70 | 8.00 | V |
| J04295622+2503559 | 4 | 04:29:56.228 | 25:03:55.904 | 2.25 | 4.63 | -3.56 | 1.00 | V |
| J04300120+2548459 | 3 | 04:30:01.207 | 25:48:45.914 | 0.09 | 3.60 | 1.49 | 3.75 | V |
| J04301981+2630196 | 4 | 04:30:19.810 | 26:30:19.667 | 1.56 | 6.10 | -5.87 | 4.75 | V |
| J04304498+2551071 | 3 | 04:30:45.000 | 25:51:07.920 | 1.62 | 1.63 | 1.06 | 1.00 | III |
| J04312215+2449527 | 4 | 04:31:22.150 | 24:49:52.730 | 1.56 | 5.12 | 0.77 | 4.75 | V |
| J04312630+2544327 | 3 | 04:31:26.304 | 25:44:32.640 | 0.85 | 1.94 | 0.78 | 1.00 | III |
| J04312740+2553281 | 3 | 04:31:27.408 | 25:53:28.320 | 2.22 | 0.97 | 1.41 | 1.00 | III |
| J04312868+2417184 | 5 | 04:31:28.689 | 24:17:18.442 | 5.34 | 5.60 | 0.00 | 1.00 | III |
| J04313322+2419015 | 5 | 04:31:33.229 | 24:19:01.556 | 3.70 | 8.23 | 0.00 | 3.75 | V |
| J04313986+2436357 | 3 | 04:31:39.864 | 24:36:36.360 | 4.44 | 1.68 | 1.43 | 1.00 | III |
| J04314390+2409418 | 5 | 04:31:43.901 | 24:09:41.857 | 5.42 | 4.15 | 2.09 | 1.00 | III |
| J04315468+2436153 | 3 | 04:31:54.672 | 24:36:16.200 | 7.07 | 1.91 | 1.97 | 1.00 | III |
| J04315728+2436138 | 3 | 04:31:57.288 | 24:36:14.760 | 5.97 | 2.91 | 1.28 | 1.00 | III |
| J04315921+2423190 | 5 | 04:31:59.219 | 24:23:19.021 | 2.96 | 9.17 | 0.00 | 3.75 | V |
| J04320212+2412431 | 5 | 04:32:02.124 | 24:12:43.186 | 6.46 | 4.98 | 0.00 | 1.00 | III |
| J04321076+2420377 | 5 | 04:32:10.764 | 24:20:37.788 | 6.33 | 4.08 | 2.94 | 1.00 | III |
| J04321441+2456174 | 4 | 04:32:14.418 | 24:56:17.408 | 0.00 | 6.72 | 1.60 | 5.25 | V |
| J04322154+2411221 | 1 | 04:32:21.546 | 24:11:22.106 | 0.00 | 8.48 | -16.50 | 8.00 | V |
| J04330191+1831066 | 3 | 04:33:01.917 | 18:31:06.654 | 3.01 | 3.52 | 0.87 | 2.00 | III |
| J04330277+1824258 | 3 | 04:33:02.832 | 18:24:26.280 | 0.34 | 1.06 | 1.70 | 1.00 | III |
| J04334207+2217333 | 4 | 04:33:42.077 | 22:17:33.320 | 0.10 | 6.84 | 1.10 | 5.25 | V |
| J04334314+2647424 | 4 | 04:33:43.147 | 26:47:42.482 | 2.45 | 4.22 | -0.52 | 4.25 | V |
| J04341429+2416062 | 1 | 04:34:14.298 | 24:16:06.240 | 2.07 | 4.60 | -5.26 | 5.00 | V |
| J04343346+2253070 | 2 | 04:34:33.465 | 22:53:07.051 | 1.17 | 8.22 | -4.04 | 8.00 | V |
| J04345366+2410538 | 5 | 04:34:53.665 | 24:10:53.803 | 0.02 | 10.40 | -5.73 | 6.25 | V |
| J04350520+2250385 | 3 | 04:35:05.184 | 22:50:39.120 | 3.41 | 1.39 | 0.40 | 1.00 | III |
| J04351784+2242282 | 1 | 04:35:17.844 | 22:42:28.238 | 1.35 | 7.61 | -4.99 | 4.75 | V |
| J04351943+2238203 | 5 | 04:35:19.434 | 22:38:20.386 | 4.49 | 3.83 | 0.00 | 1.00 | III |
| J04353690+2640182 | 4 | 04:35:36.909 | 26:40:18.250 | 5.58 | 3.19 | 0.84 | 1.25 | III |
| J04353912+2240369 | 5 | 04:35:39.129 | 22:40:36.934 | 1.13 | 6.31 | -7.21 | 4.25 | V |
| J04355699+2713092 | 4 | 04:35:57.000 | 27:13:09.250 | 0.00 | 7.14 | -3.24 | 5.25 | V |
| J04362765+2239496 | 1 | 04:36:27.653 | 22:39:49.651 | 0.21 | 10.67 | -0.72 | 6.50 | V |
| J04371221+2439036 | 4 | 04:37:12.218 | 24:39:03.618 | 0.10 | 6.84 | -3.06 | 5.75 | V |
| J04381840+2455135 | 4 | 04:38:18.405 | 24:55:13.505 | 0.00 | 5.57 | -4.36 | 4.75 | V |
| J04384651+2558153 | 3 | 04:38:46.512 | 25:58:14.880 | 3.97 | 0.81 | 3.72 | 1.00 | III |
| J04392692+2552592 | 5 | 04:39:26.920 | 25:52:59.286 | 15.44 | 2.70 | 0.00 | 4.00 | III |
| J04393591+2542325 | 2 | 04:39:35.916 | 25:42:32.598 | 0.00 | 7.25 | 1.12 | 6.75 | V |
| J04395172+2549182 | 5 | 04:39:51.726 | 25:49:18.282 | 10.33 | 2.82 | 0.00 | 1.00 | III |
| J04401040+2556029 | 3 | 04:40:10.368 | 25:56:03.120 | 3.75 | 7.12 | -1.47 | 4.75 | V |
| J04402392+2554478 | 2 | 04:40:23.927 | 25:54:47.808 | 4.61 | 6.74 | -5.05 | 5.25 | V |
| J04404085+2542054 | 3 | 04:40:40.824 | 25:42:05.400 | 3.18 | 0.99 | 3.51 | 1.00 | III |
| J04411647+2507537 | 3 | 04:41:16.464 | 25:07:53.760 | 2.81 | 2.33 | 2.58 | 1.00 | III |
| J04411897+2515090 | 2 | 04:41:18.979 | 25:15:09.043 | 0.29 | 7.63 | -13.08 | 9.25 | V |
| J04413108+2519222 | 5 | 04:41:31.085 | 25:19:22.300 | 10.93 | 3.26 | 0.00 | 1.00 | III |
| J04422975+2519485 | 2 | 04:42:29.752 | 25:19:48.508 | 5.16 | 5.95 | -7.44 | 4.75 | V |
| J04425194+2414525 | 4 | 04:42:51.946 | 24:14:52.598 | 0.51 | 4.78 | 0.85 | 4.25 | V |
| J04430638+2523237 | 1 | 04:43:06.382 | 25:23:23.766 | 3.14 | 6.05 | -3.39 | 3.75 | V |
| J04430807+2522103 | 3 | 04:43:08.040 | 25:22:10.560 | 3.72 | 2.88 | 0.38 | 1.00 | III |
| J04435916+2419389 | 4 | 04:43:59.169 | 24:19:38.989 | 1.09 | 4.62 | -3.81 | 4.75 | V |
| Uncertain membership | ||||||||
| J04272297+2636474 | 4 | 04:27:22.975 | 26:36:47.498 | 2.41 | 5.49 | -6.94 | 5.50 | IV |
| J04315129+2506524 | 4 | 04:31:51.298 | 25:06:52.488 | 1.86 | 3.94 | -2.62 | 4.75 | IV |
| J04355760+2253574 | 5 | 04:35:57.608 | 22:53:57.491 | 2.55 | 5.57 | -21.58 | 4.75 | IV |
| 2MASS Name | Name | Run | RA(J2000) | DEC(J2000) | Av | EW(Na) | EW() | SpT | |
|---|---|---|---|---|---|---|---|---|---|
| J04151471+2800096 | KPNO-Tau-1 | 1 | 04:15:14.714 | 28:00:09.612 | 0.41 | 3.40 | -26.82 | 9.00 | IV |
| J04174955+2813318 | KPNO-Tau 10 | 3 | 04:17:49.554 | 28:13:31.854 | 0.00 | 2.78 | -40.09 | 5.50 | IV |
| J04185115+2814332 | KPNO-Tau-2 | 5 | 04:18:51.156 | 28:14:33.241 | 0.37 | 3.16 | -8.39 | 6.75 | IV |
| J04210795+2702204 | CFHT-Tau 19 | 4 | 04:21:07.953 | 27:02:20.418 | 7.34 | 2.17 | -442.17 | 5.25 | IV |
| J04214631+2659296 | CFHT-Tau 10 | 4 | 04:21:46.315 | 26:59:29.609 | 3.59 | 3.49 | -17.32 | 6.25 | IV |
| J04221644+2549118 | CFHT-Tau 14 | 4 | 04:22:16.440 | 25:49:11.842 | 0.57 | 3.34 | -48.77 | 7.75 | IV |
| J04221675+2654570 | CFHT-Tau 21 | 4 | 04:22:16.759 | 26:54:57.078 | 6.61 | 2.25 | -45.09 | 1.25 | IV |
| J04242646+2649503 | CFHT-Tau 9 | 4 | 04:24:26.462 | 26:49:50.362 | 0.91 | 3.39 | -9.95 | 6.25 | IV |
| J04272799+2612052 | KPNO-Tau-4 | 2 | 04:27:27.997 | 26:12:05.270 | 2.45 | 2.07 | -158.08 | 9.50 | IV |
| J04274538+2357243 | CFHT-Tau 15 | 4 | 04:27:45.380 | 23:57:24.325 | 1.30 | 3.76 | -18.90 | 8.25 | IV |
| J04292165+2701259 | CFHT-Tau 18 | 4 | 04:29:21.653 | 27:01:25.946 | 4.85 | 1.77 | -38.30 | 6.00 | IV |
| J04295950+2433078 | CFHT-Tau 20 | 4 | 04:29:59.508 | 24:33:07.852 | 3.60 | 2.00 | -114.03 | 5.50 | IV |
| J04300724+2608207 | KPNO-Tau-6 | 2 | 04:30:07.244 | 26:08:20.792 | 0.88 | 3.51 | -207.91 | 9.00 | IV |
| J04302365+2359129 | CFHT-Tau 16 | 4 | 04:30:23.655 | 23:59:12.991 | 1.51 | 4.05 | -16.76 | 8.50 | IV |
| J04305171+2441475 | ZZ Tau IRS | 4 | 04:30:51.714 | 24:41:47.512 | 2.38 | 2.25 | -141.13 | 5.25 | IV |
| J04312669+2703188 | CFHT-Tau 13 | 4 | 04:31:26.690 | 27:03:18.810 | 3.49 | 4.20 | -3.60 | 7.25 | IV |
| J04321786+2422149 | CFHT-Tau 7 | 3 | 04:32:17.862 | 24:22:14.984 | 0.00 | 2.83 | -8.63 | 6.50 | IV |
| J04325026+2422115 | CFHT-Tau 5 | 2 | 04:32:50.265 | 24:22:11.564 | 9.22 | 3.98 | -29.84 | 7.50 | IV |
| J04330945+2246487 | CFHT-Tau 12 | 4 | 04:33:09.457 | 22:46:48.702 | 3.44 | 2.51 | -79.65 | 6.50 | IV |
| J04350850+2311398 | CFHT-Tau 11 | 4 | 04:35:08.508 | 23:11:39.865 | 0.00 | 3.13 | -45.07 | 6.75 | IV |
| J04390396+2544264 | CFHT-Tau 6 | 3 | 04:39:03.960 | 25:44:26.416 | 0.41 | 3.29 | -63.74 | 7.25 | IV |
| J04400174+2556292 | CFHT-Tau 17 | 1 | 04:40:01.745 | 25:56:29.227 | 6.50 | 2.87 | -7.26 | 5.75 | IV |
| J04411078+2555116 | CFHT-Tau 8 | 3 | 04:41:10.785 | 25:55:11.651 | 1.77 | 2.89 | -52.00 | 6.50 | IV |
4 Results

4.1 Identification of Taurus members
We compile in Table 3 and 4 the reddening, spectral type and luminosity class derived from the spectral fitting for our 97 spectroscopic sources. We also list measured equivalent widths in Nai and H. We use the luminosity class as the primary criterion to identify Taurus pre-main sequence sources. 26 sources are classified as luminosity class IV through our spectral fitting procedure. Among these, only 4 show EW(Na i) indicative of larger surface gravities 4, as determined from Figure 4.
The first one, 2MASS J04221675+2654570, has an early spectral type (M1.25), and falls in the temperature regime where the sodium equivalent width is no longer sensitive to surface gravity for moderate values ( 5). In addition, this source shows significant H emission (with an equivalent width of -24.5 Å), reddening ( = 6.6) and near-infrared excess (see Fig. 8). We therefore classify it as a Taurus member.
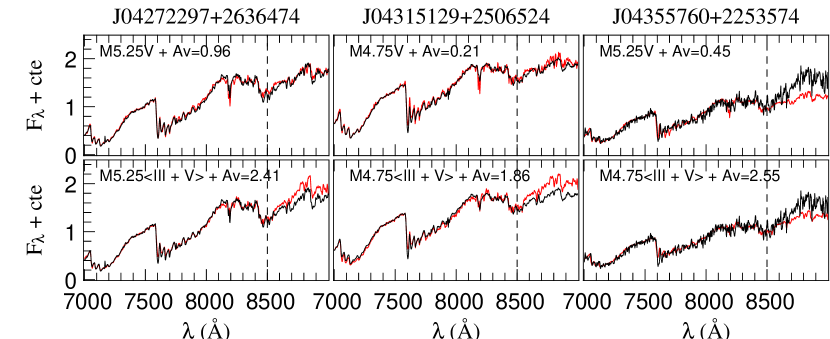
The second is 2MASS J04355760+2253574. The spectrum of this object is best fitted by the average of a M4.75 dwarf and giant with a reddening of = 2.55 and it displays emission with an equivalent width of -21.58 Å, indicating a possible pre-main sequence nature. Its near-infrared colors ((J-H)=1.01 and (H-K)= 0.56) suggest significant reddening and/or near-infrared excess emission. However, its measured EW(Nai) of 5.25 Å is more representative of field dwarf surface gravities. In addition, when placed on the HR diagram at the Taurus distance with the above derived parameters, it falls close to the 100 Myr isochrone, significantly below the Taurus population. The spectral fit obtained with a dwarf template gives a spectral type of M5.25 and of 0.45 with a of 1.17 (see Figure 4). However a foreground nature does not seem compatible with the near-infrared colors. It is therefore difficult at this stage to conclude on the nature of this source.
The remaining two sources, 2MASS J04272297+2636474 and 2MASS J04315129+2506524, have mid-M spectral types, low-level line emission (EW(H) emission 8 Å) and occupy in Figure 4 the same location as dwarfs. For these two sources, spectral types M5.5 and M4.75 and values of 2.41 and 1.86 are derived from the best fit solution obtained with the average of a dwarf and giant template. Their derived location in the HR diagram with the above parameters is shown in Figure 7. Both sources fall between the 10 and 30 Myr isochrones, at the low luminosity end of the Taurus population. However, as illustrated in Figure 6, the fits obtained with a dwarf template alone appear in both cases very close to the previous best fit solution. The differences in between the dwarf and sub-giant fits for these two sources are 0.06 and 0.35 respectively, significantly lower than the average of the differences for the remaining Taurus candidate population of 1.81.25. The dwarf fits give a similar spectral type but significantly lower reddening values compatible, within our derived 1 uncertainty of 0.8 mag, with a foreground field dwarf nature. Their near-infrared colors ((J-H)=0.35, (H-K)=0.7-0.8) and I band magnitudes appear also compatible with a foreground nature.
We therefore classify these last 3 sources in Table 3 with uncertain membership and do not consider them as Taurus members in the following. We are therefore left with 23 bonafide Taurus members. We note that all but 2 of these show strong H emission with equivalent widths in excess of 8 Å. All these 23 sources were included in our primary sample of 51 sources selected according to the criteria of § 2.1. We therefore estimate the efficiency of our selection procedure to be 45 %.
4.2 Properties of the new Taurus members
| Name | ST | Av | log10(L/Lsun) | Teff | I | I-z | J-H | H-K | K |
|---|---|---|---|---|---|---|---|---|---|
| ZZ Tau IRS | M5.25 | 2.4 | -1.4627 | 3100 | 15.95 | 0.85 | 1.40 | 1.13 | 10.31 |
| KPNO-Tau 10 | M5.50 | 0.0 | -1.3214 | 3065 | 14.11 | 0.11 | 0.77 | 0.32 | 10.78 |
| KPNO-Tau-2 | M6.75 | 0.4 | -2.1302 | 2889 | 16.56 | 0.49 | 0.68 | 0.49 | 12.75 |
| KPNO-Tau-1 | M9.00 | 0.4 | -2.6340 | 2571 | 18.15 | 0.54 | 0.85 | 0.47 | 13.77 |
| KPNO-Tau-6 | M9.00 | 0.9 | -2.5129 | 2571 | 17.90 | 0.66 | 0.80 | 0.51 | 13.69 |
| KPNO-Tau-4 | M9.50 | 2.5 | -2.3744 | 2500 | 18.75 | 0.71 | 0.97 | 0.74 | 13.28 |
| CFHT-Tau 21 | M1.25 | 6.6 | -0.4185 | 3665 | 15.17 | 0.80 | 1.54 | 1.03 | 9.01 |
| CFHT-Tau 19 | M5.25 | 7.3 | -1.1423 | 3100 | 16.54 | 1.15 | 1.79 | 1.52 | 10.54 |
| CFHT-Tau 20 | M5.50 | 3.6 | -0.8586 | 3065 | 15.10 | 0.79 | 1.14 | 0.73 | 9.81 |
| CFHT-Tau 17 | M5.75 | 6.5 | -1.1652 | 3030 | 17.62 | 0.82 | 1.58 | 0.88 | 10.76 |
| CFHT-Tau 18 | M6.00 | 4.9 | -0.3715 | 2994 | 14.63 | 0.97 | 1.30 | 0.77 | 8.73 |
| CFHT-Tau 10 | M6.25 | 3.6 | -1.6792 | 2959 | 16.85 | 0.99 | 1.09 | 0.60 | 12.13 |
| CFHT-Tau 9 | M6.25 | 0.9 | -1.6218 | 2959 | 15.35 | 0.77 | 0.69 | 0.43 | 11.76 |
| CFHT-Tau 7 | M6.50 | 0.0 | -1.2149 | 2924 | 14.12 | … | 0.73 | 0.39 | 10.40 |
| CFHT-Tau 8 | M6.50 | 1.8 | -1.6940 | 2924 | 16.43 | … | 1.05 | 0.68 | 11.45 |
| CFHT-Tau 12 | M6.50 | 3.4 | -1.4401 | 2924 | 16.26 | 1.03 | 1.01 | 0.59 | 11.55 |
| CFHT-Tau 11 | M6.75 | 0.0 | -1.5964 | 2889 | 14.88 | 0.71 | 0.59 | 0.35 | 11.59 |
| CFHT-Tau 13 | M7.25 | 3.5 | -2.1012 | 2818 | 17.90 | 1.05 | 0.86 | 0.52 | 13.45 |
| CFHT-Tau 6 | M7.25 | 0.4 | -1.6223 | 2818 | 15.40 | 0.53 | 0.80 | 0.47 | 11.37 |
| CFHT-Tau 5 | M7.50 | 9.2 | -1.1258 | 2783 | 18.79 | 1.09 | 1.74 | 0.94 | 11.28 |
| CFHT-Tau 14 | M7.75 | 0.6 | -1.7494 | 2747 | 15.62 | 0.88 | 0.70 | 0.42 | 11.94 |
| CFHT-Tau 15 | M8.25 | 1.3 | -2.4380 | 2677 | 17.94 | 1.08 | 0.69 | 0.55 | 13.69 |
| CFHT-Tau 16 | M8.50 | 1.5 | -2.4152 | 2642 | 17.91 | 1.07 | 0.72 | 0.54 | 13.70 |
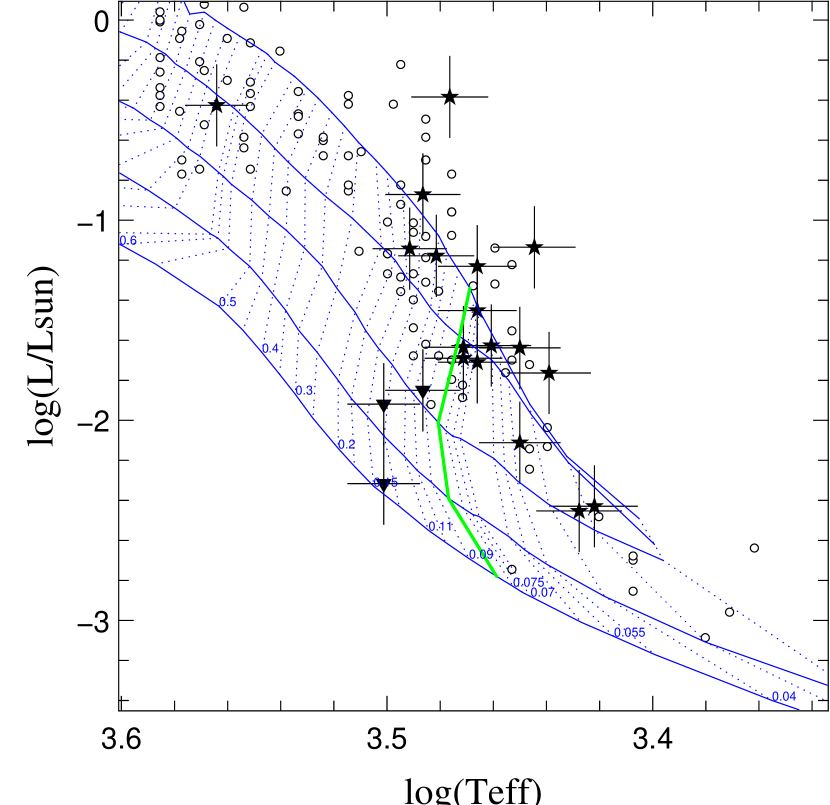
We summarize in Table 5 the derived properties of the Taurus members. We list the spectral types and reddening values derived through our spectral fitting procedure. The effective temperature is estimated from the spectral type using the following linear fit to the relationship derived by Luhman (1999) for young M dwarfs: . We compute the luminosity from the dereddened I band magnitude, using the bolometric corrections for M dwarfs from Luhman (1999). We also list our and band photometry combined with the J, H and K 2MASS photometry. We show in Figure 7 the derived HR diagram for our new Taurus sources, including previously known members. We use the 0.08 M⊙ mass track from the Chabrier et al. (2000) pre-main sequence models to define the stellar/substellar boundary, which falls at spectral type M6.25V for a typical Taurus age of 3 Myr. We will therefore use in the following this spectral type as the limiting boundary for brown dwarfs in our sample. We note in the substellar domain a general trend of the models to predict larger ages for the lowest mass objects. This tendency is likely due to uncertainties in the pre-main sequence tracks and/or bolometric corrections for the lowest masses.
We recover in our sample 6 previously known Taurus members, and we find 12 new BDs and 5 new very low mass (VLM) stars. We show in Figure 5 the individual spectra of the 17 new Taurus members. We also show ZZ Tau IRS, for which, to our knowledge, no low-resolution optical spectrum is published in the literature. Four of the new BDs were previously published in conference proceedings by Monin et al. (2004) and Guieu et al. (2004). Two of these, CFHT-Tau 6 (J04390396+2544264) and CFHT-Tau 8 (J04411078+2555116), have independently been discovered by Luhman (2004). This author found the same spectral type for CFHT-Tau 6 (M7.25) and a close extinction value (=0.26). For CFHT-Tau 8 we derive an M6.5 spectral type with a moderate reddening (=1.8) while Luhman (2004) found an M5.5 spectral type with AJ=0.7 (=2.6). We note that the discrepancy in values is similar to our estimated reddening uncertainty (0.8 mag) while the difference of 1 spectral class is twice our estimated spectral typing error.
Among the remaining Taurus members, our estimates of spectral type and reddening values appear generally compatible, within the quoted uncertainties, with values given in the literature, except for 2 sources for which larger discrepancies are found: ZZ Tau IRS and KPNO Tau 4. ZZ Tau IRS, the suspected energy source of HH 393 (Gomez et al., 1997), has been recently observed spectroscopically by White & Hillenbrand (2004). These authors derive from their high-resolution optical spectroscopic observations an M4.52 spectral type, compatible within the quoted uncertainties with our own derivation of M5.25. However, using the (J-H) color, they estimate a reddening value of 7.6, significantly larger than our own estimate of = 2.4, derived from the spectral fitting procedure. We note that this source displays a significant excess in the (J-H)/(H-K) diagram as well as strong accretion signatures, which may significantly affect the derivation of reddening from near-infrared photometry. Indeed, if we deredden ZZ Tau IRS back to the locus of accreting T Tauri stars in the diagram, we find , a value compatible with our derivation from fitting of the optical low resolution spectrum. We note however that these values may be a lower limit to the true reddening if indeed this source is viewed edge-on as suggested by its unusually large emission lines equivalent widths, as already noted by White & Hillenbrand (2004). We come back to this issue in the following section. In the case of KPNO Tau 4, we find the same spectral type (M9.5) but a reddening value larger than the one computed by Briceño et al. (2002) (= 2.5 vs 0.0). This discrepancy likely arises from the rapid increase of the continuum flux longwards of Å for spectral types later than M9V. This part of the continuum therefore strongly influences the derivation of reddening values at late spectral types. Uncertainties on its exact shape result in large uncertainties on derived . We therefore estimate that for our later spectral types (), uncertainties on derived values are almost doubled and likely increase to 1.6 mag.
4.3 Accretion and outflow signatures

We examine the Taurus VLM members identified in this work for evidence of accretion/outflow. These signatures include strong near-infrared excess, suggestive of an active accretion disk; strong emission in the optical forbidden lines which, in Classical T Tauri stars, trace outflow signatures strongly correlated with the accretion process (Hartigan et al., 1994; Cabrit et al., 1990); strong emission beyond the limit for chromospheric activity. A large fraction of the newly identified Taurus VLM members show indications of one or more of these accretion/outflow signatures.
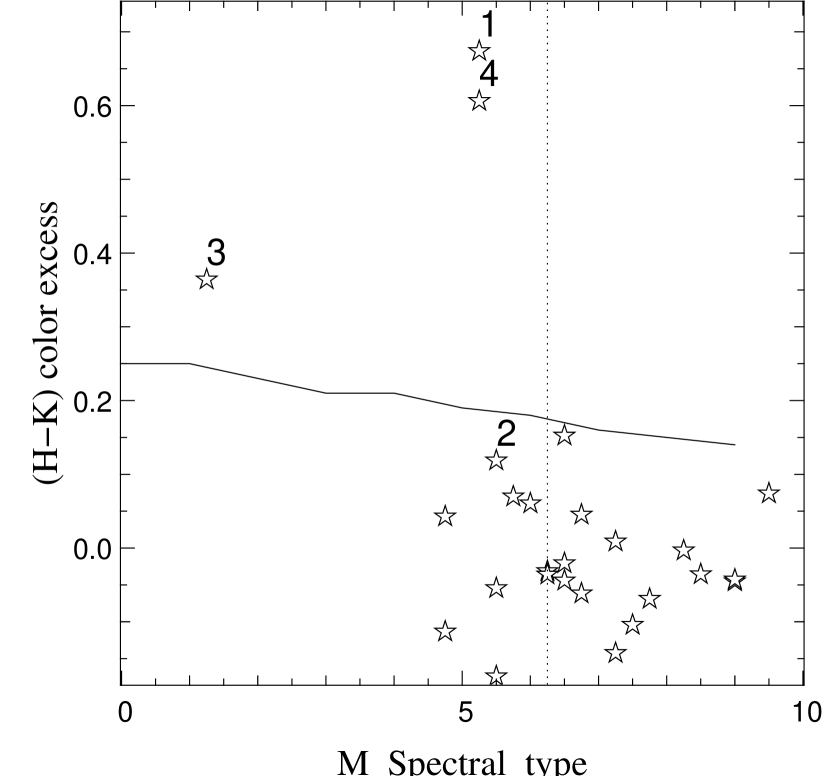
Three of the VLM Taurus members (CFHT-Tau 19, ZZ Tau IRS, CFHT-Tau 21 ) and one of the BDs (KPNO-Tau 4) exhibit near-infrared excess in the (J-H) versus (H-K) diagram (Figure 8). These sources lie in this diagram to the right of the reddening vector extending from the M7 dwarf color and above the locus of accreting T Tauri stars, suggesting near-infrared excess emission arising from the presence of an accretion disk. Using our estimates of reddening and spectral type, we further compute a (H-K) excess for each confirmed Taurus member. This near-infrared excess is represented in Figure 10 as a function of spectral type and compared to the maximum (H-K) color excesses predicted for a flat reprocessing circumstellar disk around a central star of spectral type ranging from M0 V to M9 V (Liu et al., 2003). The three VLM members previously identified in the (J-H)/(H-K) diagram show a clear (H-K) color excess above what is expected from a pure reprocessing disk. Given the one uncertainty of 0.1 mag in (H-K), we do not find evidence from this diagram for strong active accretion in the substellar population. However, the lack of detectable (H-K) excess does not imply an absence of disk around these sources. Indeed, detailed modelling of the spectral energy distributions from reprocessing disks around young substellar objects by Natta & Testi (2001) showed that excess disk emission becomes clearly detectable longward of 3 m only.
The three sources with strong near-IR excess also display strong emission in the optical forbidden lines of [O i] 6300, 6363 Å, [N ii] 6548, 6583 Å, and [S ii] 6716, 6731 Å (Figure 9), which, in higher mass CTTs, trace outflow signatures strongly correlated with the accretion process (Hartigan et al., 1994; Cabrit et al., 1990). One of these sources, ZZ Tau IRS, shows anomalously large equivalent widths in the optical forbidden lines (EW([O i] 6300 Å) = -190 Å, EW([S ii] 6731+6716 Å) = -77 Å). Typical equivalent widths in T Tauri stars are on the order of a few tenths of Å. Such large values in ZZ Tau IRS could be explained if the source is seen close to edge-on and the continuum is therefore suppressed relative to the line emission, arising from extended jet emission. The suggestion that ZZ Tau IRS is close to edge-on has already been made by White & Hillenbrand (2004) on the same argument. One VLM object , CFHT-Tau 20 (J04295950+2433078) has significant Ca ii line emission, an indicator of accretion activity (Muzerolle et al., 1998). Indeed, Mohanty et al. (2005) demonstrated recently that the Caii 8662 Å line flux correlates very well with the disk mass accretion rate down to the substellar regime.
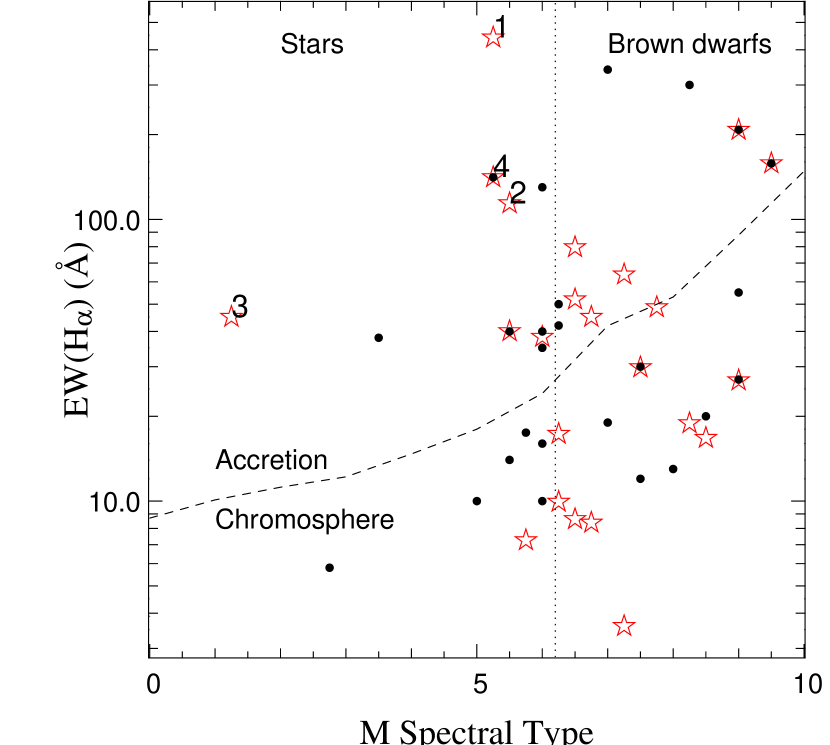
As noted before, all but 2 of the Taurus members identified in this study display strong emission with equivalent widths in excess of 8 Å. This level of emission is usually taken in higher mass T Tauri stars (TTs) as a strong accretion indicator. Chrosmospheric emission activity is however expected to increase strongly towards late M types. Barrado y Navascués & Martín (2003) conducted an extensive study of emission in a sample of young M stars. They derived an empirical CTTs/WTTs boundary, extended to substellar analogs, in the equivalent width versus spectral type diagram. This boundary is defined by the saturation limit for chromospheric activity at , determined from study of a sample of young open clusters. We plot in Figure 11 the distribution of late-type Taurus members with respect to this boundary. We include members from this study and previously known late-type sources with published equivalent widths measurements from Luhman (2000); Martín et al. (2001); Briceño et al. (2002); Luhman et al. (2003a). Figure 11 suggests that 6 Taurus brown dwarfs among our sample ( CFHT-Tau 6, CFHT-Tau 11, CFHT-Tau 12, CFHT-Tau 8, KPNO-Tau-4 and KPNO-Tau-6) have level of emission in excess of chromospheric activity and are likely CTTs substellar analogs. All but one (CFHT-Tau 17) of the VLM members from this study lie above the CTTS/WTTs boundary. In particular, the 4 VLM sources with strong emission lines (labelled 1 to 4), discussed in the previous paragraph, clearly stand out in this diagram as strongly accreting sources. We note that high-resolution spectroscopic observations that fully resolve the profiles are required to confirm that accretion is indeed present in these sources.
The near-infrared excess emission and line emission properties of the Taurus VLM members analyzed here are strikingly similar to the accretion/ejection signatures observed in the higher mass CTTs, indicating that the same processes are occurring down to the substellar limit. The apparent large fraction of accreting sources in our VLM sample is probably a result of our selection procedure since our sample of objects with spectral types earlier than M4 V is biased towards large near-IR excess sources. The fraction of accreting brown dwarfs, as deduced from the properties of their emission, is approximatively 40% (6/15) in our sample and 42 % (10/24) when we include previously known substellar members. We note that the substellar sample studied here does not suffer from the same bias as the higher mass objects and represents 72 % of all currently known BDs in Taurus. This derived substellar accretor fraction in Taurus is statistically consistent with the one derived by Mohanty et al. (2005) for sources with spectral type M5 from a detailed analysis of accretion signatures of 32 % 10 %. The fraction of accreting sources among the substellar population is similar to the one in the higher mass T Tauri stars, suggesting that inner disk lifetimes around young Taurus BDs appear on the same order or larger than around higher mass TTs.
4.4 The stellar to brown dwarf ratio revisited
Following Briceño et al. (2002); Luhman et al. (2003a); Luhman (2004), we quantify the relative numbers of brown dwarfs and stars in Taurus. The completeness in mass of our spectroscopic survey is set on one hand by the completeness limits of the 2MASS observations (J=15.25, H=14.4, K=13.75), which have been combined with the optical data to select substellar Taurus candidates, on the other hand by the band limit of 20 of our spectroscopic observations. Using the pre-main sequence tracks from Chabrier et al. (2000) (DUSTY models), we compute in both cases a corresponding mass limit of and reddening limit of for a maximum age of 10 Myr at the Taurus distance (140 pc).
We derive below the reddening and mass limited sample of all known Taurus members and update the current estimate of the brown dwarf to star ratio by including the new fields studied in this paper.
Compiling the list of known Taurus members from Kenyon & Hartmann (1995); Briceño et al. (1998, 1999, 2002); Luhman et al. (1998); Luhman (2000); Luhman et al. (2003a); Luhman (2004); White & Hillenbrand (2004); Strom & Strom (1994); Martín et al. (2000, 2001); Wichmann et al. (2000) and including the 17 new members from this work, we have identified 64 Taurus members (including known companions) projected towards our new fields but not included in the combined surveys of Briceño et al. (1998); Luhman (2000); Briceño et al. (2002); Luhman (2004). Following Briceño et al. (2002), binary systems with separations are considered as individual objects. We are therefore left with 54 sources. White & Hillenbrand (2004) recently provided estimates of spectral types and reddenings from high-resolution optical spectroscopy for a sample of embedded young stars in Taurus. We adopt their derived effective temperatures, luminosities and values for Haro 6-5B and 5 embedded IRAS sources included in our sample (IRAS 04016+2610, IRAS 04260+2642, IRAS 04264+2433, IRAS 04278+2253A, IRAS 04303+2240). We are left with 11 embedded IRAS sources for which we currently lack accurate estimates of spectral types and reddenings. White & Hillenbrand (2004) derive, for the embedded Class I sources in Taurus for which they have accurate spectral types, an average visual extinction of 10.5 magnitudes with a standard deviation of 4.2 magnitudes. The 11 IRAS sources are therefore also likely to be very embedded and not to contribute significantly in numbers to our reddening limited sample. As a consistency check, we derive for these sources a rough estimate of from the (J-H)/(H-K) diagram following the method described in §3.1.2. Among the 11 IRAS sources, only one source ends up with . We further exclude FT Tau, a strong continuum source (Herbig & Bell, 1988), and IRAS 04016+2610 and ZZ Tau IRS for which White & Hillenbrand (2004) present strong indications that these are edge-on systems. Among the remaining 40 sources, 31 sources have and are therefore included in the reddening limited sample, 9 of these are BDs.
J04202555+2700355, J04213459+2701388, J04284263+2714039 and J0442713+2512164, sources discovered by Luhman (2004), are not included in the substellar/stellar ratio computed by this author because they correspond to an initial and incomplete 225 deg2 survey. However, since they are also present in our fields, they are included into our present estimate of the substellar to stellar ratio. In addition, the new Taurus members, CFHT-Tau 17, CFHT-Tau 5, CFHT-Tau 7 and CFHT-Tau 11 discovered in this study, fall inside the fields of Luhman (2000); Briceño et al. (2002); Luhman (2004) but are not reported by these authors. CFHT-Tau 17 and CFHT-Tau 5 are embedded ( and ) but CFHT-Tau 7 and CFHT-Tau 11 have little reddening and are therefore included in our ratio. We estimate a spectral type of M6.5 for CFHT-Tau 8 different from Luhman (2004) (M5.5), so this source falls in our sample under the hydrogen burning limit. We note that CFHT-Tau 7 lies at a projected distance of only 20′′ from V928 Tau A/B and could be a wide companion to this binary system.
We combine the additional reddening limited sample derived from this
study with the one defined by Luhman (2004) and compute an
updated substellar to stellar ratio in Taurus. We first use the same
mass completeness limit of 20 as previous studies for
comparative purposes:
Using a mass completeness limit of 30 instead results in .
As already mentioned in Luhman (2004), the derived ratio in Taurus is likely an upper limit for possible remaining incompleteness at low stellar masses. Indeed, the distribution of spectral types in Taurus shows an apparent deficit at spectral types M2 to M4 (Luhman et al., 2003b). Searches for substellar objects in Taurus are, as this study, typically complete for spectral types later than M4, while previous optical and X-ray large-scale surveys of the Taurus cloud are likely complete down to M2. The increase of Rss with increasing spatial coverage in Taurus could be due to a larger incompleteness at these early to mid-M spectral types in the distributed population than in the more studied high stellar density regions. However, we show in the next section that this is likely not the case: the distributed population does not show an apparent larger deficit of M2-M4 stars (with respect to the earlier spectral type population). Moreover, the incompleteness at spectral types M2-M4 in Taurus has a limited effect on the computed Rss ratio: increasing by a factor 2 the known number of stars in this spectral range would bring the Rss ratio down to 0.20 +/- 0.05, compatible within one sigma with our new estimate.
Our new estimate of the Taurus substellar to stellar ratio of 0.23 +/- 0.05 is higher than the value derived by Luhman (2004) of 0.18 +/- 0.04, although still compatible at the 1 sigma level. It is now however comparable to the Trapezium value of estimated by Briceño et al. (2002), using the same evolutionary models and treating binary systems in the same manner. Recent estimates seem to suggest an even lower value for the Trapezium. Slesnick et al. (2004) have recently computed a substellar mass function for the Orion nebula cluster with a sample of spectroscopically confirmed members. These authors, using a different pre-main sequence model (D’Antona & Mazzitelli, 1997), found a ratio of =0.20, lower than the previous estimates derived from photometric studies alone (Luhman, 2000; Hillenbrand & Carpenter, 2000; Muench et al., 2002).
4.5 The spatial distribution of BDs
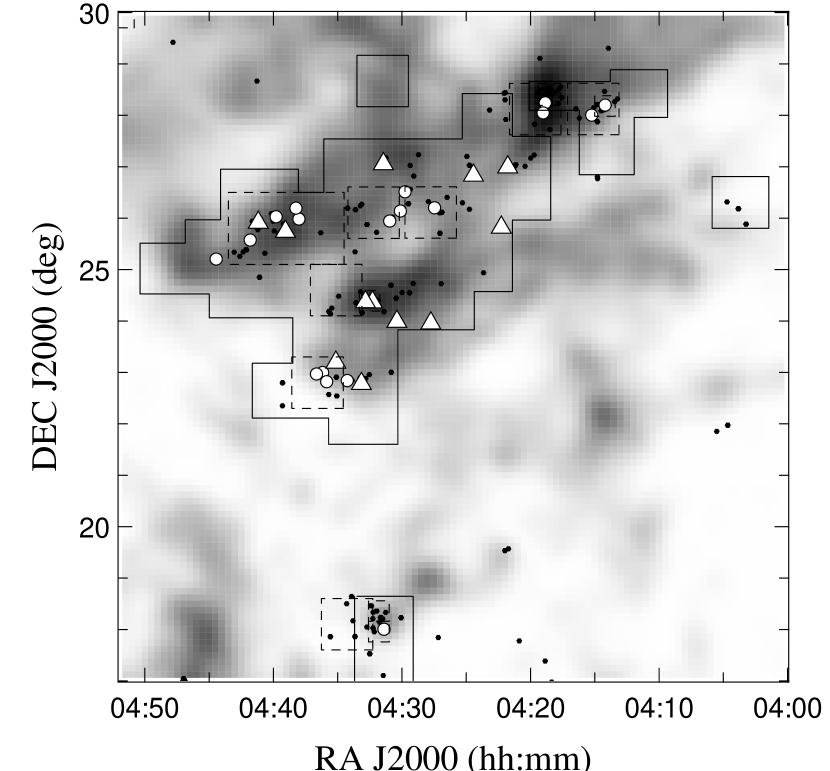
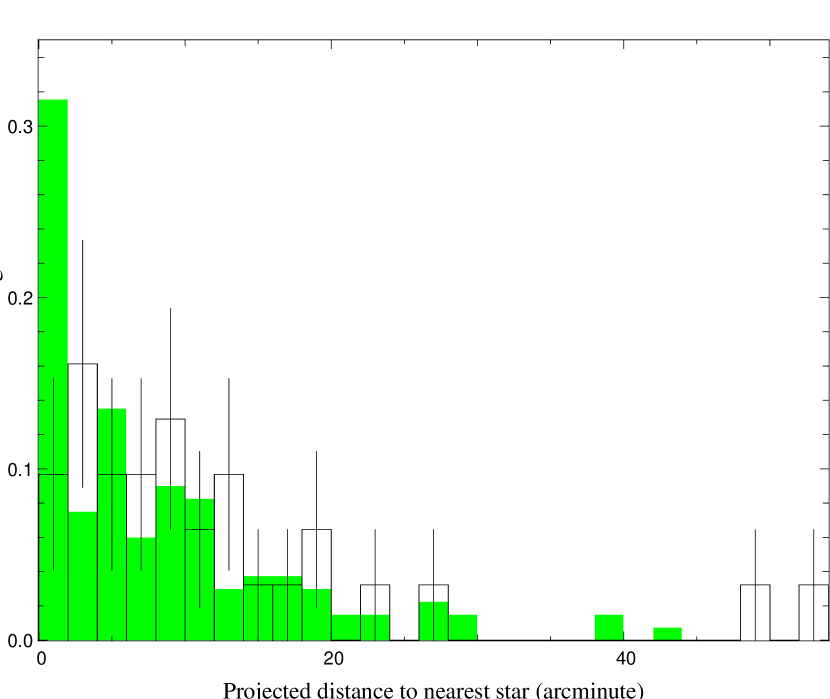
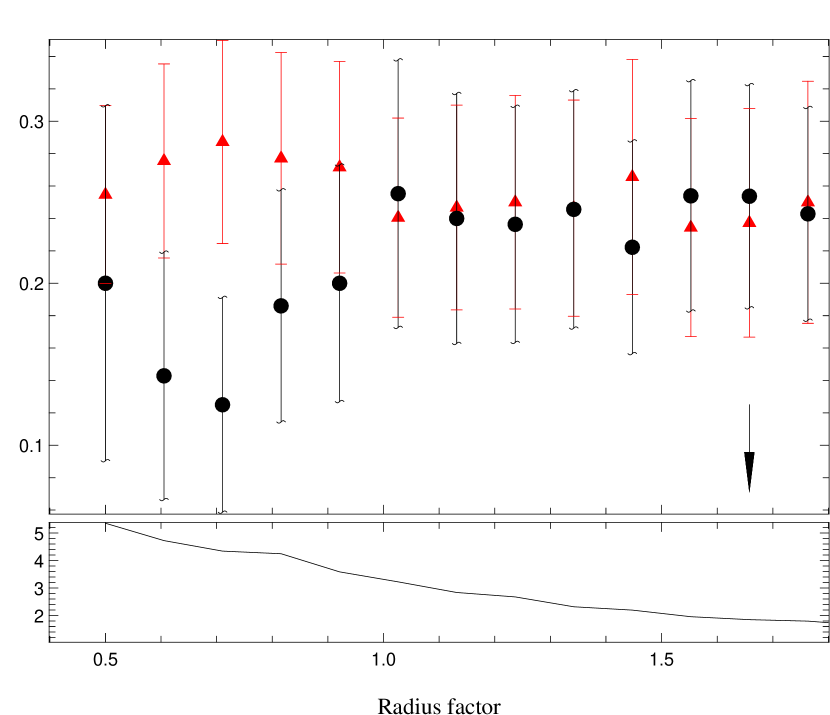
Figure 12 shows the spatial distribution of the currently identified stellar and substellar members in Taurus, including all the new sources identified in this work. Figure 12 suggests that the Taurus substellar members closely follow the distribution of stars. In order to quantify this effect, we compute the distribution of the nearest stellar neighbor, both for the stellar sample (defined as members with spectral types earlier than M6.25V) and the substellar sample. In this calculation, we consider only sources projected towards fields searched for substellar members and all binary systems with separation less than 10′′ (ie including virtually all known binary systems in Taurus) as a single stellar source. This results in 184 stellar systems and 33 substellar members. The histogram of nearest stellar neighbor distances is shown in Figure 13 for both populations. The two distributions appear statistically consistent. The median of the distribution for the stellar sample is: 4.82′ with a standard deviation of 8.45′, while for the substellar sample we find a median of 5.72′ (standard deviation 10.48′). Considering only the sources with does not significantly change the result.
However, the fact that the substellar to stellar ratio () has been steadily increasing as the area covered in Taurus became larger suggests a dependency of this ratio on the stellar density. To quantify this effect, we divide the Taurus population in two components: aggregates and distributed population. To define the former population, we use the center of the aggregates from Gomez et al. (1993) and a fixed factor of the physical radii Rc determined for each aggregate by these authors, which range from 0.5 to 1.1 pc. We plot in Figure 14 the variation of the substellar to stellar ratio in both populations as the surface comprising the aggregates is increased. In the computation of the ratio we consider only sources with and binary systems with separations 2′′ are treated as a single source. Figure 14 clearly shows a marked increase of the ratio as the integration radii defining the aggregates are increased. For integration radii 0.7Rc, the ratio is a factor 2.3 lower in the aggregates than in the remaining distributed population. At integration radii Rc both values converge towards the average value of 0.24 determined earlier. Figure 14 illustrates how increases from 0.13 (Briceño et al., 2002) towards the higher stellar density aggregates, to 0.24 (this work) as larger and lower stellar surface density areas are being surveyed. Figure 14 suggests a BD deficit (of a factor 2) in the central regions of the Taurus aggregates, on spatial scales 0.35 to 0.7 pc, where stellar densities are the highest.
As mentioned above, this apparent increase of could be due to a larger incompleteness in spectral types M2V to M4V in the distributed population than in the more studied aggregates. To test this hypothesis, we have computed the evolution of the ratio . We find that this ratio is lower in the cores of the aggregates than in the distributed population and increases as the average stellar density decreases. We conclude that there is no strong reason to believe that the incompleteness increases away from the aggregates and that the observed increase of the ratio with decreasing average stellar density in Taurus is real.
5 Discussion: implications for substellar formation
Two main classes of models have been proposed for the formation of substellar objects. In the standard formation scenario brown dwarfs form like stars, through (turbulent) gravitational collapse and fragmentation of cores, followed by subsequent disk accretion. In the ejection models, brown dwarfs are stellar embryos ejected from their parent core either early in their evolution from dynamically unstable multiple protostellar systems (Reipurth & Clarke, 2001) or through secular dynamical decay in dense embedded clusters (Sterzik & Durisen, 2003; Kroupa & Bouvier, 2003a). Thus deprived of a significant mass reservoir, these ejected embryos end up as very low mass objects. We discuss below the implications of our observational results on the substellar population of the Taurus cloud for these two main classes of models.
The fact that the abundance of BDs (down to 30 MJ) relative to stars is found to be the same ( 25 %) in the diffuse Taurus cloud and the high-density ONC cluster seems to suggest that there is no strong dependency of the substellar IMF on initial molecular cloud conditions, in particular gas density and level of turbulence. This result seems to be in contrast with the most recent simulations of supersonic turbulent fragmentation by Padoan & Nordlund (2004); Delgado-Donate et al. (2004), with sonic rms Mach numbers in the range 3 to 20, which predict a strong dependency of the abundance of BDs with the initial cloud velocity dispersion and gas density. In the subsonic case, Goodwin et al. (2004b) show that 20 % of the objects formed are brown dwarfs almost independently of the level of turbulence. It is unlikely however that a subsonic model would apply to the ONC precursor where supersonic turbulent motions were likely present. It should be noted that turbulent fragmentation models predict a decrease of the average mass formed with an increasing level of turbulence, which could account for the difference in peaks in the high mass end of the mass distributions of the Taurus and ONC populations.
Although we do not find statistical evidence for a spatial segregation between stars and brown dwarfs in Taurus, we do find strong indication that the abundance of BDs relative to stars in the centers of the Taurus aggregates, on scales 0.5 pc, is lowered by a factor 2 with respect to the more distributed population. An opposite trend would be expected in fragmentation models where the Jeans mass decreases with increasing gas density, leading to a corresponding increase in the abundance of BDs. This result seems to be best explained if a fraction of the distributed population in Taurus is formed of low-mass stars and substellar objects ejected from the aggregates, either through dynamical encounters in a dense cluster (the collision model) or through rapid dynamical decay in unstable small N-body systems (the embryo-ejected model).
Kroupa & Bouvier (2003a) study the secular dynamical evolution of Taurus-Auriga type aggregates. They show that expansion occurs on timescales of a few Myr, corresponding to a few crossing times, due to two body encounters and gas removal. However, at the median age of the Taurus population ( 3 Myr) the BD population does not separate significantly from the stellar population in these simulations. Long timescales are required, , for a significant gradient in the relative number of BDs to develop within a central 1pc sphere. Thus, secular dynamical evolution seems to require too long timescales to account for the present spatial distributions of stars and BDs in Taurus. Kroupa & Bouvier (2003b) have also investigated the case where BD ejections originate from dynamically unstable small N-systems (the embryo-ejection hypothesis). The decay of small N groups occurs on time scale of a few 104 yr, ie the production of most BDs occur well before the end of gas removal, and the resulting escape velocities are larger than in the previous scenario. The authors find that the number of BDs per star seen in the Taurus survey of Briceño et al. (2002), taking into account BDs that escaped detection from their fields, and the central region of the ONC cluster are best explained if in both cases the embryo ejection model dominates and produces the same abundance of ejected BD per star of 25 % with a dispersion velocity 2 km s-1. The authors predict than in Taurus-Auriga, on scales 1 pc from the center of the aggregates, there should be about twice as many unbound BDs than BDs bound to the aggregates. This scenario appears in good agreement with our observational results.
Recent numerical simulations also seem to support this scenario. Goodwin et al. (2004a) follow the fragmentation of a distribution of 5 cores with turbulence properties similar to the Taurus cores. The resulting mass function is bimodal. Roughly 50 % of the sources, predominantly the low-mass ones, are ejected from the cores through rapid dynamical evolution before they could accrete significantly, and form a flat low-mass distribution component. A high-mass log-normal component results from objects which remain bound in the core and grow by accretion. The ejected population comprises twice as many low-mass stars as substellar objects. Ejection velocities are 1-2 km s-1 almost independent of mass, leading to the same spatial distribution of BDs and low-mass stars. As mentioned before, in these simulations the abundance of BDs relative to stars is on the order of 20 %, independent of the exact level of turbulence, and in close agreement with the Taurus observations.
The line emission and infrared excess emission properties of the very low mass population in Taurus indicate that accretion/ejection processes similar to the ones observed in the higher mass T Tauri stars proceed down to the substellar regime and that the inner disk lifetimes is similar in brown dwarfs and stars. These results have been taken by different authors as indication that brown dwarfs form through the same processes as stars and as an argument against ejection models. However, the survival of the inner disk in young brown dwarfs may not be incompatible with the ejection model. Indeed with the typical inferred accretion rates of - , and with a typical disk mass of 1 % of the central stellar mass, survival times for an accretion disk truncated at Rout = 10 AU around a 50 MJ BD are a few Myr (Liu et al., 2003), ie on the same order as the age of the Taurus population. Viscous evolutionary time-scales appear to be on the same oder. Indeed, (e.g. Armitage & Clarke (1997)) scales as where is the central stellar mass. Viscous time-scales for disks of Rout = 10 AU around brown dwarfs of 50 MJ are on the order of yr (for values of 10-3 at r=10 AU). Thus accretion signatures may well last for a few Myr around brown dwarfs, even if small disks, with outer radii on the order of 10 AU, surround them, as expected if they have been ejected early in their evolution from their birth site (Bate et al., 2002).
In summary, the embryo-ejection model reproduces both qualitatively and quantitatively the spatial distribution of stars and BDs in Taurus as well as the evolution of the ratio and does not appear incompatible with the accretion properties of the Taurus substellar population.
6 Summary and conclusions
We have presented in this work results from a spectroscopic follow-up study of 79 very low mass Taurus candidates, selected from a large scale optical (I,z′) survey covering a total area of 30 square degrees. Our spectroscopic survey is 90 % complete for photometric candidates later than spectral type M4V, 100 % complete for substellar candidates (spectral types later than M6.25V). Our corresponding mass completeness limit is 30 MJ for ages 10 Myr and . We derive reddening values, spectral types and luminosity classes from a spectral fitting procedure and Na i equivalent widths measurements. We identify 17 new Taurus members among which 12 are brown dwarfs. We investigate their accretion properties, spatial distribution and abundance relative to stars. The main results are the following:
-
1.
A large fraction of the newly identified Taurus members show indication of accretion/outflow signatures. Two of the new VLM members (CFHT-Tau 19 and CFHT-Tau 21) display near-infrared excess emission and optical forbidden lines indicative of accretion/ejection processes similar to the ones observed in the higher mass classical T Tauri stars. In addition, 4 of the new substellar members (CFHT-Tau 6, CFHT-Tau 8, CFHT-Tau 11 and CFHT-Tau 12) exhibit emission in excess of chromospheric levels and are likely CTTs substellar analogs. From levels of emission, we estimate a fraction of accreting sources of 42 % in the Taurus substellar population, similar to what is observed in the higher mass T Tauri stars.
-
2.
We derive a new estimate of the substellar to stellar ratio in Taurus of , 1.3 times higher than the last estimate from Luhman (2004) derived from spatially less extended studies. This value now appears fully consistent with the value derived with similar assumptions for the Trapezium cluster population of by Briceño et al. (2002) and suggests an average production rate of one BD per 4 stars in both regions.
-
3.
We find a strong indication that the abundance of BDs relative to stars in the centers of the Taurus aggregates, on scales 0.5 pc, is lowered by a factor 2 with respect to the more distributed population.
The similarity of the abundance of BDs with respect to stars in both the Taurus and ONC populations seem to favor ejection models for the origin of the substellar population. The similar spatial distributions of the Taurus stellar and substellar populations but the detectable gradient in the BD abundance relative to stars at a characteristic age of 3 Myr favor BD ejection through dynamical decay of unstable small N systems (the embryo-ejection model). Further tests are however required to confirm this hypothesis, in particular multiplicity studies of the distributed population. In addition, our analysis relies solely on the relative abundance of BDs with respect to stars. Detailed and complete studies of the shape of both the substellar and stellar IMFs in star-forming regions of different environments are clearly required.
Acknowledgements.
We thank Estelle Moraux and Jérôme Bouvier for enlightening discussions about the origin of substellar objects as well as the ESO and Keck observatory staff for their help during the observations. This research has made use of the 2MASS and CDS database. This work is based upon research supported by the National Science Foundation under grant AST 02-05862. Any opinions, findings, and conclusions or recommendations expressed in this material are those of the authors and do not necessarily reflect the views of the National Science Foundation. The authors wish to extend special thanks to those of Hawaiian ancestry on whose sacred mountain of Mauna Kea we are privileged to be guests. Without their generous hospitality, the Keck I telescope observations presented therein would not have been possible.References
- Appenzeller et al. (1998) Appenzeller, I., Fricke, K., Furtig, W., et al. 1998, The Messenger, 94, 1
- Armitage & Clarke (1997) Armitage, P. J. & Clarke, C. J. 1997, MNRAS, 285, 540
- Barrado y Navascués & Martín (2003) Barrado y Navascués, D. & Martín, E. L. 2003, AJ, 126, 2997
- Bate et al. (2002) Bate, M. R., Bonnell, I. A., & Bromm, V. 2002, MNRAS, 332, L65
- Bertin & Arnouts (1996) Bertin, E. & Arnouts, S. 1996, A&AS, 117, 393
- Boulade et al. (2003) Boulade, O., Charlot, X., Abbon, P., et al. 2003, in Instrument Design and Performance for Optical/Infrared Ground-based Telescopes. Edited by Iye, Masanori; Moorwood, Alan F. M. Proceedings of the SPIE, Volume 4841, pp. 72-81 (2003)., 72–81
- Briceño et al. (1999) Briceño, C., Calvet, N., Kenyon, S., & Hartmann, L. 1999, AJ, 118, 1354
- Briceño et al. (1998) Briceño, C., Hartmann, L., Stauffer, J., & Martín, E. 1998, AJ, 115, 2074
- Briceño et al. (2002) Briceño, C., Luhman, K. L., Hartmann, L., Stauffer, J. R., & Kirkpatrick, J. D. 2002, ApJ, 580, 317
- Cabrit et al. (1990) Cabrit, S., Edwards, S., Strom, S. E., & Strom, K. M. 1990, ApJ, 354, 687
- Chabrier et al. (2000) Chabrier, G., Baraffe, I., Allard, F., & Hauschildt, P. 2000, ApJ, 542, 464
- Cuillandre et al. (2000) Cuillandre, J., Luppino, G. A., Starr, B. M., & Isani, S. 2000, in Proc. SPIE Vol. 4008, p. 1010-1021, Optical and IR Telescope Instrumentation and Detectors, Masanori Iye; Alan F. Moorwood; Eds., 1010–1021
- Dahn et al. (2002) Dahn, C. C., Harris, H. C., Vrba, F. J., et al. 2002, AJ, 124, 1170
- D’Antona & Mazzitelli (1997) D’Antona, F. & Mazzitelli, I. 1997, Memorie della Societa Astronomica Italiana, 68, 807
- Delfosse et al. (2001) Delfosse, X., Forveille, T., Martín, E. L., et al. 2001, A&A, 366, L13
- Delgado-Donate et al. (2004) Delgado-Donate, E. J., Clarke, C. J., & Bate, M. R. 2004, MNRAS, 347, 759
- Fluks et al. (1994) Fluks, M. A., Plez, B., The, P. S., et al. 1994, A&AS, 105, 311
- Gomez et al. (1993) Gomez, M., Hartmann, L., Kenyon, S. J., & Hewett, R. 1993, AJ, 105, 1927
- Gomez et al. (1997) Gomez, M., Whitney, B. A., & Kenyon, S. J. 1997, AJ, 114, 1138
- Goodwin et al. (2004a) Goodwin, S. P., Whitworth, A. P., & Ward-Thompson, D. 2004a, A&A, 419, 543
- Goodwin et al. (2004b) Goodwin, S. P., Whitworth, A. P., & Ward-Thompson, D. 2004b, A&A, 423, 169
- Guieu et al. (2004) Guieu, S., Monin, J. L., & Dougados, C. 2004, in SF2A-2004: Semaine de l’Astrophysique Francaise
- Hartigan et al. (1994) Hartigan, P., Morse, J. A., & Raymond, J. 1994, ApJ, 436, 125
- Herbig & Bell (1988) Herbig, G. H. & Bell, K. R. 1988, Catalog of emission line stars of the orion population : 3 : 1988 (Lick Observatory Bulletin, Santa Cruz: Lick Observatory, —c1988)
- Hillenbrand & Carpenter (2000) Hillenbrand, L. A. & Carpenter, J. M. 2000, ApJ, 540, 236
- Kenyon & Hartmann (1995) Kenyon, S. J. & Hartmann, L. 1995, ApJS, 101, 117
- Kirkpatrick et al. (1999) Kirkpatrick, J. D., Reid, I. N., Liebert, J., et al. 1999, ApJ, 519, 802
- Kirkpatrick et al. (2000) Kirkpatrick, J. D., Reid, I. N., Liebert, J., et al. 2000, AJ, 120, 447
- Kroupa & Bouvier (2003a) Kroupa, P. & Bouvier, J. 2003a, MNRAS, 346, 369
- Kroupa & Bouvier (2003b) Kroupa, P. & Bouvier, J. 2003b, MNRAS, 346, 343
- Leggett et al. (1996) Leggett, S. K., Allard, F., Berriman, G., Dahn, C. C., & Hauschildt, P. H. 1996, ApJS, 104, 117
- Leggett et al. (2000) Leggett, S. K., Allard, F., Dahn, C., et al. 2000, ApJ, 535, 965
- Leggett et al. (2001) Leggett, S. K., Allard, F., Geballe, T. R., Hauschildt, P. H., & Schweitzer, A. 2001, ApJ, 548, 908
- Leggett et al. (1998) Leggett, S. K., Allard, F., & Hauschildt, P. H. 1998, ApJ, 509, 836
- Liu et al. (2003) Liu, M. C., Najita, J., & Tokunaga, A. T. 2003, ApJ, 585, 372
- Luhman (1999) Luhman, K. L. 1999, ApJ, 525, 466
- Luhman (2000) Luhman, K. L. 2000, ApJ, 544, 1044
- Luhman (2004) Luhman, K. L. 2004, ApJ, 617, 1216
- Luhman et al. (2003a) Luhman, K. L., Briceño, C., Stauffer, J. R., et al. 2003a, ApJ, 590, 348
- Luhman et al. (1998) Luhman, K. L., Rieke, G. H., Lada, C. J., & Lada, E. A. 1998, ApJ, 508, 347
- Luhman et al. (2003b) Luhman, K. L., Stauffer, J. R., Muench, A. A., et al. 2003b, ApJ, 593, 1093
- Magnier & Cuillandre (2004) Magnier, E. A. & Cuillandre, J.-C. 2004, PASP, 116, 449
- Martín et al. (2000) Martín, E. L., Brandner, W., Bouvier, J., et al. 2000, ApJ, 543, 299
- Martín et al. (1999) Martín, E. L., Delfosse, X., Basri, G., et al. 1999, AJ, 118, 2466
- Martín et al. (2001) Martín, E. L., Dougados, C., Magnier, E., et al. 2001, ApJ, 561, L195
- Meyer et al. (1997) Meyer, M. R., Calvet, N., & Hillenbrand, L. A. 1997, AJ, 114, 288
- Mohanty et al. (2005) Mohanty, S., Jayawardhana, R., & Basri, G. 2005, Memorie della Societa Astronomica Italiana, 76, 303
- Monin et al. (2004) Monin, J. L., Guieu, S., & Dougados, C. 2004, in The Initial Mass Function 50 Years Later, eds. E. Corbelli, F. Palla & H. Hinnecker (ASSL, Springer)
- Muench et al. (2002) Muench, A. A., Lada, E. A., Lada, C. J., & Alves, J. 2002, ApJ, 573, 366
- Muzerolle et al. (1998) Muzerolle, J., Hartmann, L., & Calvet, N. 1998, AJ, 116, 2965
- Natta & Testi (2001) Natta, A. & Testi, L. 2001, A&A, 376, L22
- Padoan & Nordlund (2004) Padoan, P. & Nordlund, Å. 2004, ApJ, 617, 559
- Reipurth & Clarke (2001) Reipurth, B. & Clarke, C. 2001, AJ, 122, 432
- Rieke & Lebofsky (1985) Rieke, G. H. & Lebofsky, M. J. 1985, ApJ, 288, 618
- Slesnick et al. (2004) Slesnick, C. L., Hillenbrand, L. A., & Carpenter, J. M. 2004, ApJ, 610, 1045
- Sterzik & Durisen (2003) Sterzik, M. F. & Durisen, R. H. 2003, A&A, 400, 1031
- Strom & Strom (1994) Strom, K. M. & Strom, S. E. 1994, ApJ, 424, 237
- Ungerechts & Thaddeus (1987) Ungerechts, H. & Thaddeus, P. 1987, ApJS, 63, 645
- White & Hillenbrand (2004) White, R. J. & Hillenbrand, L. A. 2004, ApJ, 616, 998
- Wichmann et al. (2000) Wichmann, R., Torres, G., Melo, C. H. F., et al. 2000, A&A, 359, 181