The Secular Evolution of Disk Structural Parameters
Abstract
We present a comprehensive series of simulations to study the secular evolution of disk galaxies expected in a LCDM universe. Our simulations are organized in a hierarchy of increasing complexity, ranging from rigid-halo collisionless simulations to fully live simulations with gas and star formation.
Our goal is to examine which structural properties of disk galaxies may result from secular evolution rather than from hierarchical assembly. In the vertical direction, we find that various mechanisms lead to heating, the strongest of which is the buckling instability of a bar, which leads to peanut-shaped bulges; these can be recognized face-on even in the presence of gas. We find that bars are robust structures that survive buckling and require a large ( of the total mass of the disk) central mass concentration to be destroyed. This can occur in dissipative simulations, where bars induce strong gas inflows, but requires that radiative cooling overcome heating. We show how angular momentum redistribution leads to increasing central densities and disk scale lengths and to profile breaks at large radii. The breaks in these simulations are in excellent agreement with observations, even when the evolution is collisionless. Disk scale-lengths increase even when the total disk angular momentum is conserved; thus mapping halo angular momenta to scale-lengths is non-trivial. A decomposition of the resulting profile into a bulgedisk gives structural parameters in reasonable agreement with observations although kinematics betray their bar nature.
These findings have important implications for galaxy formation models, which have so far ignored or introduced in a very simplified way the effects of non-axisymmetric instabilities on the morphological evolution of disk galaxies.
Subject headings:
galaxies: bulges – galaxies: evolution – galaxies: formation – galaxies: kinematics and dynamics – galaxies: photometry – galaxies: spiral1. Introduction
In the current paradigm, galaxy formation is hierarchical (e.g. White & Rees 1978; Steinmetz & Navarro 2002). Indeed, evidence can be found of continued accretion onto both the Milky Way (Ibata et al. 1994; Helmi et al. 1999) and M31 (Ferguson et al. 2002). Although the standard framework of disk formation in such cosmogonies was formulated some time ago (White & Rees 1978; Fall & Efstathiou 1980), disk galaxy formation remains a challenging problem for both simulations (e.g. Navarro & Steinmetz 2000; Abadi et al. 2003) and semi-analytical models (e.g. Somerville & Primack 1999; Hatton et al. 2003; van den Bosch 1998, 2000, 2001, 2002; Firmani & Avila-Reese 2000; Mo et al. 1998; Dalcanton et al. 1997; Benson et al. 2003; Cole et al. 1994, 2000; Baugh et al. 1996; Kauffmann et al. 1993). The latest generation of simulations produces disks having roughly the correct sizes and structural properties (Governato et al. 2004; Abadi et al. 2003; Sommer-Larsen et al. 2003). This is due partly to the increased resolution that reduces the artificial loss of angular momentum of the baryonic component. At the same time, it has been realized that only halos with a quiet merging history after can host disk galaxies today (but see Springel & Hernquist 2005). Therefore in the current picture most of the mass of the disk is assembled from the smooth accretion of gas cooling inside the dark halo (combined with the accretion along cold filaments for lower mass objects; Katz & Gunn 1991; Katz et al. 2003; Birnboim & Dekel 2003; Kereš et al. 2005) following an intense phase of merger activity that can give rise to the stellar halo and a massive old bulge.
During disk assembly, secular evolution must have played a role in shaping the structure of disk galaxies as we see them at . Non-axisymmetric instabilities, particularly bars, drive a substantial redistribution of mass and angular momentum in the disk. A possible product of bar-driven evolution is the formation of a bulge-like component. Such a component will have a stellar population similar to that of the disk and is thus younger than the old spheroid formed by the last major merger. Low-mass bulges may result from such a mechanism; observed low-mass bulges have disk-like, almost-exponential stellar density (Andredakis & Sanders 1994; Courteau et al. 1996; de Jong 1996; Carollo et al. 2002; Carollo et al. 2001; Carollo 1999; Carollo et al. 1998; Carollo et al. 1997; MacArthur et al. 2003) and in some cases disk-like, cold kinematics (Kormendy 1993; Kormendy et al. 2002). Comparison between bulge and disk parameters shows a correlation between the scale-lengths of bulges and disks (de Jong 1996; MacArthur et al. 2003) and, on average, similar colors in bulges and inner disks (Terndrup et al. 1994; Peletier & Balcells 1996; Courteau et al. 1996; Carollo et al. 2001). The disk-like properties of bulges and the links between bulge and disk properties have been suggested to indicate that bulges may form through the evolution of disk dynamical instabilities such as bars, which are present in about of disk galaxies (Knapen 1999; Eskridge et al. 2000). Further evidence for secular evolution comes from edge-on galaxies, where bulges are often found to be box- or peanut-shaped (Lütticke et al. 2000), a shape associated with evolution driven by the presence of a bar (Combes & Sanders 1981; Pfenniger 1984; Combes et al. 1990; Pfenniger & Friedli 1991; Raha et al. 1991; Kuijken & Merrifield 1995; Bureau & Freeman 1999; Bureau & Athanassoula 1999; Athanassoula & Bureau 1999).
Secular evolution must also be considered for comparisons of predictions based on semi-analytic models of disk formation and observations to be meaningful. In the standard picture baryons cooling in dark halos to form a disk have the same specific angular momentum of the dark matter, and this is conserved during collapse. Then the distribution of disk scale-lengths can be computed from the known distribution of halo angular momenta (e.g. Dalcanton et al. 1997; Mo et al. 1998; van den Bosch 1998). However, de Jong & Lacey (2000) found that the width of the observed disk scale-length distribution at fixed luminosity is smaller than that predicted by such simple models. This suggests that the mapping between initial halo angular momenta and disk scale-lengths cannot be so trivial. In addition to complications from the cosmological side, including that the initial specific angular momentum distribution of the baryons need not be like that of the dark halo (e.g. van den Bosch et al. 2002) and angular momentum distributions favoring disks more centrally concentrated than exponential (Firmani & Avila-Reese 2000; van den Bosch 2001; Bullock et al. 2001), secular evolution will also change disk structure. In the simplest prescriptions this is not considered, while it is known since Hohl (1971) that bars can drive substantial evolution of disk profiles.
Which structural properties of present-day disk galaxies are primordial and which are the result of internal evolution? Already by a population of disk galaxies with scale-lengths similar to those of a local population is observed (Lilly et al. 1998), suggesting that the structural properties of disk galaxies have not changed substantially since then. If the quiescent phase of disk assembly starts early, as current cosmological simulations suggest, secular evolution might have already been operating by . Verification that the secular evolutionary timescale can be sufficiently short is thus required. With the present algorithms and computing power, simulations of individual isolated galaxies are best able to achieve sufficient force and mass resolution to address such issues. Simulations of individual galaxies decoupled from the hierarchical growth have the additional advantage of exploring directly the role that internal secular evolution plays in shaping the currently observed galaxy population.
In this paper we report on a series of such simulations exploring how disks evolve in the presence of a bar. An important goal of this paper is to demonstrate the wealth of structural properties possible in cosmologically-motivated disk galaxies and to identify what properties of the mass distribution of disk galaxies may result from internal evolution, rather than arising directly from hierarchical assembly. We identify several structural properties we would like to test secular evolution for: vertical thickening, inner profile steepening, profile breaks, and bar destruction. We explore simulations in which the full disk-halo interaction is self-consistent in cosmologically-motivated dark matter halos with and without gas and star formation. We use various prescriptions for gas physics, to understand how this impacts the evolution. We also use rigid-halo simulations as in Debattista et al. (2004; hereafter Paper I) which allow us to study a variety of phenomena at high spatial and mass resolution. These simulations also help us to isolate physical mechanisms by which secular evolution occurs. Together these simulations allow us to assess the impact of secular evolution on disk galaxies.
2. Methods
2.1. Live-halo models
| Run | Gas physics | ||||||
|---|---|---|---|---|---|---|---|
| NC1 | 4.92 | 3.55 | 0.7 | 0.05 | 0.0 | - | - |
| NC2 | 4.92 | 3.55 | 1.0 | 0.05 | 0.0 | - | - |
| NC3 | 4.92 | 3.55 | 1.7 | 0.05 | 0.0 | - | - |
| NG1 | 5.45 | 3.44 | 1.7 | 0.05 | 0.1 | 4 | RC |
| NG2 | 5.45 | 3.44 | 1.7 | 0.05 | 0.1 | 4 | A |
| NG3 | 5.45 | 3.44 | 1.7 | 0.05 | 0.1 | 4 | RC + SF |
| NG4 | 10.9 | 2.35 | 1.7 | 0.11 | 0.5 | 0.4 | A |
| NG5 | 5.45 | 3.44 | 1.7 | 0.05 | 0.5 | 0.8 | RC |
, , , are the disk mass, initial disk scale-length, and the minimum Toomre- parameter of, respectively, the stellar and the gaseous disk. is the fraction of disk (stars+gas) to dark matter mass and is the fraction of the baryonic mass which is in the gaseous state in the initial conditions, while “Gas physics” lists the physics of the gas used: ’RC’ refers to ’radiative cooling’, ’A’ refers to ’adiabatic’ and ’SF’ refers to ’star formation’.
Live-halo models are built using the technique developed by Hernquist (1993; see also Springel & White 1999). The structural properties of halos and disks are tied together by the scaling relations expected in the currently favored structure formation model, CDM. We start by choosing the value of the circular velocity of the halo at the virial radius, , which, for an assumed cosmology (hereafter , , ), automatically determines the virial mass, , and virial radius, , of the halo (Mo, Mao & White 1998). Halos are isotropic and have angular momentum that is specified by the spin parameter, , where and are, respectively, the total angular momentum and total energy of the halo and is the gravitational constant. We use throughout, close to the mean value measured in cosmological simulations (e.g. Gardner 2001). The halo density profile is an NFW (Navarro, Frenk & White 1996) with a given value of the concentration , where , being the halo scale radius. The higher the concentration, the higher the halo density near the center at a given value of (and therefore the more steeply rising is its inner rotation curve). Adiabatic contraction of the halo due to the presence of the disk is taken into account by assuming that the spherical symmetry of the halo is retained and that the angular momentum of individual dark matter orbits is conserved (see Springel & White 1999). The disk mass fraction relative to the halo virial mass, is , consistent with estimates for galaxies in the local Universe (e.g. Jimenez, Verde & Oh, 2003) and is conservatively lower than the estimate of the universal baryonic mass fraction yielded by WMAP (Spergel et al. 2003). Our models implicitly assume that the disk forms out of collapsed gas that started with the same specific angular momentum as the halo and that such angular momentum was conserved during infall (Mo, Mao & White 1998). The disk has an exponential surface density profile with scale length that is determined by the value of (which sets the degree of available centrifugal support) and by the values of , , and (which together set the depth of the potential well). The setup of the stellar disk is complete once the Toomre parameter, , is assigned (Toomre 1964). This corresponds to fixing the local radial velocity dispersion , since , where is the local epicyclic frequency, is the gravitational constant, and is the disk surface density. The velocity field of the disk is calculated as in Springel & White (1999; see also Hernquist 1993); in particular, the radial and vertical velocity dispersions are assumed to be equal, and the azimuthal velocity dispersion is determined from the radial dispersion using the epicyclic approximation. Dark matter halos are sampled using particles and stellar disks by particles. The gravitational softening of both components is equal to pc. We reran a few simulations with higher resolution ( halo particles and disk particles) and smaller softenings ( pc; see Paper I) to check for resolution effects. We found the analysis presented in this paper to be fairly insensitive to the resolution adopted, and in the remainder we always show results for runs with the standard resolution. The live-halo models used in this paper have structural parameters in line with the expectations of CDM models for a Milky-Way sized system. These models are similar to the mass models of the Milky Way presented by Klypin, Zhao & Somerville (2002). The rotation curve of the collisionless models used in the paper is shown in Figure 1. All collisionless models have the same rotation curve since they differ only in terms of their Toomre parameter. These simulations were carried out with the parallel multistepping tree code PKDGRAV (Stadel 2001).
2.2. SPH simulations
Gasdynamical simulations were carried out with GASOLINE, an extension of PKDGRAV (Stadel 2001) that uses smoothed particle hydrodynamics (SPH) to solve the hydrodynamical equations (Wadsley, Stadel & Quinn 2004). The gas is ideal with equation of state , where is the pressure, is the density, is the specific thermal energy, and is the ratio of the specific heats (adiabatic index). We are assuming that the gaseous disk represents the partially ionized hydrogen component of the galaxy. In its general form the code solves an internal energy equation that includes an artificial viscosity term to model irreversible heating from shocks. The code adopts the standard Monaghan artificial viscosity and the Balsara criterion to reduce unwanted shear viscosity (Balsara 1995). In the adiabatic runs the thermal energy can rise as a result of compressional and shock heating and can drop because of expansion. In runs including radiative cooling energy can be released also through radiation. We use a standard cooling function for a primordial gas composition (helium and atomic hydrogen).
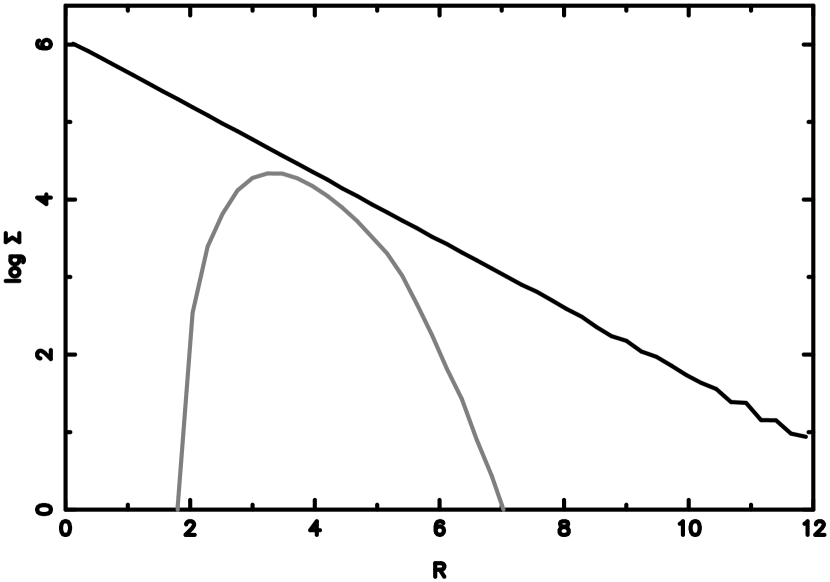
Dissipational galaxy models are built following the same prescription described in Section 2.1 for live-halo models but include also a gaseous disk represented by SPH particles each with a gravitational softening of pc. The basic properties of the runs performed are shown in Table 1. The disk mass fraction is in all runs except run NG4, which has . The gaseous disk has a temperature of K, consistent with the gas velocity dispersions derived in observations (Martin & Kennicutt 2001). The gaseous disk has an exponential surface density profile with the same scale-length as the stellar disk (see Mayer & Wadsley 2004), and its thickness is determined by local hydrostatic equilibrium. In a gaseous disk the Toomre parameter is defined as , where is the sound speed and is the surface density of the gas. The global stability of the disk will be determined by the combined stability properties of the stellar and gaseous disks (Jog & Solomon 1991). Gravitational instabilities can be more vigorous in a cold gaseous disk and might affect the development of non-axisymmetry even in the stellar disk (Rafikov 2001). In particular, in models having gas, the gaseous disks have over most of the radial extent of the galaxy, which should make the system unstable to non-axisymmetric perturbations irrespective of the stellar (see Rafikov 2001 for the case in which the sound speed is of the radial stellar velocity dispersion as in our models). In the models with gas instead, the gaseous disk has a high , making them stable to axisymmetric perturbations although they still can be unstable to non-axisymmetric perturbations since for the stars (Binney & Tremaine 1987). The profiles of gas and stars are shown in Figure 2.
Finally, we also include star formation. The star formation algorithm follows that of Katz (1992), where stars form from cold, Jeans-unstable gas particles in regions of convergent flows (see also Governato et al. 2004; Stinson et al. 2006). The star formation efficiency parameter , but with the adopted scheme its value has only a minor effect on the star formation rate (Katz 1992). No supernova feedback is included in our simulations. The rotation curve of the models with gas can be seen in Figure 3.
2.3. Rigid-halo models
These simulations consist of a live disk inside a rigid halo, which permit large numbers of particles and thus allow high spatial resolution to be reached. High resolution is particularly useful for studying the vertical evolution of disks. Rigid-halo simulations are better suited to systems in which the disk is dominant in the inner regions because the interaction with the halo is intrinsically weaker (Debattista & Sellwood 2000).
The rigid halos were represented by either a logarithmic potential with a core
| (1) |
or a cuspy Hernquist model
| (2) |
The initially axisymmetric disks were all Sérsic (1968) type,
| (3) |
with scale-length , mass , and Gaussian thickness , truncated at a radius and a Sérsic index . Disk kinematic setup used the epicyclic approximation to give constant Toomre- and the vertical Jeans equation to set vertical motions appropriate for a constant thickness. The disks were represented by equal-mass particles. In units where , which gives a unit of time , the values for the diskhalo parameters such that our rotation curves were always approximately flat to large radii are given in Table 2. One possible scaling to real units has kpc and , so that and the unit of time is 12.4 Myr. We adopt this time scaling throughout but present masses, lengths, and velocities in natural units.
These simulations were run on a three-dimensional cylindrical polar grid code (described in Sellwood & Valluri 1997) with . We also ran tests with finer grids to verify that our results are not sensitive to the grid used. The radial spacing of grid cells increases logarithmically from the center, with the grid reaching to in most cases; except where noted, . For all of the simulations in Table 2, the vertical spacing of the grid planes, , was set to (except in run L1 where we reduced this to ), but we confirmed that our results do no change with smaller . We used Fourier terms up to in the potential,111In order that models remain centered at the origin, we excluded the term in the expansion. Including this term would result in large but artificial offsets between the bar and the center, similar to the ones found by McMillan & Dehnen (2005). which was softened with the standard Plummer kernel, of softening length , although we also tested smaller and larger maximum . Time integration was performed with a leapfrog integrator with a fixed time-step, for all runs with ; otherwise, we use . With these values, a circular orbit at typically is resolved into 600 steps. For the logarithmic halos, we set , while the Hernquist halos had .
| Run | Halo | ||||||||||
|---|---|---|---|---|---|---|---|---|---|---|---|
| L1 | 0.025 | 1.6 | 1.0 | Log. | 3.3 | -1.54 | -3.80 | 0.44 | 1.1 | 0.32 | 1.7 |
| L2 | 0.05 | 1.2 | 1.0 | Log. | 3.3 | -1.15 | -3.45 | 0.52 | 1.3 | 0.17 | 2.1 |
| L3 | 0.05 | 1.6 | 1.0 | Log. | 3.3 | -1.36 | -3.77 | 0.56 | 0.9 | 0.47 | 1.7 |
| L4 | 0.10 | 1.2 | 1.0 | Log. | 3.3 | -1.77 | -8.07 | 0.36 | 0.8 | 0.34 | 1.7 |
| L5 | 0.10 | 1.6 | 1.0 | Log. | 3.3 | -1.36 | -7.19 | 0.69 | 0.8 | 0.68 | 1.5 |
| L6 | 0.20 | 1.2 | 1.0 | Log. | 3.3 | -1.11 | -8.07 | 0.53 | 0.8 | 0.44 | 1.8 |
| S1 | 0.05 | 1.0 | 1.5 | Log. | 3.3 | -0.81 | -3.54 | 0.61 | 1.8 | 0.16 | 2.3 |
| S2 | 0.05 | 1.0 | 2.0 | Log. | 3.3 | -1.20 | -3.76 | 0.76 | 3.1 | 0.14 | 1.5 |
| S3 | 0.05 | 1.0 | 2.5 | Log. | 3.3 | -1.27 | -5.91 | 0.63 | 1.7 | 0.12 | 1.5 |
| H1 | 0.05 | 1.2 | 1.0 | Hern. | 20.8 | -1.39 | -5.68 | 0.46 | 1.1 | 0.22 | 2.4 |
| H2 | 0.05 | 1.6 | 1.0 | Hern. | 20.8 | -1.54 | -6.83 | 0.37 | 1.1 | 0.51 | 1.4 |
| H3 | 0.05 | 2.0 | 1.0 | Hern. | 20.8 | -1.94 | -5.22 | 0.06 | 1.2 | 0.70 | 1.0 |
, and are the disk Gaussian scale-height, Toomre- and halo scale-length, respectively. is the index of the initial Sérsic disk ( is an exponential disk). In column “Halo” we describe the halo type: a logarithmic or Hernquist potential. and are the maximum amplitudes of the bar and of buckling. Strong buckling corresponds to . The quantities , , and are all parameters of the bulgedisk decomposition at the end of the simulation. Here is the final value of the scale-length. The following simulations were presented also in Paper II: L2 (as R1), S3 (as R4), L6 (as R6) and H2 (as R7).
2.4. Tracking structural evolution
Our models host disks that are massive enough to form bars in a few dynamical times. The formation of the bar is just one of the mechanisms that drive the morphological evolution of the disks in our simulations. Spiral structure and vertical instabilities, like the buckling instability, also lead to secular evolution of disk structural parameters, from stellar density profiles and disk scale-lengths to the bulge-to-disk ratio. In order to track the evolution of our models, we measured the amplitude of the bar, , as the normalized amplitude of the density distribution:
| (4) |
where is the two-dimensional cylindrical polar angle coordinate of particle . The sum extends over stellar particles only. We measured the bending amplitude, , similarly:
| (5) |
These quantities allowed us to determine when a bar formed and whether it buckled.
3. Vertical evolution
The vertical direction is best resolved in the rigid-halo simulations, so we begin by considering those. By far the fastest secular evolution in the vertical direction is driven by the buckling instability. This bending instability, which is caused by anisotropy, is very efficient at heating the disk vertically.


Raha (1992) described the distortion of a bar during buckling. As that work is not widely available, we present a description of buckling in run L2 before exploring its effects on stellar disks. In the animation accompanying this paper (see also Figure 4) we show the evolution of this run between and Gyr. At Gyr, the system is largely symmetric about the midplane but develops a small bend by Gyr, which displaces the center toward positive and the outer parts of the bar toward negative . In the outer parts of the bar, where it has its largest vertical excursion, the bend develops on the leading side of the bar where it persists for some time, eventually evolving into a trailing spiral. As it passes the major axis of the bar, it grows substantially. After this bend has dissipated, the process repeats another two times (see also Martinez-Valpuesta et al. 2006), with small bends on the leading side of the bar, developing into stronger bends on crossing the bar’s major axis. At smaller radii within the bar, the peak bending amplitude occurs close to the minor axis (e.g. at Gyr). The region outside the bar also bends (e.g. at Gyr) but generally with smaller amplitude. Small-scale bending persists to late times and is still ongoing as late as Gyr. At Gyr, the buckling produces the largest mean vertical displacement, , which is more than 3 times the initial disk thickness for this simulation, .
Buckling leads to a significant vertical heating: at the center increases from to , and averaged inside increases by a similar factor, where is the vertical velocity dispersion and is the radial velocity dispersion. The three phases of strong bending (which can be seen in the accompanying animation) can be identified with three phases of strong vertical heating.
3.1. Peanuts from buckling
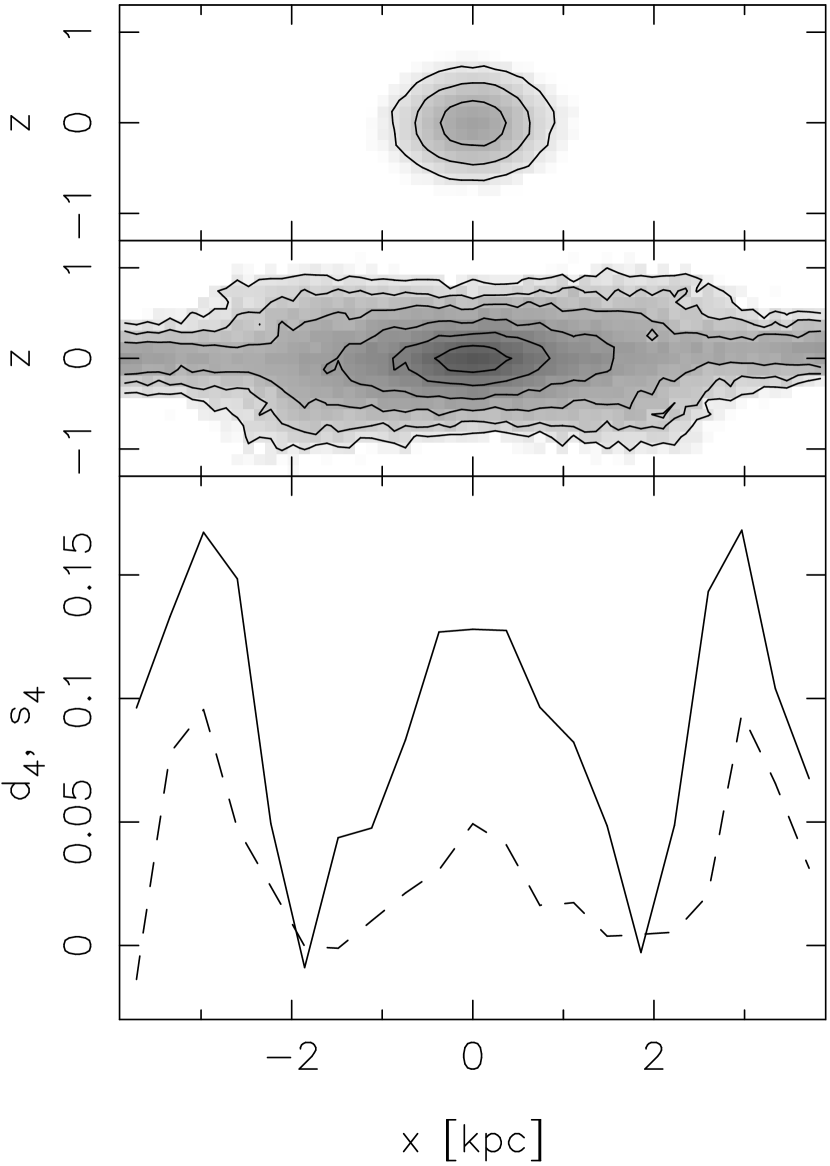
After buckling, model L2 becomes distinctly peanut-shaped when viewed edge-on. The disk scale-height has increased by factors of depending on where it is measured. It is larger on the minor axis of the bar than on the major, and is smallest at the center, properties that are typical of all of the rigid-halo simulations but are more pronounced for the buckled bars (see also Sotnikova & Rodionov 2003). The peanut results in a negative double minimum in , the fourth-order Gauss-Hermite moment (Gerhard 1993; van der Marel & Franx 1993) of the density distribution (i.e. the peanut produces a flat-topped density distribution) within the bar. The peanut is also manifest in the face-on kinematics as a pronounced negative minimum in the Gauss-Hermite kinematic moment, .222We use Gauss-Hermite moments in which the velocity scale is the rms. In order to distinguish this from the more commonly used best-fit Gaussian scale, we refer to this moment as rather than . No similar signature of a peanut is evident before buckling. In Debattista et al. (2005; Paper II) we developed this into a diagnostic signature of peanuts seen nearly face-on.
Buckling need not always result in a peanut. Both models L1 and L2 formed strong bars and had roughly equal buckling that vertically heated both disks substantially. However, whereas L2 formed a strong peanut, L1 formed only a weak one.
3.2. Vertical heating with live-halos and gas
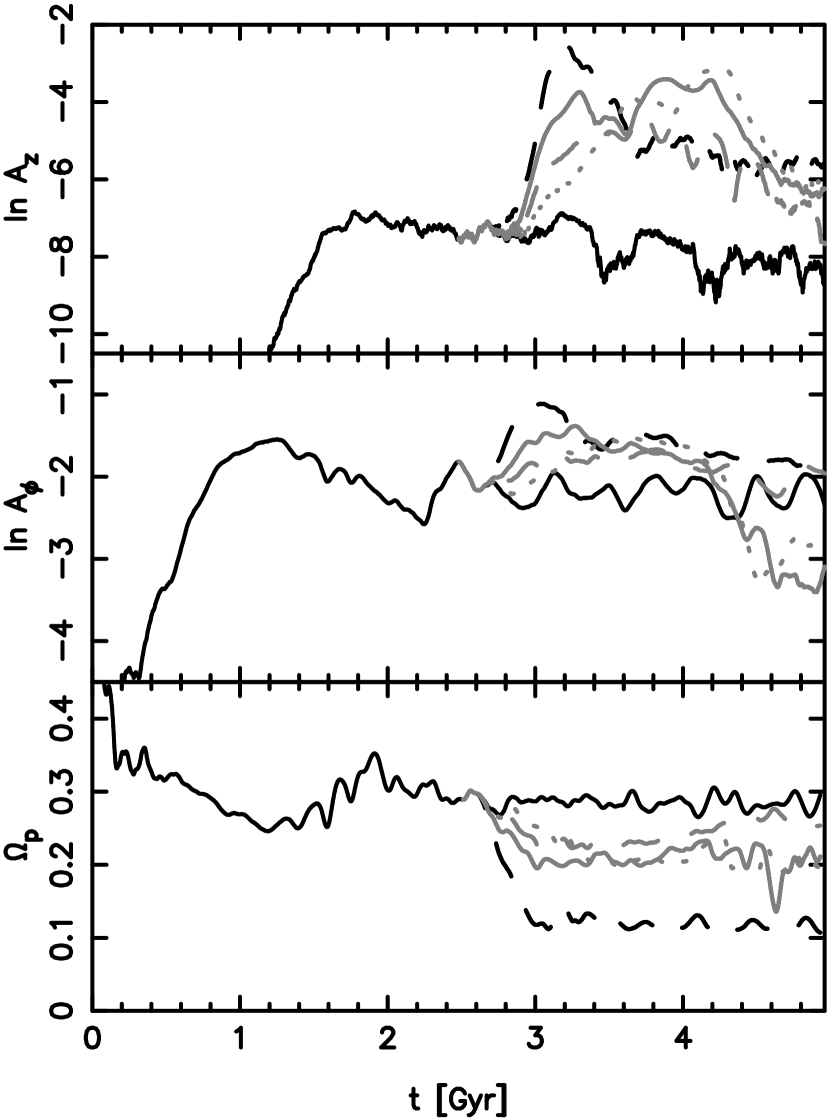
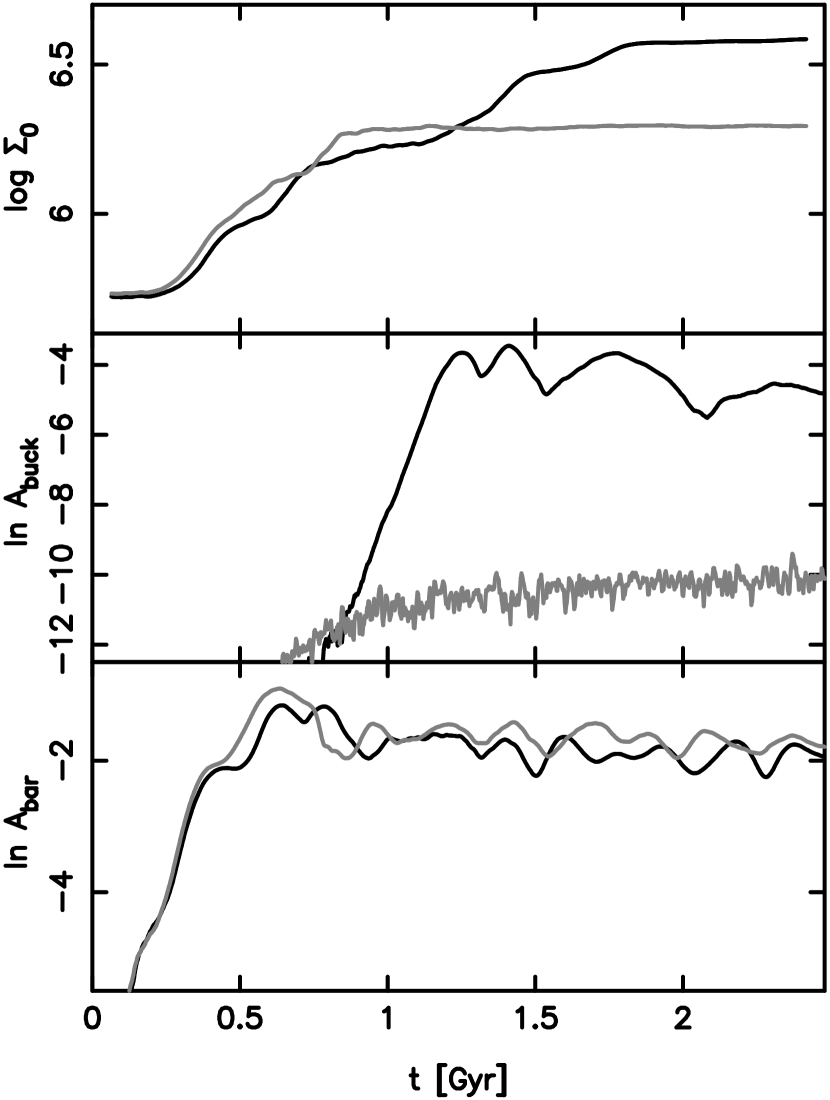
The vertical heating of disks in our simulations with live halos is dominated by the buckling instability when gas is absent. When gas is present, we found that it may suppress buckling, in agreement with Berentzen et al. (1998). (We tested that this result does not depend on force resolution by repeating runs with a softening 6 times smaller, i.e. 50 pc.) But this depends on how readily gas dissipates its thermal energy (see Figure 10), a point not appreciated by Berentzen et al. (1998) who performed only isothermal simulations. When the gas can cool (NG1), buckling is suppressed. In this case the bar amplitude decreases significantly because of the central gas concentration produced in the inflow driven by the bar. The reduced bar strength implies a reduced radial anisotropy in the system, which then is less prone to buckling (Berentzen et al. 1998). However, the bars in the gas case are not destroyed (see Section 4), which suggests that the complete suppression of buckling does not simply reflect the decrease in bar strength. This is evident especially in run NG3, which has gas cooling and star formation, in which a fairly strong bar is present and yet buckling did not occur. In Berentzen et al. (1998) weak buckling was always associated with weak bars.
In axisymmetric systems, central concentrations suppress bending modes (Sotnikova & Radionov 2005). Demonstrating a similar result in the barred case in the presence of gas is non-trivial. Indeed, whether gas suppresses buckling directly because it can dissipate bending energy or because it leads to central mass concentrations (Berentzen et al. 1998) proved difficult to determine because any experiment we could conceive of also led to different bars. For example, when we replaced the central (inner 600 pc) gas blob formed in run NG1 after Gyr with a point mass having equal mass and softening equal to its half-mass radius and evolved the system as purely collisionless, we found that the bar buckled, but in the meantime it also grew stronger. While we were not able to design a clear test for these two hypotheses, our results do exhibit a correlation between buckling amplitude and central mass concentration (Figure 5).


Vertical heating in the presence of gas occurs even without buckling, as shown in Figure 6. In NG1 and NG3, in which no buckling occurs, we still see an increase in the vertical stellar velocity dispersion. This heating is gentle, with increasing nearly linearly with time and never falling below the critical threshold of . The cause of this vertical heating appears to be scattering by spirals in the gas disk, which remains significantly thinner than the stellar disk in this simulation. In contrast, heating by buckling, as in run NG2 (in which the gas disk quickly became thicker than the stellar disk) is abrupt. The gas thickness in this simulation results from a steadily increasing temperature as a result of shock heating.
3.3. Peanuts without buckling
The live-halo simulations show an alternative way in which peanuts can form. The gas-free live-halo simulations all buckled and in the process formed peanuts no different from those described above. In some simulations with gas (e.g. NG3) we found peanuts forming without buckling. It is possible that these formed by direct resonant trapping of orbits in the growing bar potential (Quillen 2002). Indeed, in run NG3 increased by a factor of about 2 over a period of Gyr (Figure 10).
3.4. Peanuts in the presence of gas
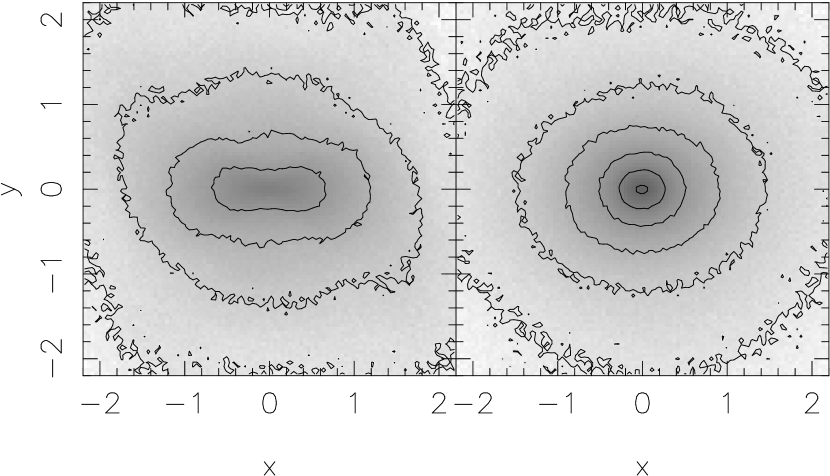
We showed in Paper II that peanuts produce prominent minima in the kinematic Gauss-Hermite moment, , when viewed face-on. In Figure 7 we show that a peanut can still be recognized by a prominent negative minimum in in model NG2, despite the presence of gas. The reason for this is that the gas sinks to smaller radii than the peanut.
4. Bar Destruction
Both the buckling instability and the growth of massive central objects have been suggested to destroy bars. We examine each of these in this section.
4.1. The collisionless case
After Raha et al. (1991) showed that buckling weakens bars, it has often been assumed that bars are destroyed by buckling. To our knowledge, that buckling destroys bars has never been demonstrated; indeed, none of the bars in our simulations were destroyed by buckling. Merritt & Sellwood (1994) noted that buckling grew stronger when force resolution was increased because then particles have larger vertical oscillatory frequencies, destabilizing the bar. Thus, the most damaging buckling occurs in the rigid-halo simulations, where the vertical structure is best resolved. We verified that the survival of bars after buckling is not due to insufficient resolution by running an extensive series of numerical tests at higher resolution using rigid halos. For these tests, we used model L2, one of the most strongly buckling simulations. The bar amplitude after buckling in these tests turned out to not be strongly dependent on any numerical parameter. Thus, that buckling does not destroy bars is not an artifact of insufficient resolution. This conclusion is also supported by a higher resolution version of the live-halo simulation of Paper I, where we increased the number of particles (, ) and decreased the softening ( pc for all particles). Again, although buckling was strong here as well, the bar was not destroyed.
We also checked that increasing spatial resolution does not lead to stronger buckling in weakly buckling simulations. We re-ran simulations L5 and H1 at higher resolution (, and ) and found that is barely affected, demonstrating that vertical frequencies were well resolved and confirming that the weak bucklings are intrinsic.
4.2. The effect of bar slowdown
Although our grid code simulations have high resolutions, they have rigid halos; thus bar slowdown (Weinberg 1985; Debattista & Sellwood 1998, 2000; Sellwood & Debattista 2006) is not included. Araki (1985) showed that stability to bending modes in the infinite, uniform, non-rotating sheet required that . As a bar slows, is likely to increase, which may drive a stable bar to instability. To test whether this happens, we slowed down some of our bars by introducing a retarding quadrupole moment
| (6) |
trailing behind a bar. Here and , so that the perturbation is gently switched on at and off at . The phase of the bar, , was computed at each time-step by computing the phase of the Fourier moment of all of the particles; since the disk also has spirals, there is a typical uncertainty of order in the bar angle. We therefore set to be certain that the retarding potential always trails the bar. We chose the radial dependence of the retarding potential to be , which ensured that it peaks inside the bar radius.
We performed these experiments on runs L2, L4 and H2; a list of all of the experiments is given in Table 3. For run L2, we switched on the quadrupole shortly after the bar formed and switched it off before it buckled. In this case we found that the buckling is then stronger, which leaves the bar weaker but still does not destroy it.
| Run | |||
|---|---|---|---|
| L2.s1 | 16. | 0.74 | 1.24 |
| L2.s2 | 1.6 | 0.74 | 1.24 |
| L4.s1 | 1.6 | 2.60 | 3.10 |
| L4.s2 | 4.8 | 2.60 | 3.10 |
| H2.s1 | 4.8 | 2.60 | 3.10 |
| H2.s2 | 1.6 | 2.60 | 3.10 |
| H2.s3 | 0.8 | 2.60 | 3.10 |
| H2.s4 | 0.8 | 2.60 | 3.72 |
measures the relative amplitude of the retarding perturbation, while and give the time when the perturbation is switched on and off.
The other two systems on which we tried such experiments had not buckled when undisturbed. In these cases, we turned on the retarding quadrupole after the bar had settled and turned it off not less than 1.5 bar rotations later. Slowing down these bars resulted in very strong buckling, stronger even than in run L2. But even in these somewhat extreme cases the bar survives; we illustrate this in Figure 8, where we show the various bar slowdown experiments in model H2. While these bucklings do not destroy bars, which we determine simply by visual inspection, in a few cases they leave a much weaker bar, which would be better described as an SAB than an SB. In Figure 9 we present the most extreme example of H2.s4, in which the final bar axis ratio was ; although weak, this can still clearly be recognized by visual inspection. The edge-on view of a slice taken around the bar’s major axis reveals a peanut, which can be recognzed by the double minimum in the diagnostic. These slowed bars probably represent an upper limit to the damage buckling can inflict on strong bars.
In the live-halo simulations, where the bar can interact with the halo and slow down, we continue to find that buckling does not destroy bars. Therefore we conclude that the bar buckling instability does not destroy bars (see also Martinez-Valpuesta & Shlosman 2004).
4.3. Central gas mass growth
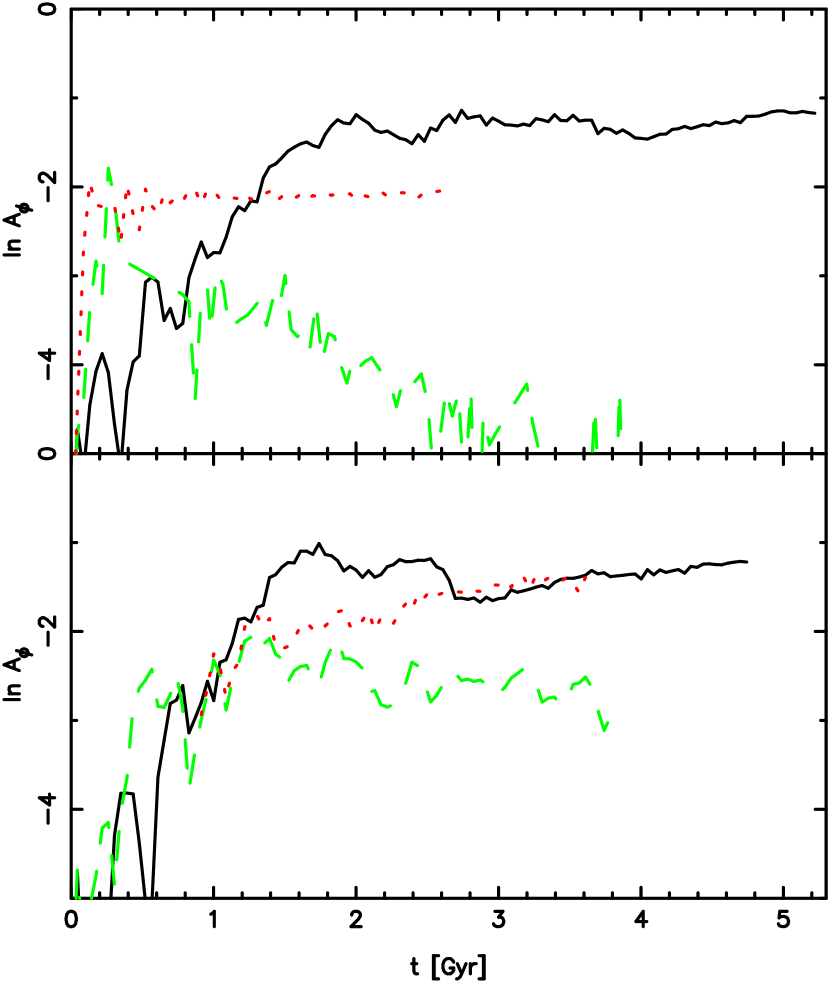
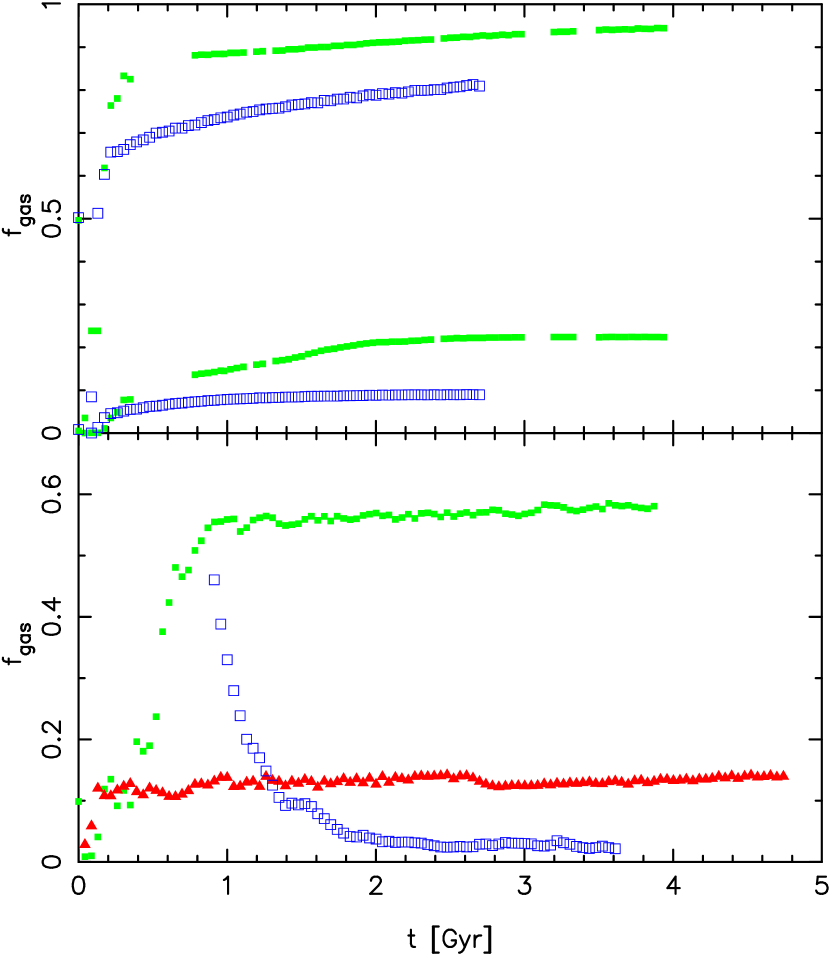
We now consider bar destruction via the growth of a massive central gaseous object. The bottom panel of Figure 10 shows the evolution of the bar amplitude for models NG1-NG3. The bar amplitude depends very strongly on the gas physics: when the gas is adiabatic (NG2), it does not become very centrally concentrated and the bar amplitude is not very strongly affected by the gas. If the gas can cool (NG1), it sinks quickly to the center and remains there. Thus, the bar forms already much weaker. Continued infall at later times further weakens the bar. The main difference between the cooling and adiabatic simulations is in the amount of gas that sinks into the center of the disk. In NG1, gas accounts for of the mass within 500 pc (Figure 11); with such a high fraction, it is unsurprising that the bar is weaker. The softening in these simulations is 300 pc; therefore, the central gas mass is not well resolved. At these scales the hydrodynamical resolution is higher than the gravitational force resolution (the gravitational softening volume contains many times the SPH smoothing volume) with the result that the collapse of gas toward the center is inhibited (see Bate & Burkert 1997). Therefore, the same amount of gas would probably have collapsed to an even smaller radius had we had greater force resolution, weakening the bar further. In NG2 gas cannot radiate away the intense compressional heating it experiences, and only by mass is found within 500 pc. Thus, its bar is stronger than in NG1. When star formation is allowed (NG3), the gas accumulated into the center drives a starburst. This converts most of the highly concentrated gas into stars, which can now support the bar. A strong bar again forms. Since our simulations do not include feedback, none of the mass that falls in flows back out; up to Gyr, there is very little difference in the (azimuthally-averaged) density profile inside 3 kpc between runs NG1 and NG3. Later profile differences are most likely caused by the difference in the bars, which, being stronger in run NG3, leads to further infall to the center.
Not much changes at higher gas mass fraction if the gas is adiabatic (NG4). Then the gas layer is quite thick, producing a bar that, although somewhat weaker than in the purely stellar case (NC3), is still quite strong. When the gas can cool (NG5), the gaseous disk becomes violently gravitationally unstable and a new phenomenon appears, namely, the fragmentation of gas into clumps that sink to the center, dragging an associated stellar clump. Such clump instabilities have been found in previous simulations (Noguchi 1999; Immeli et al. 2004) and have been shown to build central bulge-like objects directly. Immeli et al. (2004) showed that the rate at which clouds dissipate their energy is the main parameter that determines whether the clump instability occurs. As a result of the central mass, only a weak bar forms, and this is eventually destroyed by continued gas inflow.
In our fully self-consistent simulations with cosmologically motivated halos, we found that the fraction of the total disk mass needed to destroy the bar (; Figure 11) is in very good agreement with that recently found by Shen & Sellwood (2004), as is the gradual decay of the bar amplitude (Figure 10). This result is different from that of Bournaud et al. (2005); we note that our model NG5 differs from theirs in two important ways. NG5 has a live halo versus their rigid halos, and the dark matter halo is strongly concentrated at the center. Both properties of our halos allow angular momentum to be transferred from bar to halo efficiently (Weinberg 1985; Debattista & Sellwood 1998), which may perhaps account for the difference in these results.
5. Inner Profile Evolution
We explore the evolution of density profiles at large radii in §6, and in §7 we discuss the bulgedisk decompositions that result from profile evolution. In this section we explore this evolution qualitatively.
5.1. Buckling and central densities
Bar formation leads to a change in density profiles. As was already noted by Hohl (1971), the central density generally increases while the outer disk becomes shallower. In Figure 12 we show that bar formation leads to an increase in the central density in run L2 (here we define central density from particle counts inside ). Moreover, as already noted by Raha et al. (1991), buckling may also increase the central density of a disk. We demonstrated directly that buckling is responsible for an increase in central density by re-simulating this system with an imposed symmetry about the mid-plane, which prevents buckling. Figure 12 shows that when buckling is absent, no further increase in central density occurs. The buckled system is 2.0 times denser at the center than when it is prevented from buckling.
5.2. Disk scale-lengths and angular momentum
In Paper I we argued that the fact that the evolution of the scale-length of the outer disk changes under the influence of the bar, even when the total baryonic angular momentum is conserved, implies that the distribution of disk scale-lengths does not follow automatically from that of halo angular momenta. The increase in disk scale-length is due to transfer of angular momentum from the bar to the outer disk (Hohl 1971). It is remarkable that the disk outside the bar remains exponential out to the point where a break occurs, in both collisionless and dissipative systems. Hohl (1971) was the first to notice that exponential disks are naturally obtained after bar formation (outside the bar) even when the initial disk did not have an exponential profile. Since bars are ubiquitous in galaxies at low and high redshift (Jogee et al. 2004), it follows that the effect of secular evolution on disk sizes has to be included in any realistic galaxy formation model.
Not only do bars change disk scale-lengths, but the amount by which they change varies dramatically depending on the profile, even for (nearly) identical initial angular momentum. Consider models H1, H2, and H3. These all have the same initial conditions other than Toomre-, leading to difference in the total baryon angular momentum. Nevertheless, the final values of range from to (Table 2). We conclude that the direct mapping of halo spins into a distribution of disk scale-lengths (e.g. Mo, Mao & White 1998) will not yield correct predictions.
6. Outer Disk Breaks
Disk densities do not always exhibit a single exponential profile. More typically a sharp break between an inner and outer profile is evident. These breaks are often referred to as truncations following the apparently sharp drop-offs first discovered by van der Kruit (1979). Subsequently, van der Kruit & Searle (1981a,b) fitted sharp truncations to light profiles at large radii. However, de Grijs et al. (2001) found that truncations occur over a relatively large region, rather than sharply. The larger sample of Pohlen (2002) confirmed this result; he found that truncations are better described by a double-exponential profile with a break radius. For his sample of mostly late-type systems, Pohlen (2002) estimates that the fraction of disk galaxies with breaks is . Similar disk breaks have been found up to redshifts of (Pérez 2004; Trujillo & Pohlen 2005). What is the origin of these features in the light distribution of disks? In Section 5 we showed that the angular momentum re-distribution caused by the bar leads to an increased central density and a shallower density profile outside this. This angular momentum redistribution cannot be efficient to arbitrarily large radii; thus, we may ask whether secular evolution can give rise to breaks in density profiles.
Studying breaks in -body simulations is numerically challenging because they generally occur at large radii, where the density of particles is low. We therefore ran several high-resolution rigid-halo simulations with disks extended as far as ; with -particles the initial conditions still had particles at and at , sufficient to properly measure the density profile out to the large radii required. We chose this large in order to ensure that edge-modes (Toomre 1981) do not interfere with other secular effects. The series of simulations we used in this study is listed in Table 4.
In order to compare our simulations with observations, we used the double-exponential fitting form of Pohlen (2002). We only fit profiles at ; the lower limit is needed to avoid the central bulge-like component. At very large radii, the surface density barely evolves because of the low self-gravity (although all of our models were evolved for at least three rotations at the outermost radius). Clearly the profile at larger radii reflects only our initial conditions. A reasonable transition radius between the initial profile and the secularly evolved profile occurs at , which we use as our upper limit on the double-exponential fits. (For the initial pure exponential profile this is equivalent to mag fainter than the center.)
These fits give three dimensionless quantities: , the ratio of break radius to inner scale-length, , the ratio of outer scale-length to inner scale-length and , the difference between the central surface-brightnesses of the two exponential fits, which we compare with the data of Pohlen et al. (2002) and Pohlen & Trujillo (2006).
| Run | ||
|---|---|---|
| L2.t8 | 8 | 1.2 |
| L2.t12 | 12 | 1.2 |
| L4.t12 | 12 | 1.2 |
| L5.t12 | 12 | 1.6 |
| H1.t12 | 12 | 1.2 |
| H2.t12 | 12 | 1.6 |
| H3.t12 | 12 | 2.0 |
| T1.t12 | 12 | 1.2 |
6.1. The face-on view
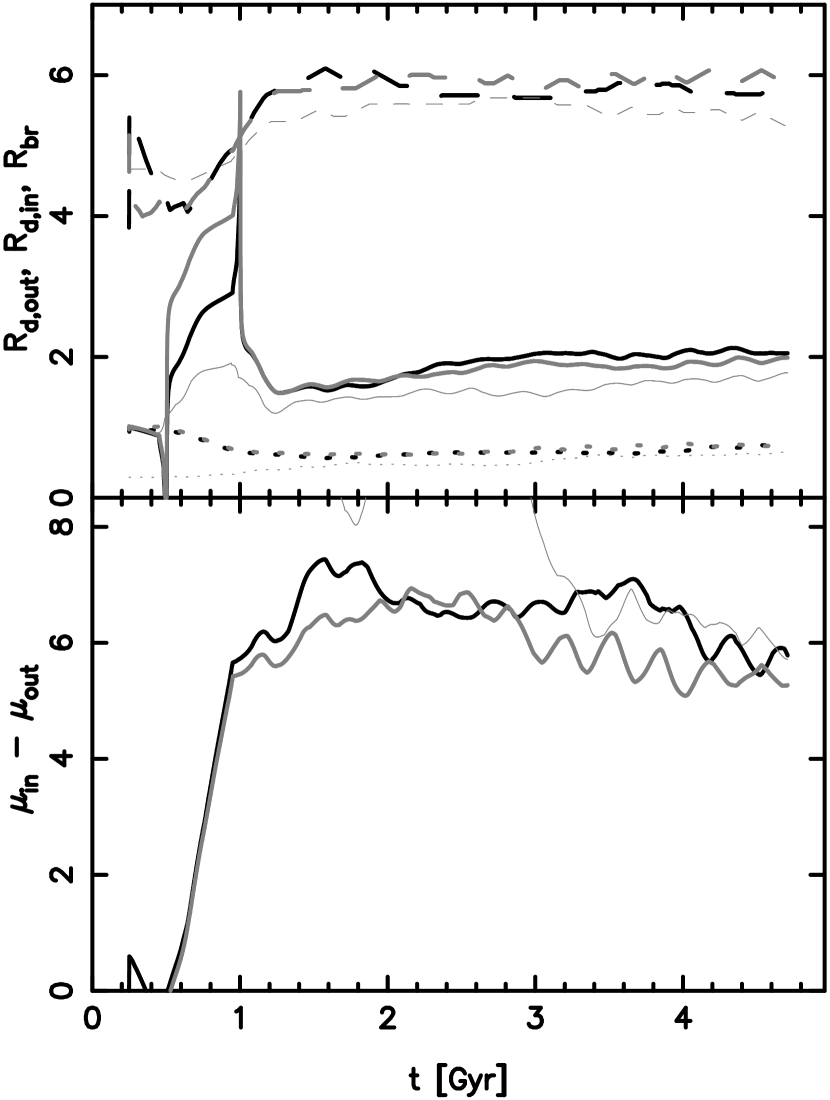
Several of our simulations produced clear breaks of the double-exponential type. We present one example in Figure 13, where we show the initial and final profiles in run L2.t8. The profile very quickly develops from a single exponential to a double-exponential. In Figure 14 we plot the evolution of the parameters of the double-exponential profile for this run and for runs L2 and L2.t12. The formation of the break in these three simulations is obviously a discrete event. Their bars formed at Myr; does not evolve substantially after Myr. Because of this near coincidence in time, we conclude that, in these simulations, the process of bar formation can directly or indirectly somehow lead to the formation of broken profiles.


Figure 14 also investigates the difference between (black lines), (thick gray lines), and (thin gray lines) (models L2.t8, L2.t12, and L2, respectively). The similarity of the break parameters in the three simulations shows that the breaks do not result from edge-modes (Toomre 1981). In run L2, the initial disk did not extend as far as the final break radius; thus, the break is not an artifact of our initial disk extending to very large radii. Therefore, all parameters of the double-exponential profile that develops can be considered robust.
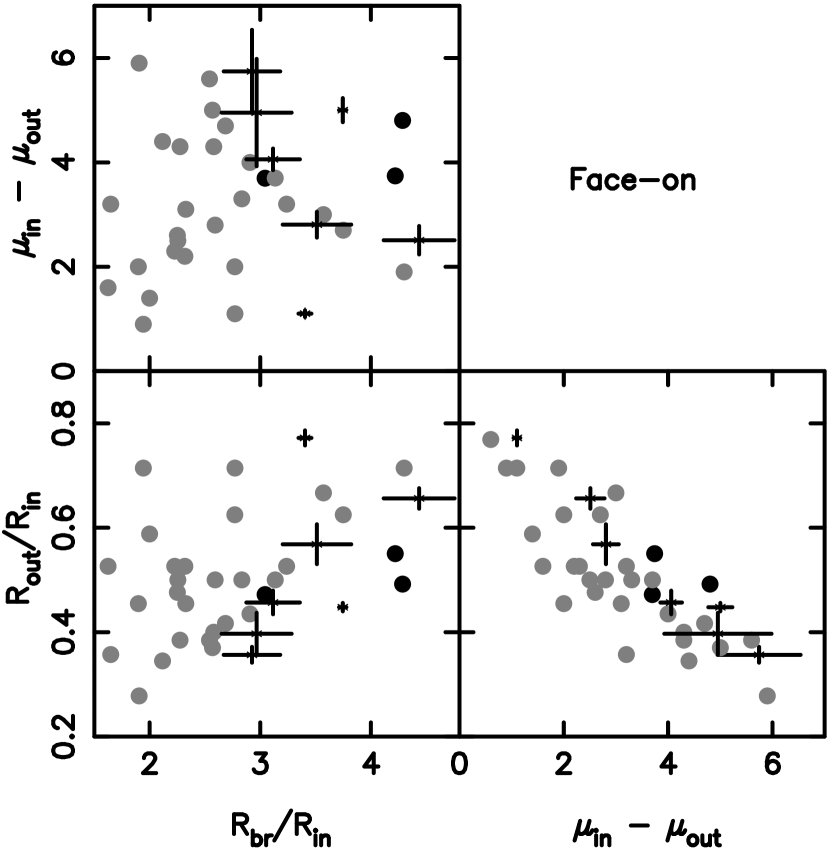
In Figure 15 we compare the break parameters of the simulations with the observations of Pohlen et al. (2002) and Pohlen & Trujillo (2006) for a combined sample of 31 face-on galaxies. Our simulations are in reasonable agreement with the observations, although they span a smaller part of the parameter space. The agreement in the narrow distributions in the , -plane is quite striking.
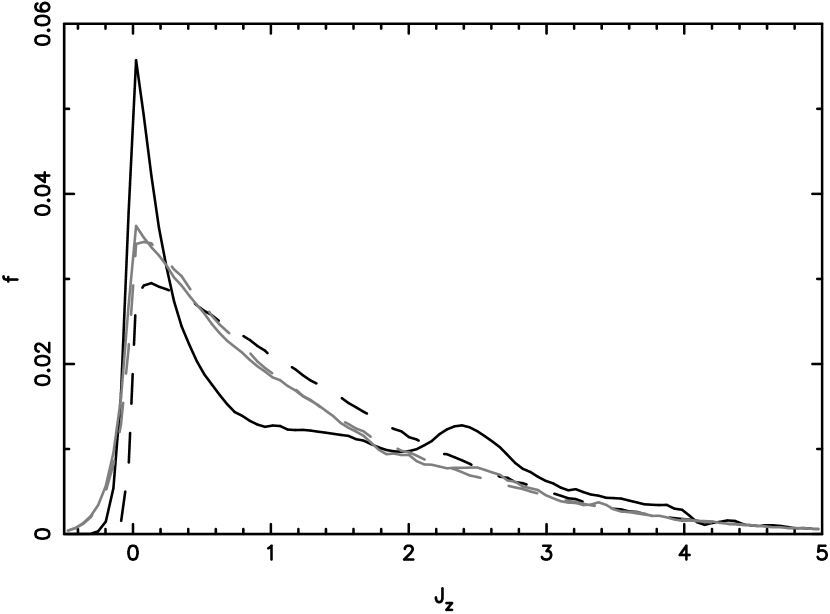
We explore the angular momentum redistribution that leads to the breaks in Figure 16. This plots the distribution of angular momenta in the initial conditions and at the end of the simulation for runs H1.t12 (with ) and H3.t12 (which did not form a break). In the left panel we see that very little angular momentum redistribution occurred in run H3.t12. On the other hand, in run H1.t12, bar formation leads to an excess of low angular momentum particles. At the same time, a second smaller peak forms at (see also Pfenniger & Friedli 1991). The right panel plots the location of particles in this angular momentum range. We find that the bulk of these particles occur inside the break radius, supporting the interpretation that breaks occur because of angular momentum redistribution.
6.2. The edge-on view
Observationally, breaks have often been sought in edge-on systems, since this orientation leads to higher surface brightnesses. Comparing to such data is complicated by the fact that these projections integrate along the entire line-of-sight. At very large radii, the density profile does not evolve and reflects initial conditions. In order to avoid being biased by these effects, we again limit our double-exponential fits to projected radii ; however, we integrate along the entire line-of-sight since to do otherwise would require an arbitrary cutoff. In order to increase the signal-to-noise ratio of our measurements, we use all particles regardless of their height above or below the disk mid-plane. Moreover, in the edge-on case, the break parameters depend on the bar viewing orientation. Therefore, to compare with simulations, we consider all orientations of the bar between . The right panel of Figure 13 shows an example of one of our fitted edge-on breaks.
The largest observational sample of disk breaks consists of 37 edge-on galaxies studied by Pohlen (2002). We compared our simulations to these data; the results are shown in Figure 17. Variations in lead to large variations in the parameters of the double exponential fit. Nonetheless, these fall within the range of observed systems. This is particularly striking in the plane, where the observational data span a narrow part of the space. Thus, we conclude that simple secular evolution suffices to produce realistic disk breaks.
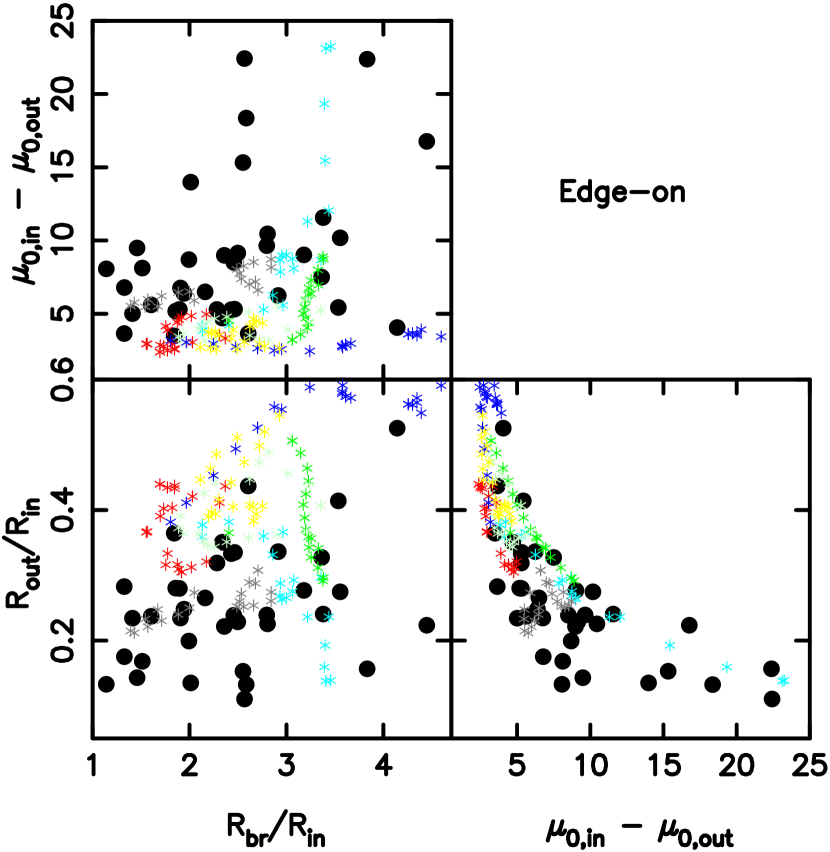
Figure 17 shows the effect of the line-of-sight integration: runs L2.t8 (gray asterisks) and L2.t12 (cyan asterisks), which have very similar intrinsic (i.e. face-on) breaks (Figure 14), have very different breaks in the edge-on view. Nevertheless, in both cases the resulting parameters are in good agreement with those in real galaxies.
6.3. Unbroken profiles
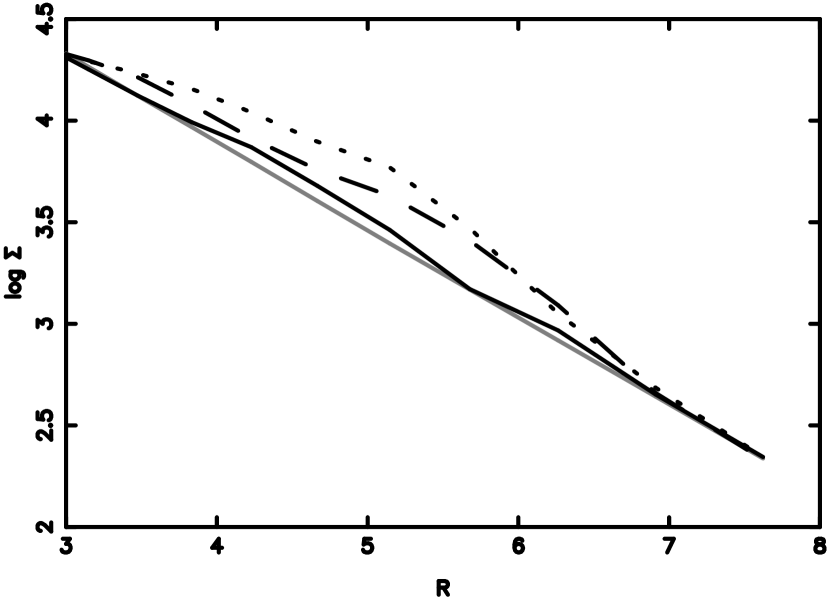
Not all disk galaxies exhibit breaks (Weiner et al. 2001; Pohlen & Trujillo 2006). A successful theory of break formation must also be able to explain such unbroken profiles, which may present difficulties for a star-formation threshold explanation of disk breaks (Schaye 2004; Elmegreen & Hunter 2005). In our simulations, the formation of a bar is not always accompanied by the formation of a break in the disk density profile. For example, run H3.t12 formed a bar, which was not weak, but the profile remained largely exponential, as can be seen in Figure 18. Similarly, model L5.t12, with , failed to produce a break.
We investigate the dependence of break parameters on the disk temperature by considering a set of models in which only of the initial conditions varies (H1.t12, H2.t12, and H3.t12). We plot the density profiles in Figure 18. At , a prominent break develops in the density profile. At , a break is still evident, although weaker. By no break forms in the density profile.
6.4. Interpretation: bar-spiral coupling
The breaks that develop in our simulations are associated with the angular momentum redistribution induced by the bar. In all cases the breaks are well outside the bar semi-major axis (always ). The radius at which the breaks develop instead appears to be set by spirals resonantly coupled to the bar. Resonant couplings between bars and spirals have been described before (e.g. Tagger et al. 1987; Sygnet et al. 1988; Masset & Tagger 1997; Rautiainen & Salo 1999).


Evidence for this hypothesis from run L2.t12 is presented in Figure 19. The right panel shows the frequency spectrum of perturbations. The bar’s pattern speed is , while that of the spirals is . For the rotation curve of this system, this puts the corotation radius of the bar at about the inner 4:1 resonance radius of the spirals. The outer Lindblad resonance (OLR) of these spirals is at . The break sets in at , suggesting that it develops interior to the spiral OLR, at which spiral waves are absorbed. The left panel shows that the peak amplitude of perturbations decreases dramatically between , just outside where the break develops (see Figure 14). We stress that other spirals with different pattern speeds can and do propagate to even larger radii. Resonantly coupled spirals are favored in that they are stronger, so they transmit more efficiently the angular momentum shed by the bar during its formation.
For an independent test of this hypothesis we evolved a model with very different resonance radii: in simulation T1.t12 we forced a smaller bar with a larger pattern speed by making the disk more massive in the center (while still exponential in the outer parts). Assuming a corotation-4:1 bar-spiral coupling, this would bring in the spiral OLR to roughly ; indeed we found a break at .
Thus, we propose that profile breaks develop interior to where the angular momentum shed by the bar and carried away by resonantly-coupled spirals is deposited.
7. Bulge+disk decompositions
We compare the simulations with observations of bulges using the parameters of one-dimensional bulge+disk (bulge+disk) decompositions and at a given flattening. Here is the peak line-of-sight velocity within some same radial range on the disk major-axis and is the line-of-sight velocity dispersion (averaged within the same radial range).
We decomposed the face-on, azimuthally-averaged radial mass profiles of our simulations into a central Sérsic and an outer exponential component, which we will refer to as “bulge” and “disk,” respectively. These decompositions are characterized by five parameters: , (the exponential and Sérsic central surface density, respectively), (final exponential scale-length), (the Sérsic effective radius), and (the index of the Sérsic profile). In our bulge+disk fitting, we computed the fits at fixed and obtained the best fit, including , by repeating the fits for in the range 0.1-4 in steps of 0.1, then selecting the fit with the smallest . We did not distinguish between Freeman types in our bulge-disk decompositions. In several cases, therefore, the profile fits represent a best-fitting average between small and large radii.
We compare our simulations with observed galaxies in the dimensionless space spanned by the parameters , , and , the bulge-to-disk mass ratios for profiles extrapolated to infinity. The photometric data came from two separate studies. Our first sample comes from MacArthur et al. (2003), who presented bulge+disk decompositions for a sample of 121 predominantly late-type galaxies of various inclinations, observed in , , , and bands. This study considered only systems with Freeman type I (i.e. exponential) disk profiles in all bands. As our systems often exhibited transient type II phases, we also used the decompositions of Graham (2001, 2003). These were obtained from the diameter-limited sample of 86 low-inclination disk galaxies of all Hubble types observed in the , , , and bands by de Jong & van der Kruit (1994). It is well known that bulge+disk structural parameters depend on the filter used (e.g. Möllenhoff 2004). We compared directly with the data in all passbands; thus, any discrepancies we find between simulations and observations are not likely to be due to any differences in mass-to-light ratios of disks and bulges.
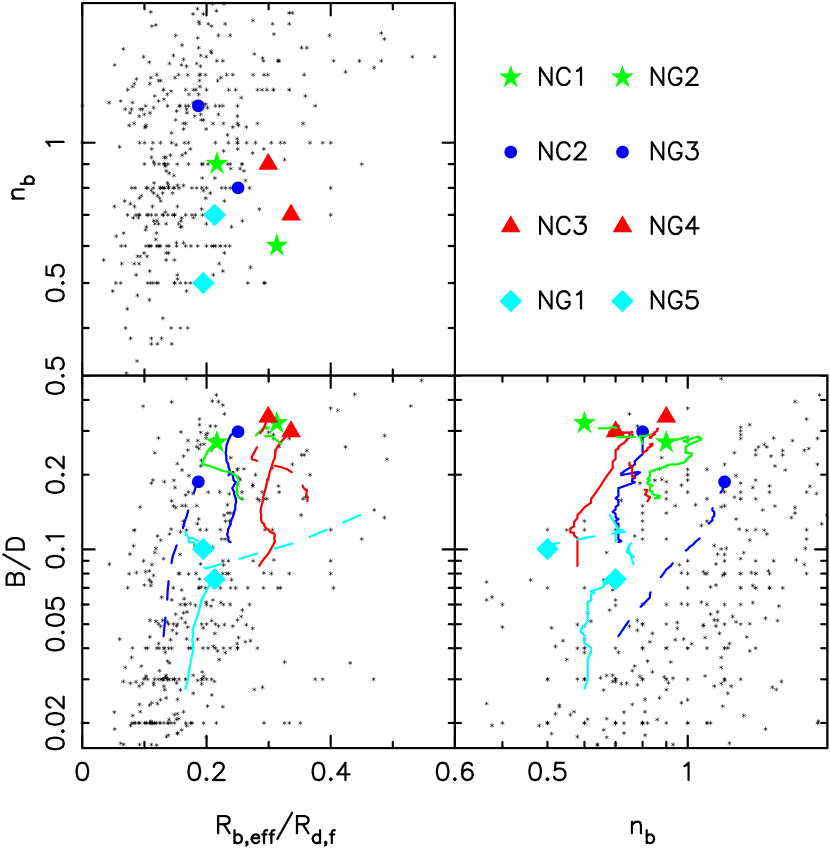
Paper I presented the decompositions of the rigid-halo models where we showed that the models partly overlap with the observations but are mismatched elsewhere. This mismatch can be diminished if only those bulges rounder than the disk are considered, but at the cost of requiring inclinations . In Figure 20 we present the face-on bulge+disk decompositions for live-halo models after bar formation. Several trends are worth noting. Compared with Paper I, the main changes are the generally smaller and values, as well as the smaller discrepancy with observations, although a small discrepancy is still evident in the ,-plane. All simulations fall in the same space as observed galaxies in the -plane plane. In the absence of gas, the values of tend to their largest values. Moreover, this quantity increases with time, a result of the continuing loss of disk angular momentum to the halo, leading to denser disk centers. Indeed, we find that the density of the inner region increases through most of the simulation. Introducing gas leads to a lower when the gas can cool (NG1) because the resulting central gas concentration leads to a weaker bar. When the gas is adiabatic (NG2), the central mass that grows is significantly smaller, the bar amplitude is not much different from the collisionless case, and the ratio is about as large as in the collisionless systems. When star formation is included (NG3), the ratio is intermediate between NG1 and NG2 and is continually increasing, changing by almost an order of magnitude as gas is turned into stars. When gas accounts for of the disk mass, the ratio is again high when gas is adiabatic (NG4) but remains smaller when it can cool (NG5), in which case a bulge is built via the clump instability (Noguchi 1999; Immeli et al. 2004).
Some overall trends can be noticed. Generally the systems evolve parallel to the mean observed correlation between and largely because does not evolve much. In the - and -planes, the simulations show a slight tendency to fall outside the observed range, with evolving toward values larger than observed. The exception is model NG3, which evolves parallel to the mean relation between these two parameters. This model is also comfortably within the range of observed bulges in the -plane. Thus, dissipation with star formation is an important ingredient in the secular assembly of the bulges seen today.
We compared the kinematics of the bulges with observations in the ,-plane at various orientations. Because of the smaller number of particles compared with the rigid-halo simulations, we were not able to fit ellipses as in Paper I. We therefore obtained the effective radius of the inclined system through a Sérsic bulgeexponential disk fit to the mass distribution along the major (i.e. inclination) axis. As in Paper I, because our bulges are poorly fitted by a de Vaucouleurs profile, we measure kinematic quantities and mean ellipticities at both one-half and one effective radius and use the differences as an error estimate. Ellipticities were measured from the two-dimensional mass moments of the projected mass distribution at these two radii, with the difference between the two giving an error estimate. Each of the final states of the simulations is viewed at inclination of or and for position angles , or .
In Figure 21 we report the results. The larger scatter in the live-halo simulations compared with the rigid-halo simulations (shown in Paper I) is mainly due to the lower number of particles and related discreteness noise of the mass distribution at radii only a few times larger than the softening length. Overall live and rigid-halo simulations occupy very similar locations, with many systems below the locus of oblate isotropic systems flattened by rotation. Indeed, the simulations include systems significantly flatter than the observations. These are usually systems in which the peanut is less pronounced due to weak buckling and the bar still very strong (a clear example is run NG3), and they are viewed at small position angles and high inclinations; these objects would appear markedly bar-like and thus probably would not be included in surveys of bulges. Anisotropy clearly plays a role in determining the flattening, which is unsurprising given that almost all bars survive. Systems with gas tend to have higher for a given value of the ellipticity, and the most gas-rich systems are those that lie closest to the locus of oblate isotropic rotators. This is expected if the gas falling toward the center sheds a fraction of its angular momentum to the stars and spins them up. Run NG3 produces a system with the highest flattening due to a combination of a strong bar and the suppression of the buckling of the bar.

7.1. The pseudo-bulge formed by the clump instability
The gas sinking to the center of run NG5 was sufficient to destroy the bar. Because we have no star formation in this simulation, we are left with a rotationally supported massive central gas disk. Star formation would have presumably led to a thin, rotationally supported pseudo-bulge. The mass of gas within one kpc (which is measured face-on from only the stellar component) is . The associated aperture dispersion within is . In order for the resulting bulge to sit on the relation (Gebhardt et al. 2000; Ferrarese & Merritt 2000; Tremaine et al. 2002), less than of this gas needs to collapse into a black hole. This shows that disk instabilities are another way, in addition to gas-rich mergers (Kazantzidis et al. 2005), by which a significant reservoir of gas can be built to feed an already existing central supermassive black hole or perhaps produce a new one. Since violent gravitational instabilities in the gas disk need a high gas mass fraction, such a mechanism might have played a role in the formation of seed black holes at high redshift.
8. Discussion and conclusions
In this paper we explored the secular evolution of disk structural parameters using simulations. The initial galaxy model is similar to a “Milky Way”-type galaxy that might form within a CDM universe. We have found that bar formation leads to a significant mass redistribution both in and away from the disk plane. The evolution of stellar surface density profiles and the formation of peanut-shaped, dynamically hot stellar structures in the central regions of the disk are both consequences of bar formation. Angular momentum redistribution can lead to large changes in density profiles, resulting in profiles that can be reasonably fitted by a central Sérsic and an outer exponential component. These can be identified as bulge and disk components, respectively, although fundamentally they remain bars. On purely photometric grounds it is difficult to distinguish these profiles from bulge+disk decompositions for real galaxies; however, kinematically these secular bulges clearly fall below the oblate isotropic rotators. Real bulges are observed to be at or above this line.
We have shown that when bars occur in a typical bright spiral galaxy, they are difficult to destroy. The buckling instability, which is one way a peanut-shaped bulge can form, is suppressed when gas is highly concentrated in the center of the disk. A peanut can form other than through a major buckling event in such systems. It is interesting to note that when buckling occurs, it peaks typically Gyr after the bar forms. It is only at this point that the peanut-shaped bulge appears.
Our main results can be summarized as follows:
-
1.
While strong buckling always leads to significant vertical heating, we found that heating does not always result in a peanut structure. When buckling occurs, the central density may increase; in one simulation this increase more than doubled the central density. As a consequence, the Sérsic index of the resulting bulge+disk decomposition increases somewhat.
-
2.
The effect of gas on the buckling instability depends on the gas physics. When the gas evolution included radiative cooling, buckling was not possible and no peanuts formed. When the gas is adiabatic, buckling can occur and peanuts form. This difference might arise because the higher central gas concentration suppresses bending modes, as suggested by the correlation between strength of buckling and central gas mass concentration. However, a clear test is needed to discriminate between this scenario and one in which buckling does not occur because the energy in the modes is dissipated by radiative cooling. Peanuts can still be recognized by the negative minimum in the criterion (Debattista et al. 2005) even when gas is present because it sinks to small radii, with the peanut at larger radii.
-
3.
We found no case in which buckling destroyed a bar. In Paper I we demonstrated this with the rigid-halo simulations. In this paper we showed that this result continues to hold when a live halo is included. The most damaging buckling events we saw were induced in the rigid-halo simulations by slowing bars, but even in those cases a bar survived. Sometimes, however, the surviving bar is weak and may be better described as SAB rather than SB.
-
4.
Density profiles may evolve substantially under the action of a bar. Reasonable bulge+disk decompositions can be fitted to the resulting profiles. When comparing the fits with observed galaxies, purely collisionless secular evolution gives rise to systems marginally consistent with bulges in nature. The presence of a modest () amount of gas produces systems that are better able to match observations. Star formation helps further and leads to an evolution of structural parameters parallel to their locus for observed galaxies. Secular evolution generally gives rise to nearly exponential inner profiles. Kinematically, however, the central bulge-like components of our simulations clearly fall below the locus of oblate isotropic rotators (at or above which real bulges occur in nature), reflecting the fact that they are still, fundamentally, bars.
-
5.
The amount of evolution of a density profile following bar formation depends sensitively on the Toomre- of the initial disk. When this is small, the inner disk needs to shed a large amount of angular momentum to form a bar and the central density steepens considerably. When the disk is hotter, the density change is smaller. As a result, the exponential scale-length of the disk outside the bar region depends on the initial disk kinematics. Thus, a distribution of dark matter halo specific angular momenta cannot trivially be related to a distribution of disk scale-lengths, as is often assumed.
-
6.
Angular momentum redistribution also leads to realistic breaks in the surface density of disks. The radius at which breaks occur is interior to the outer Lindblad resonance of spirals resonantly coupled to the bar. When the initial disk is hot, little angular momentum redistribution occurs and no density breaks occur; thus, secular evolution can also account for galaxies that do not exhibit any breaks. The breaks that result in these simulations are in very good agreement with observations, including not only the break radii in units of inner disk scale length but also outer scale-lengths and the difference between central surface brightnesses of the two exponentials. On the other hand, we cannot exclude that angular momentum redistribution driven by other than bars does not account for some or most of the observed breaks. In particular, spirals excited by interactions may constitute another channel by which such breaks may form; the presence of breaks in unbarred galaxies may require such a mechanism. Since our disk break formation simulations were all collisionless, we cannot address whether star formation thresholds play any role in break formation, but two results here suggest that these may not play a prominent role. First, we are able to produce disks without truncations, which models invoking star formation thresholds may have difficulty in producing. Secondly, it is clear that the breaks that do form in our simulations are quite insensitive to extent of the initial disks. The ease with which angular momentum redistribution gives rise to realistic profile breaks, together with the ability to produce also profiles without breaks, provides strong incentives for exploring such models further. Moreover, the type of angular momentum exchange we are advocating here as leading to breaks need not be necessarily driven by bars and external perturbations can also play a role. In that case, depending on the frequency of the perturbation, anti-truncations (Erwin et al. 2005) may also be possible in a unified picture.
The fraction of disks with bars is at both low (Sellwood & Wilkinson 1993) and high (Jogee et al. 2004) redshift, and this increases to at low redshift when measured via dust-penetrating infra-red observations (Knapen 1999; Eskridge et al. 2000). Since, as we show, bars are long-lived, we are forced to the conclusion that disk galaxies know at an early epoch whether or not they will form a bar and there is simply little room for continued bar formation as a function of cosmic time. Thus, secular evolution has had a long time to act on galaxies.
The results of this paper demonstrate a strong coupling between the properties and evolution of disk galaxies and their associated inner and outer morphological and structural parameters. In contrast, semi-analytic models of disk structural parameters that invoke specific angular momentum conservation miss the important effects of bar formation on disk structure. As noted in Paper I, a more nuanced analysis that takes into account secular evolution may help to alleviate discrepancies between predictions for disk galaxy structure from cosmological models (e.g. Mo et al. 1998) and observations (De Jong & Lacey 2000).
Nonetheless, secular evolution cannot account for all discrepancies between theory and observation. An example is the difficulty cosmological models have in forming bulgeless disks as extended as those observed (D’Onghia & Burkert 2004, hereafter DB04). The -body simulations of DB04 showed that halos with a quiet merging history since (which are expected to lead to bulgeless disks, but see also Springel & Hernquist [2005]) have a median with a scatter . On the other hand, van den Bosch et al. (2001) measured their observed mean at . Thus, the mean of in the cosmological simulations is more than smaller than observed. Our simulations indicate that the fraction of galaxies that form pure exponential disks must be higher (and extends to higher mass galaxies such as our own Milky Way) before secular evolution turns them into more diskbulge-like systems. However, even if all of these systems would have lower -valuess, the distribution of -values of quiet merger halos makes it unlikely that secular evolution can account for the discrepancy between predictions and observations. An interesting test of CDM will be whether enough halos with quiet merger histories form to account for a higher fraction of bulgeless galaxies.
References
- Abadi et al. (2003) Abadi, M. G., Navarro, J. F., Steinmetz, M., & Eke, V. R. 2003, ApJ, 591, 499
- Andredakis & Sanders (1994) Andredakis, Y. C., & Sanders, R. H. 1994, MNRAS, 267, 283
- Araki (1985) Araki, S. 1985 Ph.D. Thesis, Massachusetts Institute of Technology
- Athanassoula & Bureau (1999) Athanassoula, E., & Bureau, M. 1999, ApJ, 522, 699
- Balsara (1995) Balsara, D. S. 1995, Jo. Comp. Phys., 121, 357
- Bate & Burkert (1997) Bate, M. R., & Burkert, A. 1997, MNRAS, 288, 1060
- Baugh et al. (1996) Baugh, C. M., Cole, S., & Frenk, C. S. 1996, MNRAS, 283, 1361
- Benson et al. (2003) Benson, A. J., Bower, R. G., Frenk, C. S., Lacey, C. G., Baugh, C. M., & Cole, S. 2003, ApJ, 599, 38
- Berentzen (1998) Berentzen, I., Heller, C. H., Shlosman, I., & Fricke, K. J. 1998, MNRAS, 300, 49
- Binney & Tremaine (1987) Binney J., & Tremaine S. 1987, Galactic Dynamics (Princeton: Princeton University Press)
- Birnboim & Dekel (2003) Birnboim, Y., & Dekel, A. 2003, MNRAS, 345, 349
- Bournaud et al. (2005) Bournaud, F., Combes, F., & Semelin, B. 2005, MNRAS, 364, L18
- Bureau & Athanassoula (1999) Bureau, M., & Athanassoula, E. 1999, ApJ, 522, 686
- Bureau & Freeman (1999) Bureau, M., & Freeman, K. C. 1999, AJ, 118, 126
- Bullock et al. (2001) Bullock, J. S., Dekel, A., Kolatt, T. S., Kravtsov, A. V., Klypin, A. A., Porciani, C., & Primack, J. R. 2001, ApJ, 555, 240
- Carollo (1999) Carollo, C. M. 1999, ApJ, 523, 566
- Carollo et al. (2002) Carollo, C. M., Stiavelli, M., Seigar, M., de Zeeuw, P. T., & Dejonghe, H. 2002, AJ, 123, 159
- Carollo et al. (2001) Carollo, C. M., Stiavelli, M., de Zeeuw, P. T., Seigar, M., & Dejonghe, H. 2001, ApJ, 546, 216
- Carollo et al. (1998) Carollo, C. M., Stiavelli, M., & Mack, J. 1998, AJ, 116, 68
- Carollo et al. (1997) Carollo, C. M., Stiavelli, M., de Zeew, P. T., Mack, J. 1997, AJ, 114, 2366
- Cole et al. (2000) Cole, S., Lacey, C. G., Baugh, C. M., & Frenk, C. S. 2000, MNRAS, 319, 168
- Cole et al. (1994) Cole, S., Aragon-Salamanca, A., Frenk, C. S., Navarro, J. F., & Zepf, S. E. 1994, MNRAS, 271, 781
- Combes & Sanders (1981) Combes, F., & Sanders, R. H., 1981, A&A, 96, 164
- Combes et al. (1990) Combes, F., Debbasch, F., Friedli, D., & Pfenniger, D. 1990, A&A, 233, 82
- Courteau et al. (1996) Courteau, S., de Jong, R. S., & Broeils, A. H. 1996, ApJ, 457, L73
- Dalcanton et al. (1997) Dalcanton, J. J., Spergel, D. N., & Summers, F. J. 1997, ApJ, 482, 659
- Debattista et al. (2005) Debattista, V. P., Carollo, C. M., Mayer, L., Moore, B. 2005, ApJ, 628, 678 (Paper II)
- Debattista et al. (2004) Debattista, V. P., Carollo, C. M., Mayer, L., Moore, B. 2004, ApJ, 604, L93 (Paper I)
- Debattista & Sellwood (1998) Debattista, V. P., & Sellwood, J. A. 1998, ApJ, 493, L5
- Debattista & Sellwood (2000) Debattista, V. P., & Sellwood, J. A. 2000, ApJ, 543, 704
- de Grijs et al. (2001) de Grijs, R., Kregel, M., & Wesson, K. H. 2001, MNRAS, 324, 1074
- de Jong (1996) de Jong, R. S. 1996, A&A, 313, 45
- de Jong & Lacey (2000) de Jong, R. S., & Lacey, C. 2000, ApJ, 545, 781
- de Jong & van der Kruit (1994) de Jong, R. S., & van der Kruit, P. C. 1994, A&AS, 106, 451
- D’Onghia & Burkert (2004) D’Onghia, E., & Burkert, A. 2004, ApJ, 612, L13
- Elmegreen & Hunter (2005) Elmegreen, B. G., & Hunter, D. A. 2005, ApJ, in press (astro-ph/0509190)
- Erwin et al. (2005) Erwin, P., Beckman, J. E., Pohlen, M. 2005, ApJ, 626, L81
- Eskridge et al. (2000) Eskridge, P. B., Frogel, J. A., Pogge, R. W., et al. 2000, AJ, 119, 536
- Fall & Efstathiou (1980) Fall, S. M., & Efstathiou, G. 1980, MNRAS, 193, 189
- Ferrarese & Merritt (2000) Ferrarese, L., & Merritt, D. 2000, ApJ, 539, L9
- Ferguson et al. (2002) Ferguson, A. M. N., Irwin, M. J., Ibata, R. A., Lewis, G. F., Tanvir, N. R. 2002, AJ, 124, 1452
- Firmani & Avila-Reese (2000) Firmani, C., & Avila-Reese, V. 2000, MNRAS, 315, 457
- Gardner (2001) Gardner, J. P. 2001, ApJ, 557, 616
- Gebhardt et al. (2000) Gebhardt, K., et al. 2000, ApJ, 539, L13
- Gerhard (1993) Gerhard, O. E. 1993, MNRAS, 265, 213
- Governato et al. (2004) Governato, F., Mayer, L., Wadsley, J., Gardner, J. P., Willman, B., Hayashi, E., Quinn, T., Stadel, J., & Lake, G. 2004, ApJ, 607, 688
- Graham (2001) Graham, A. W. 2001, AJ, 121, 820
- Graham (2003) Graham, A. W. 2003, AJ, 125, 3398
- Hatton et al. (2003) Hatton, S., Devriendt, J. E. G., Ninin, S., Bouchet, F. R., Guiderdoni, B., Vibert, D., 2003, MNRAS, 343, 75
- Helmi et al. (1999) Helmi, A., White, S. D. M., de Zeeuw, P. T., & Zhao, H.-S. 1999, Nature, 402, 53
- Hernquist (1993) Hernquist, L. 1993, ApJS, 86, 389
- Hohl (1971) Hohl, F. 1971, ApJ, 168, 343
- Ibata et al. (1994) Ibata, R. A., Gilmore, G., Irwin, M. J. 1994, Nature, 370, 194
- Immeli et al. (2004) Immeli, A., Samland, M., Gerhard, O., & Westera, P. 2004, A&A, 413, 547
- Jimenez et al. (2003) Jimenez, R., Verde, L., & Oh, S. P. 2003, MNRAS, 339, 243
- Jog & Solomon (1991) Jog, C., & Solomon, P. M. 1991, IAUS, 146, 277
- Jogee et al. (2004) Jogee, S., Barazza, F. D., Rix, H.-W., Shlosman, I., Barden, M., Wolf, C., Davies, J., Heyer, I., Beckwith, S. V. W., Bell, E. F. et al., 2004, ApJ, 615, L105
- Katz (1992) Katz, N. 1992, ApJ, 391, 502
- Katz & Gunn (1991) Katz, N., & Gunn, J. E. 1991, ApJ, 377, 365
- Katz et al. (2003) Katz, N., Kereš, D., Davé, R., & Weinberg, D. H. 2003, in The IGM/Galaxy Connection: The Distribution of Baryons at z=0, eds. J. L. Rosenberg & M. E. Putman, Kluwer, Dordrecht, p. 185
- Kauffmann et al. (1993) Kauffmann, G., White, S. D. M., & Guiderdoni, B. 1993, MNRAS, 264, 201
- Kazantzidis et al. (2005) Kazantzidis, S., Mayer, L., Colpi, M., Madau, P., Debattista, V. P., Wadsley, J., Stadel, J., Quinn, T., Moore, B. 2005, ApJ, 623, L67
- Kereš et al. (2005) Kereš, D., Katz, N., Weinberg, D. H., Davé, R. 2005, MNRAS, 363, 2
- Klypin et al. (2002) Klypin, A., Zhao, H.-S., & Somerville, R. S. 2002, ApJ, 573, 597
- Knapen (1999) Knapen, J. H. 1999, in The Evolution of Galaxies on Cosmological Timescales, ed. J. E. Beckman, & T. J. Mahoney (San Francisco: ASP Conference Series 187), 72
- Kormendy (1993) Kormendy, J. 1993, in Galactic Bulges, ed. H. DeJonghe & H. J. Habing (Dordrecht: Kluwer Academic Publishers), 209
- Kormendy et al. (2002) Kormendy, J., Bender, R., & Bower, G. 2002, in The Dynamics, Structure & History of Galaxies, ed. G. S. Da Costa & H. Jerjen (San Francisco: ASP Conference Series 273), 29
- Kuijken & Merrifield (1995) Kuijken, K., & Merrifield, M. R. 1995, ApJ, 443, L13
- Lilly et al. (1998) Lilly, S., Schade, D., Ellis, R., Le Fevre, O., Brinchmann, J., Tresse, L., Abraham, R., Hammer, F., Crampton, D., Colless, M., Glazebrook, K., Mallen-Ornelas, G., & Broadhurst, T. 1998, ApJ, 500, 75
- Lütticke et al. (2000) Lütticke, R., Dettmar, R.-J., & Pohlen, M. 2000, A&AS, 145, 405
- Martin & Kennicutt (2001) Martin, C. L., & Kennicutt, R. C., Jr. 2001, ApJ, 555, 301
- Martinez-Valpuesta & Shlosman (2004) Martinez-Valpuesta, I., & Shlosman, I. 2004, ApJ, 613, L29
- Martinez-Valpuesta et al. (2006) Martinez-Valpuesta, I., Shlosman, I., & Heller, C. 2006, ApJ, 637, 214
- Masset & Tagger (1997) Masset, F., & Tagger, M. 1997, A&A, 322, 442
- Mayer & Wadsley (2004) Mayer, L., & Wadsley, J. 2004, MNRAS, 347, 277
- MacArthur et al. (2003) MacArthur, L. A., Courteau, S., & Holtzman, J. A. 2003, ApJ, 582, 689
- McMillan & Dehnen (2005) McMillan, P. J., & Dehnen, W. 2005, MNRAS, 363, 1205
- Merritt & Sellwood (1994) Merritt, D., & Sellwood, J. A. 1994, ApJ, 425, 551
- Mo et al. (1998) Mo, H. J., Mao, S., & White, S. D. M. 1998, MNRAS, 295, 319
- (80) Möllenhoff, C. 2004, A&A, 415, 63
- Navarro & Steinmetz (2000) Navarro, J. F., & Steinmetz, M. 2000, ApJ, 538, 477
- Navarro et al. (1996) Navarro, J. F., Frenk, C. S., & White, S. D. M. 1996, ApJ, 462, 563
- Noguchi (1999) Noguchi, M. 1999, ApJ, 514, 77
- Pérez (2004) Pérez, I. 2004, A&A, 427, L17
- Pfenniger (1984) Pfenniger, D. 1984, A&A, 134, 373
- Pfenniger & Friedli (1991) Pfenniger, D., & Friedli, D. 1991, A&A, 252, 75
- Peletier & Balcells (1996) Peletier, R. F., & Balcells, M. 1996, AJ, 111, 2238
- Pohlen & Trujillo (2006) Pohlen, M., & Trujillo, I. 2006, A&A, submitted
- Pohlen et al. (2002) Pohlen, M., Dettmar, R.-J., Lütticke, R., Aronica, G. 2002, A&A, 392, 807
- Pohlen (2002) Pohlen, M. 2002 Ph.D. Thesis, Ruhr-Universität Bochum, Germany
- Quillen (2002) Quillen, A. C. 2002, AJ, 124, 722
- Rafikov (2001) Rafikov, R. R. 2001, MNRAS, 323, 445
- Raha (1992) Raha, N. 1992 Ph.D. Thesis, University of Manchester
- Raha et al. (1991) Raha, N., Sellwood, J. A., James, R. A., & Kahn, F. D. 1991, Nature, 352, 411
- Rautiainen & Salo (1999) Rautiainen, P., & Salo, H. 1999, A&A, 348, 737
- Schaye (2004) Schaye, J. 2004, ApJ, 609, 667
- Sellwood & Debattista (2006) Sellwood, J. A., & Debattista, V. P. 2006, ApJ, in press (astro-ph/0511155)
- Sellwood & Valluri (1997) Sellwood, J. A., Valluri M. 1997, MNRAS, 287, 124
- Sellwood & Wilkinson (1993) Sellwood, J. A., & Wilkinson. A. 1993, Rep. Prog. Phys., 56, 173
- Sérsic (1968) Sérsic, J. L. 1968, Atlas de Galaxias Australes (Córdoba: Obs. Astron., Univ. Nac. Córdoba)
- Shen & Sellwood (2003) Shen, J., & Sellwood, J. A. 2004, ApJ, 604, 614
- Somerville & Primack (1999) Somerville, R. S., & Primack, J. R. 1999, MNRAS, 310, 1087
- Sommer-Larsen et al. (2003) Sommer-Larsen, J., Götz, M., & Portinari, L. 2003, ApJ, 596, 47
- Sotnikova & Rodionov (2005) Sotnikova, N. Ya., & Rodionov, S. A. 2005, Astronomy Letters, 31, 15
- Sotnikova & Rodionov (2003) Sotnikova, N. Ya., & Rodionov, S. A. 2003, Astronomy Letters, 29, 321
- Spergel et al. (2003) Spergel, D. N., et al., 2003, ApJS, 148, 175
- Springel & Hernquist (2005) Springel, V., & Hernquist, L. 2005, ApJ, 622, L9
- Springel & White (1999) Springel, V., & White, S. D. M. 1999, MNRAS, 307, 162
- Stadel (2001) Stadel J. 2001, PhD Thesis, University of Washington
- Steinmetz & Navarro (2002) Steinmetz, M., & Navarro, J. F. 2002, New Astronomy, 7, 155
- Stinson et al. (2006) Stinson, G., Seth, A., Katz, N., Wadsley, J., Governato, F., & Quinn, T. 2006, MNRAS, submitted (astro-ph/0602350)
- Sygnet et al. (1988) Sygnet, J. F., Tagger, M., Athanassoula, E., & Pellat, R. 1988, MNRAS, 232, 733
- Tagger et al. (1987) Tagger, M., Sygnet, J. F., Athanassoula, E., & Pellat, R. 1987, ApJ, 318, L43
- Terndrup et al. (1994) Terndrup, D. M., Davies, R., L., Frogel, J. A., DePoy, D. L., & Wells, L. A. 1994, ApJ, 432, 518
- Toomre (1981) Toomre, A. 1981, in Structure and Evolution of Normal Galaxies, eds Fall, S. M. & Lynden-Bell, D. Cambridge University Press
- Toomre (1964) Toomre, A. 1964, ApJ, 139, 1217
- Tremaine et al. (2002) Tremaine, S., et al. 2002, ApJ, 574, 740
- Trujillo & Pohlen (2005) Trujillo, I., & Pohlen, M. 2005, ApJ, 630, L17
- van den Bosch (2002) van den Bosch, F. C. 2002, MNRAS, 332, 456
- van den Bosch (2001) van den Bosch, F. C. 2001, MNRAS, 327, 1334
- van den Bosch (2000) van den Bosch, F. C. 2000, ApJ, 530, 177
- van den Bosch (1998) van den Bosch, F. C. 1998, ApJ, 507, 601
- van den Bosch et al. (2001) van den Bosch, F. C., Burkert, A., Swater, R. A. 2001, MNRAS, 326, 1205
- van den Bosch et al. (2002) van den Bosch, F. C., Abel, T., Croft, R. A. C., Hernquist, L., White, S. D. M. 2002, ApJ, 576, 21
- van der Kruit (1979) van der Kruit, P. C. 1979, A&AS, 38, 15
- van der Kruit & Searle (1981a) van der Kruit, P. C., & Searle, L. 1981a, A&A, 95, 105
- van der Kruit & Searle (1981b) van der Kruit, P. C., & Searle, L. 1981b, A&A, 95, 116
- van der Marel & Franx (1993) van der Marel, R. P., & Franx, M. 1993, ApJ, 407, 525
- Wadsley et al. (2004) Wadsley, J. W., Stadel, J., & Quinn, T. 2004, New Astronomy, 9, 137
- Weinberg (1985) Weinberg, M. D. 1985, MNRAS, 213, 451
- (131) Weiner, B. J., Williams, T. B., van Gorkom, J. H., & Sellwood, J. A., 2001, ApJ, 546, 916
- White & Rees (1978) White, S. D. M., & Rees, M. J. 1978, MNRAS, 183, 341