THE AGE DISTRIBUTION OF MASSIVE STAR CLUSTERS IN THE ANTENNAE GALAXIES
Abstract
We determine the age distribution of star clusters in the Antennae galaxies (NGC 4038/9) for two mass-limited samples ( and ). This is based on integrated broadband and narrowband photometry from deep images taken with the Hubble Space Telescope. We find that the age distribution of the clusters declines steeply, approximately as . The median age of the clusters is yr, which we interpret as evidence for rapid disruption (“infant mortality”). It is very likely that most of the young clusters are not gravitationally bound and were disrupted near the times they formed by the energy and momentum input from young stars to the interstellar matter of the protoclusters. At least 20% and possibly all stars form in clusters and/or associations, including those that are unbound and short-lived.
1 INTRODUCTION
The age distribution of a population of star clusters contains valuable information about the formation and disruption of the clusters. In this Letter, we present the age distribution of massive star clusters in the Antennae galaxies (NGC 4038/9), derived from multicolor images taken with the Wide Field Planetary Camera 2 (WFPC2) on the Hubble Space Telescope (HST). We have previously used these observations to determine the luminosity function, mass function, and space distribution of the clusters (Whitmore et al. 1999; Zhang & Fall 1999; Zhang, Fall, & Whitmore 2001). See Fall (2004) for an overview of this work and an early presentation of the age distribution.
The star clusters in the Antennae galaxies have attracted attention for several reasons. The Antennae are the nearest and best-studied pair of merging galaxies, consisting of two large spirals that collided and began to commingle a yr ago. The number of young clusters in this system is huge, permitting the mass, age, and space distributions to be determined better than in any other galaxies, except perhaps the Milky Way and Andromeda. The ongoing merger is almost certainly responsible in some way for this large population of clusters. Understanding the formation and disruption of clusters in this setting is important because it represents a latter-day example of the hierarchical formation of galaxies, a process that operated even more effectively in the early universe.
2 OBSERVATIONS AND AGE ESTIMATES
Our HST observations of the Antennae galaxies are described fully by Whitmore et al. (1999). The images were taken in 1996 January with the WFPC2 for 2000–4500 s with each of the broadband filters F336W (), F439W (), F555W (), and F814W (), and for 3800 s with the narrowband F658N () filter. Point-like objects (stars and clusters) were identified and their total magnitudes were measured with the IRAF task DAOPHOT. The photometry in this instrumental system was then converted to the Johnson-Cousins system using the color transformations from Holtzman et al. (1995). Approximately 11,000 objects were detected with , corresponding to at the adopted distance of 19.2 Mpc.
We estimate the age and extinction of each cluster by comparing the observed magnitudes in the five bands with those from stellar population models. From and the observed magnitude of a cluster, we then determine its extinction-corrected luminosity and position in the - plane. Specifically, we use the Bruzual & Charlot (2003) models with solar metallicity and Salpeter initial mass function, and we assume Galactic-type extinction (Fitzpatrick 1999). The best-fit values of and are those that minimize the statistic
where and are the observed and model magnitudes, respectively, and the sum runs over all five bands, , and . For the band, we include the total flux—line plus nearby continuum—in both and . This procedure avoids the large uncertainties inherent in the continuum-subtracted fluxes of clusters with little or no line emission (i.e., the differences between two nearly equal but imperfect measurements). The weight factors in the formula for are taken to be , where is the photon noise (in magnitudes) for each band, and the additional 0.05 mag of uncertainty was determined by false-object measurements in the same HST images (Whitmore et al. 1999).
Some of the ionizing photons produced by the clusters will escape from their immediate vicinity and cause H emission at locations outside our measurement aperture of radius 0.3”. We correct for this, in an average sense, by reducing the number of ionizing photons in the models by an escape fraction . The value of is determined by matching the mean predicted and observed H emission of the youngest clusters. In this way, and assuming the usual case B recombination rate, we estimate . This is similar to the value of found in studies of HII regions in the Milky Way and other galaxies in the Local Group (Terebey et al. 2003 and references therein).
We assess the reliability of our age-fitting procedure as follows. From , we compute an internal 1 error of 0.2 in . The external 1 error is larger, 0.3–0.4 in , corresponding to a factor of 2.0–2.5 in . We determine this level of accuracy by comparing the ages of 10 young clusters in the Antennae galaxies derived from our integrated photometry with independent ages of the same clusters derived from UV spectra taken with the Goddard High Resolution Spectrograph and the Space Telescope Imaging Spectrograph on HST (Whitmore 2001; R. Chandar et al. 2005, in preparation). We note that a similar external 1 error has been determined by comparing the ages of nearby clusters (in the LMC) derived from both integrated colors and main-sequence turnoffs (Elson & Fall 1988).
A more serious concern here is that the errors in some of our photometric ages have a non-random component. The integrated light from massive clusters with yr (and high metallicity) is dominated by red supergiant (RSG) stars (Leitherer et al. 1999; Bruzual & Charlot 2003). During this phase, the integrated colors change so abruptly that the fitted ages, in the presence of observational errors, become degenerate, with a strong tendency to avoid values just above yr. Fortunately, these non-random errors are also relatively small, 0.4 or less in , and they therefore have little effect on the overall shape of the age distribution when examined on scales of 0.8 or more in .
Some of the brightest clusters are spatially resolved in the HST images, but those near the limiting magnitude are indistinguishable from stars. We minimize stellar contamination in our sample of clusters by restricting it to objects brighter than all but the most luminous stars (). Since our sample is optically selected, it undoubtedly excludes some clusters that are heavily obscured by dust. However, from a comparison of the locations of radio-continuum and optical sources in the Antennae galaxies, Whitmore & Zhang (2002) estimate that the present sample of clusters is % complete.
3 AGE DISTRIBUTION
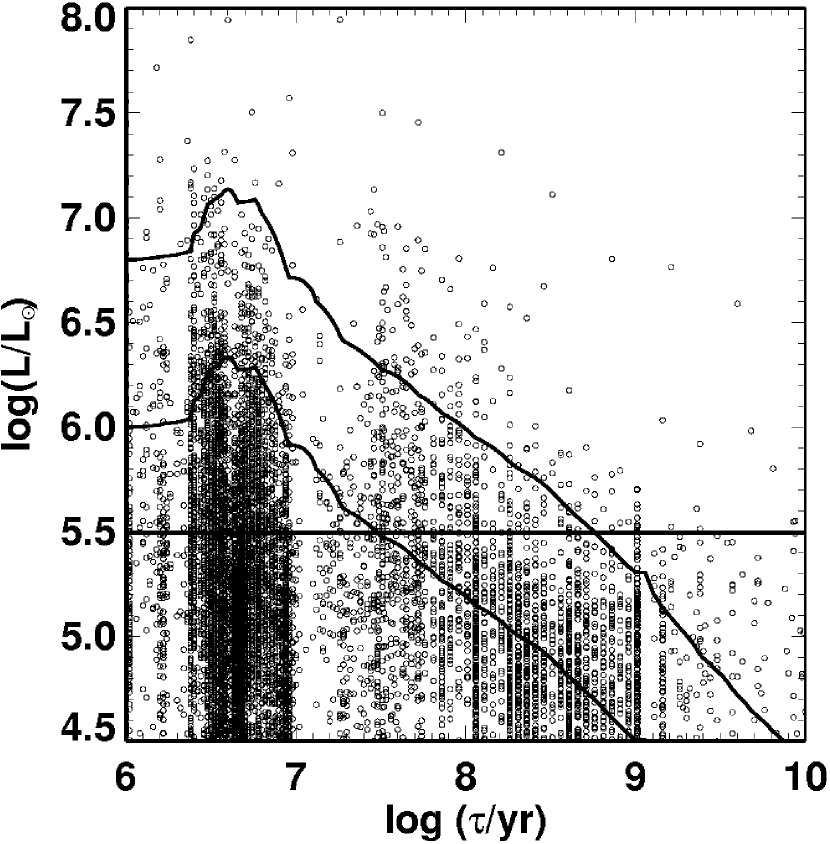
Figure 1 shows the resulting luminosity-age distribution of the clusters. This is an updated version of a similar diagram based on two reddening-free parameters derived from our photometry (Zhang & Fall 1999). The new diagram, which is based on the as well as the measurements, helps to distinguish clusters younger and older than yr, the age at which the ionizing flux from a stellar population declines rapidly. The vertical gap at yr in Figure 1 is an artifact caused by the rapid evolution of the integrated colors of clusters during the RSG phase, as discussed above. This small-scale feature, while visually prominent, has a negligible bearing on our conclusions. The diagonal lines in Figure 1 represent the evolutionary tracks of stellar population models of fixed initial mass, and . The horizontal line at is our adopted limit for stellar contamination.
Figure 1 contains much of the available statistical information about the population of star clusters in the Antennae galaxies. The luminosity function, , for example, is obtained by projecting the two-dimensional distribution horizontally along the age axis. The mass function, , is obtained by projecting instead in a diagonal direction, along the fading tracks, and counting clusters in the corresponding mass bins. This procedure yields a mass function for the young clusters ( yr) that can be approximated by a power law of the form , with over the observed range of masses, (see Fig. 2 of Fall 2004), thus confirming the earlier result of Zhang & Fall (1999).
The age distribution can be derived from Figure 1 in different ways, depending on the selection criteria of the sample. The form of usually presented in the literature is for a luminosity-limited sample, obtained simply by counting clusters in age bins above the limiting luminosity. This, however, is not straightforward to interpret in dynamical terms because it depends on the fading of the clusters by stellar evolution in addition to their formation and disruption histories. A more physically informative age distribution is that for a mass-limited sample. We obtain this form of by counting the clusters in age bins above the diagonal fading tracks in Figure 1.
Figure 2 shows the age distribution for both luminosity- and mass-limited samples of clusters.111 These age distributions include completeness corrections from Whitmore et al. (1999), but they are very similar to the corresponding distributions without corrections over the ranges of masses and ages plotted here. The former is significantly steeper than the latter because it includes a higher proportion of young clusters and a lower proportion of old clusters. In the following, we only consider results from the mass-limited samples. We find that the age distribution declines steeply, starting at very young ages, and has no obvious bend or other features. It can be approximated by a power law of the form , corresponding to , over the range yr, with little, if any, dependence on mass, at least for . This general behavior is also apparent in the - diagram (Fig. 1); there are roughly as many clusters above the diagonal fading tracks with ages in the range yr as there are in the ranges yr and yr.
Another useful way to characterize the age distribution is in terms of the median age of the clusters. For the mass-limited samples, ranking of the fitted ages gives yr. We suspect that the true median age is smaller than this, for three reasons: (1) the RSG gap in Figure 1 artificially excludes individual ages and hence values of in the range yr; (2) nearly half of the clusters in the mass-limited samples have strong H emission, indicating that they are younger than yr; and (3) incompleteness in our sample caused by dust obscuration is expected to be more severe for young clusters than for old ones. We therefore adopt, as a rough estimate, yr.
We have performed a variety of tests to determine the reliability of these results. We have repeated the entire analysis with ages derived with and without extinction corrections, with and without the measurements, and with both the Bruzual & Charlot (2003) and Leitherer et al. (1999) stellar population models. In all cases, the age distribution is very similar to that shown in Figure 2. We have also performed Monte Carlo simulations in which the input age distribution was specified, and the integrated colors of the clusters were computed from stellar population models and perturbed by random observational errors. The ages of the simulated clusters were then estimated by minimizing and the resulting output age distribution was compared with the input distribution. This again confirms the results shown in Figure 2. We conclude that the steep decline in the age distribution is robust relative to any likely errors in our analysis.
4 INTERPRETATION
The age distribution of a population of star clusters in general reflects a combination of their birth and death rates. Hence, the steep decline of in the Antennae galaxies might be interpreted as the result of a brief but intense burst of cluster formation, possibly triggered by the current interaction between the two galaxies. This, however, seems very unlikely for two reasons. First, the Antennae galaxies have been interacting for the past yr, a time much longer than the median age of the clusters, yr. Second, the age distribution is similar in different parts of the galaxies, some of which appear to be interacting more strongly than others (see Fig. 3 of Whitmore 2004). It is hard to understand how a burst of cluster formation could be synchronized so precisely over such large distances. Thus, we prefer to interpret the steep decline in the age distribution in terms of the disruption of the clusters.
The short timescale on which the clusters are disrupted indicates that most of them are not gravitationally bound. In terms of the initial characteristic radius (three-dimensional median radius) and virial velocity , the crossing time for stars orbiting within a bound cluster or protocluster is . We estimate yr for a typical young cluster with , pc, and km s-1. The crossing time is expected to be similar for clusters of different masses and radii because it depends on these quantities only through the mean density, which is determined primarily by the tidal field of the host galaxy. If a protocluster suddenly lost most of its mass by the removal of interstellar matter (ISM), it would no longer be gravitationally bound and would expand almost freely, its characteristic radius increasing with age as and its characteristic surface density decreasing as . Thus, after yr, the surface brightness of the cluster (even ignoring the fading by stellar evolution) would be roughly a factor of lower or 5 mag fainter than initially (at yr), and it would then disappear among the statistical fluctuations in the foreground and background of field stars.222The expansion of the clusters may be difficult to verify observationally because it is unlikely to be homologous; the more prominent inner cores of the clusters may expand less rapidly than the outer envelopes or may even contract as a result of stellar mass segregation. Moreover, even with HST, only the brightest clusters appear resolved.
What could cause this high rate of “infant mortality”? The gravitational binding energy of a massive cluster is only ergs, much less than the energy produced by a single massive star over its short lifetime. The energy and momentum output from massive stars comes in the form of ionizing radiation, stellar winds, jets, and supernovae. These processes could easily remove much of the ISM from a protocluster, leaving the stars within it gravitationally unbound and expanding freely as argued above, even if the cloud in which they formed was initially bound. This is the standard explanation for the expanding OB associations in the Milky Way (Hills 1980). It is also possible that parts of the protoclusters or their parent molecular clouds were never gravitationally bound. We propose that the same processes account for the steep age distribution of the massive clusters in the Antennae galaxies. It is worth noting here that these clusters are often regarded as young globular clusters.
We can understand this result as follows. The energy and momentum input to a protocluster are approximately proportional to the number of massive stars within it and hence to its mass; a protocluster with more ISM to remove has more stars to do it. Consequently, we expect the fraction of disrupted clusters to be roughly independent of their masses. This is consistent with our observations that the shape of the mass function is nearly independent of age, at least for yr, and that the shape of the age distribution is nearly independent of mass, at least for . Moreover, because the clusters are disrupted mainly by internal processes, at least initially, we expect the age distribution to be largely independent of the properties of the host galaxy. This prediction could be tested by comparing the cluster populations in different galaxies. In fact, the age distribution presented here for the clusters in the Antennae galaxies is similar to that for clusters in the solar neighborhood, albeit with very different masses (Lada & Lada 2003).
These arguments suggest that the survival of a cluster, not its disruption, may be the more difficult fact to explain. Whether a particular cluster survives may depend on “accidental” factors, such as just where and when the most massive stars happen to form within the protocluster. Indeed, the inner, dense cores of protoclusters are more likely to survive than their outer envelopes. As a result, clusters may retain some of their stars and lose others. Because the mass function of the clusters is a power law, roughly independent of age, we cannot distinguish between the case in which every cluster loses half of its mass in the first yr and the case in which half of the clusters lose all of their mass while the others lose none—or any other case between these extremes. However, we can conclude, irrespective of this ambiguity, that half of the stars that form in recognizable clusters are dispersed in the field population before they are yr old.
In this connection, it is also interesting to estimate the fraction of stars that are born within clusters and/or associations. About 20% of the total H emission in the Antennae galaxies occurs at the locations of the clusters in our sample. This is a lower limit on the fraction of stars born in clusters, for several reasons: (1) it includes only those clusters brighter than our stellar contamination limit and hence more massive than ; (2) some of the ionizing radiation from the clusters will escape from their immediate vicinity and cause H emission elsewhere; and (3) some clusters will be disrupted even before they stop producing ionizing radiation. Each of these effects alone could increase the fraction by a factor of 1–2, and together they could increase it by a factor up to 5. We conclude from this that at least 20% and possibly all stars were born in clusters and/or associations, most of which are disrupted rapidly.
The few clusters that manage to survive their infancy are subject to disruption on longer timescales by a variety of stellar dynamical processes, including dynamical friction, internal two-body relaxation, and external gravitational shocks. Of these, two-body relaxation is by far the dominant mechanism for low-mass clusters over long times ( yr). This causes the mass function of the clusters, although initially a power law, to evolve in a Hubble time into one with a peak or turnover at , similar to that of old globular clusters (Fall & Zhang 2001 and references therein). Since, as shown here, most clusters are disrupted more rapidly than this, bound, long-lived clusters account for only a tiny fraction of the total stellar population of a galaxy ( to by mass).
5 CONCLUSIONS
We have used integrated broadband and narrowband photometry from deep HST images to determine the age distribution of star clusters in the Antennae galaxies for two mass-limited samples ( and ). From this, we draw the following conclusions:
1. The age distribution of the clusters declines steeply, approximately as .
2. The median age of the clusters is yr, which we interpret as evidence for rapid disruption (“infant mortality”).
3. It is very likely that most of the young clusters are not gravitationally bound, and were disrupted near the times they formed by the energy and momentum input from young stars to the ISM of the protoclusters.
4. At least 20% and possibly all stars form in clusters and/or associations, including those that are unbound and short-lived.
References
- (1) Bruzual, G., & Charlot, S. 2003, MNRAS, 344, 1000
- (2) Elson, R. A. W., & Fall, S. M. 1988, AJ, 96, 1383
- (3) Fall, S. M. 2004, in The Formation and Evolution of Massive Young Star Clusters, ed. H. J. G. L. M. Lamers, L. J. Smith, & A. Nota (San Francisco: ASP), 399 (also astro-ph/0405064)
- (4) Fall, S. M., & Zhang, Q. 2001, ApJ, 561, 751
- (5) Fitzpatrick, E. L. 1999, PASP, 111, 63
- (6) Hills, J. G. 1980, ApJ, 225, 986
- (7) Holtzman, J. A., Burrows, C. J., Casertano, S., Hester, J. J., Trauger, J. T., Watson, A. M., & Worthey, G. 1995, PASP, 107, 1065
- (8) Lada, C. J., & Lada, E. A. 2003, ARA&A, 41, 57
- (9) Leitherer, C. et al. 1999, ApJS, 123, 3
- (10) Terebey, S., Fich, M., Taylor, R., Cao, Y., & Hancock, T. 2003, ApJ, 590, 906
- (11) Whitmore, B. C. 2001, in Astrophysical Ages and Time Scales, ed. T. von Hippel, C. Simpson, & N. Manset (San Francisco: ASP), 411
- (12) Whitmore, B. C. 2004, in The Formation and Evolution of Massive Young Star Clusters, ed. H. J. G. L. M. Lamers, L. J. Smith, & A. Nota (San Francisco: ASP), 419 (also astro-ph/0403709)
- (13) Whitmore, B. C., & Zhang, Q. 2002, AJ, 124, 1418
- (14) Whitmore, B. C., Zhang, Q., Leitherer, C., Fall, S. M., Schweizer, F., & Miller, B. W. 1999, AJ, 118, 1551
- (15) Zhang, Q., & Fall, S. M. 1999, ApJ, 527, L81
- (16) Zhang, Q., Fall, S. M., & Whitmore, B. C. 2001, ApJ, 561, 727