Evidence for Gravitational Infall of Matter onto the Super-Massive Black Hole in the quasar PG 1211+143?
Abstract
We report the detection of redshifted iron K absorption lines in the Chandra LETG spectrum of the narrow-line quasar, PG 1211+143. The absorption lines are observed at 4.22 keV and 4.93 keV in the quasar spectrum, corresponding to 4.56 keV and 5.33 keV in the rest frame of PG 1211+143. From Monte Carlo simulations, the chance probability of both lines being false detections is low at . Highly redshifted ionized iron K (Fe xxv or Fe xxvi) is the most plausible identification for the lines at their observed energies. If identified with H-like iron K at 6.97 keV, then the relativistic velocity shifts required are 0.40c and 0.26c. The extreme velocities can be explained by pure gravitational redshift if the matter exists in a stable orbit within 6 gravitational radii of the black hole. This would require a Kerr metric for the black hole. Alternatively the absorption may be the result of matter infalling directly onto the black hole, with a maximum observed velocity of 0.38c at in the Schwarzschild metric. This matter may originate in a failed outflow or jet, which does not escape the gravitational potential of the black hole.
1 Introduction
One prime motivation of high energy research into Active Galactic Nuclei is to find evidence for the putative massive black hole, through the gravitational redshift imparted on photons emerging within a few gravitational radii of the event horizon. To date, most of the effort has focused on the iron K emission line, predicted to show a relativistically broadened profile (Fabian et al., 1989; Laor, 1991), which appeared to be common among Seyfert 1 galaxies, as observed by ASCA (Tanaka et al., 1995; Nandra et al., 1997). However the situation emerging from the newer XMM-Newton and Chandra data is more ambiguous, the spectra showing that narrower (non-relativistic) lines are commonplace (Yaqoob & Padmanabhan, 2004). Indeed the red-wing of the broad iron line is often hard to distinguish from the effects of the warm absorber (Reeves et al., 2004; Turner et al., 2005a).
Given the ambiguity in modeling the broad iron line, additional diagnostics of the inner disk material are needed. Narrow, transient and redshifted iron emission lines of modest statistical significance have recently been claimed in several AGN (Turner et al., 2002; Dovciak et al., 2004; Porquet et al., 2004) possibly originating from local hot-spots on the disk surface. Potentially these lines can be tracked to reveal orbital motions in the inner disk (Dovciak et al., 2004; Turner et al., 2005b). However little evidence has been found to date for infall of matter onto the black hole. In this paper, we present evidence of highly redshifted iron K absorption lines in the narrow-line Seyfert 1, PG 1211+143 with Chandra LETG. This may either be interpreted as infall onto the massive black hole, or gravitational redshift occurring within of a Kerr black hole. PG 1211+143 (at z=0.0809) is a prototypical ‘Big Blue Bump’ quasar, and one of the brightest AGN in the soft X-ray band (Walter & Fink, 1993). A previous XMM-Newton observation of PG 1211+143 showed blue-shifted absorption from a high velocity () outflow (Pounds et al., 2003). The soft X-ray properties of PG 1211+143, which confirm the blue-shifted absorber, will be presented in a subsequent paper. Values of H0=70 km s-1 Mpc-1, =0.0 and are assumed and errors are quoted at 90% confidence (), for 1 parameter of interest.
2 Chandra and XMM-Newton Observations of PG 1211+143
PG 1211+143 was observed by Chandra with the Low Energy Transmission Grating (LETG) in 3 consecutive orbits between 21 June 2004 and 26 June 2004 of approximately 45 ks exposure per orbit (see Table 1). An XMM-Newton observation was conducted simultaneously with the first Chandra orbit, but due to high and variable background, this was reduced to only 20 ks useful exposure. The ACIS-S detector was used on the focal plane, with the S3 chip being at the telescope aimpoint. Chandra LETG source spectra, background spectra and response matrices were generated using CIAO 3.2.1. Streaks were removed from the ACIS-S CCD array, while events with grades 0, 2, 3, 4, and 6 were selected. After screening an exposure of 133.6 ks was obtained. Spectra and responses from the orders were extracted and combined to maximize signal to noise. The time-averaged combined first order LETG count rate was 0.31 counts s-1. Data from the zeroth order image were not used, due to photon pile-up. The 1st order spectra were binned so that one bin represents the FWHM resolution of the LETG (), ensuring sufficient counts per bin to use the minimization spectral fitting technique.
3 LETG Spectral Analysis
To parameterize the X-ray continuum, the LETG spectrum was fitted with a broken power-law model, modified by neutral Galactic absorption of cm-2 (Dickey & Lockman, 1990), over the 0.4-8.0 keV bandpass. The soft and hard X-ray photon indices, break energy and model normalization were allowed to vary; the best fit values are , , break energy keV and normalized flux of photons keV-1 cm-2 s-1 (at 1 keV). The integrated flux is erg cm-2 s-1 (0.4-8 keV), corresponding to an unabsorbed X-ray luminosity of erg s-1. The spectral fit obtained is formally unacceptable, with (dof=degrees of freedom) for a rejection probability of . This is due to several ionized emission and absorption lines (e.g. from O, Ne) below 1 keV, although the continuum is fitted well above 2 keV. A subsequent paper will describe the soft X-ray spectrum of PG 1211+143 obtained with the LETG (Reeves et al. 2005, in preparation).
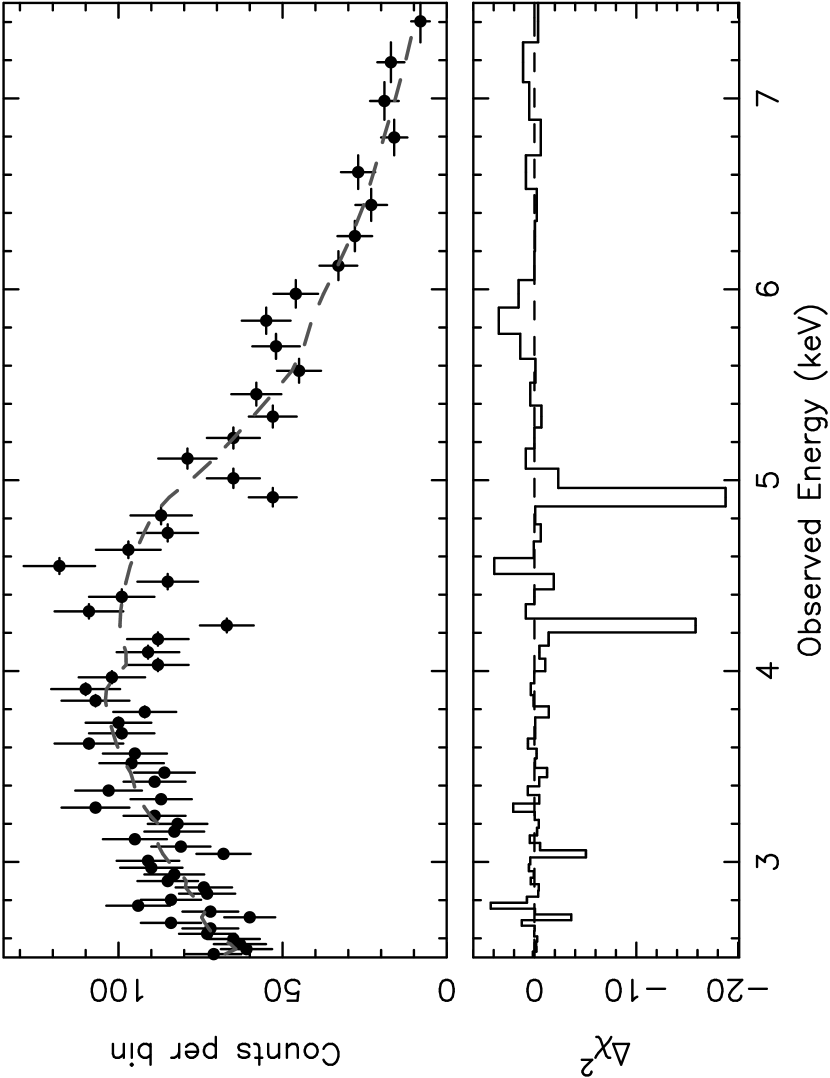
In this paper we concentrate on the spectrum in the iron K band above 2 keV. A single power-law model provides an adequate fit to the continuum above 2 keV, with a photon index of . The fit statistic obtained is , which is marginally acceptable (the rejection probability is ). Figure 1 shows the LETG counts spectrum above 2 keV, the lower panel showing the residuals of the data compared to the continuum model. Each bin represents the FWHM resolution of the LETG. Two strong negative deviations that contribute significantly towards the total are observed near 4.2 and 4.9 keV, due to two absorption lines in the PG 1211+143 spectrum. To test this, two unresolved ( eV) Gaussian absorption lines were added to the continuum model. A significant improvement in the spectral fit was obtained (), with addition of two absorption lines at keV and keV (observed frame) with equivalent widths of eV and eV. The improvement in fit statistic upon adding each line was and respectively, while the overall fit statistic is now acceptable.
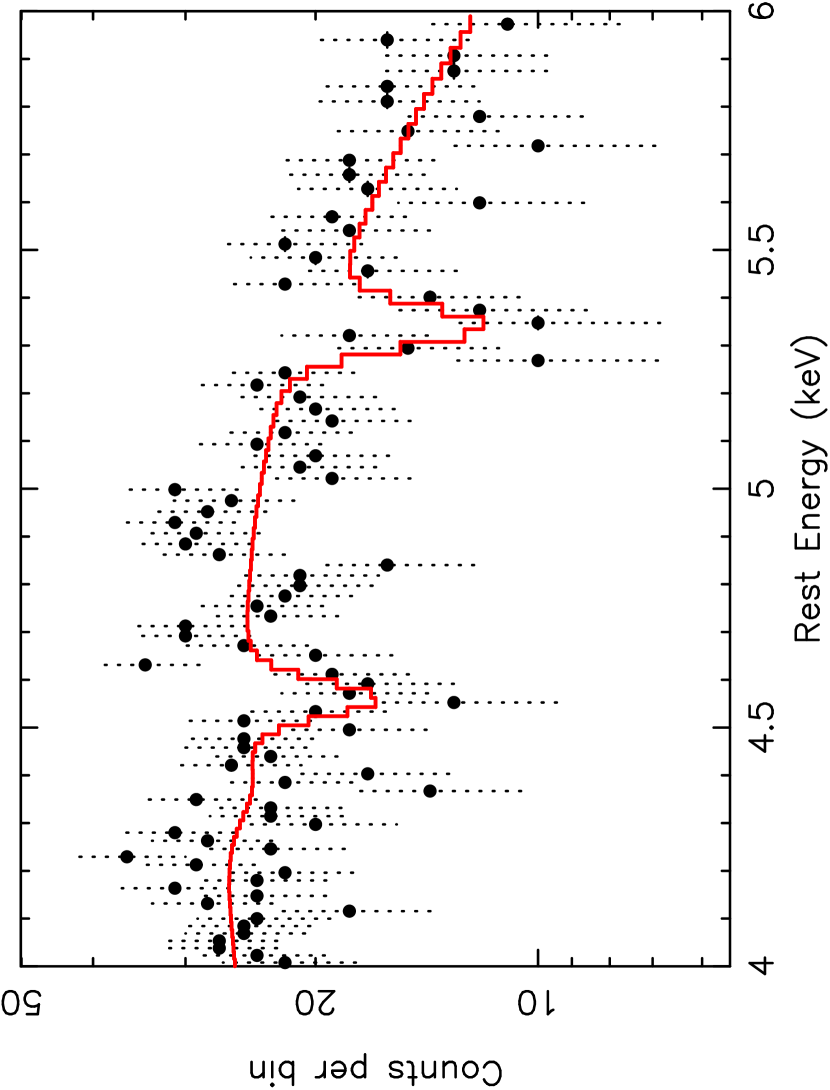
To constrain the width of the two absorption lines, the LETG spectrum was rebinned to their maximum resolution, with each bin representing 1/4 FWHM resolution of the LETG ( Å or eV at 4 keV). The rest-frame spectrum at this resolution near the absorption lines is shown in Figure 2. The spectral fit was minimized using the C-statistic (Cash, 1979), due to the lower number of counts per bin at this resolution. The best fit width is eV (at 4.9 keV), corresponding to a FWHM velocity of km s-1. However the line width is poorly constrained, the 90% upper limit being km s-1. The variability of the absorption lines was tested by comparing the LETG spectra across all three Chandra orbits. The first LETG orbit was simultaneous with XMM-Newton, so the LETG and EPIC-pn spectra were fitted jointly. The results are shown in Table 1, while the C-statistic was used to minimize the spectral fits. The 4.2 and 4.9 keV lines are only formally detected during the 2nd orbit, although orbits 2 and 3 are statistically consistent. The lines do appear to vary in equivalent width between orbits 1 and 2 at confidence.
3.1 Statistical Significance of the Absorption Lines
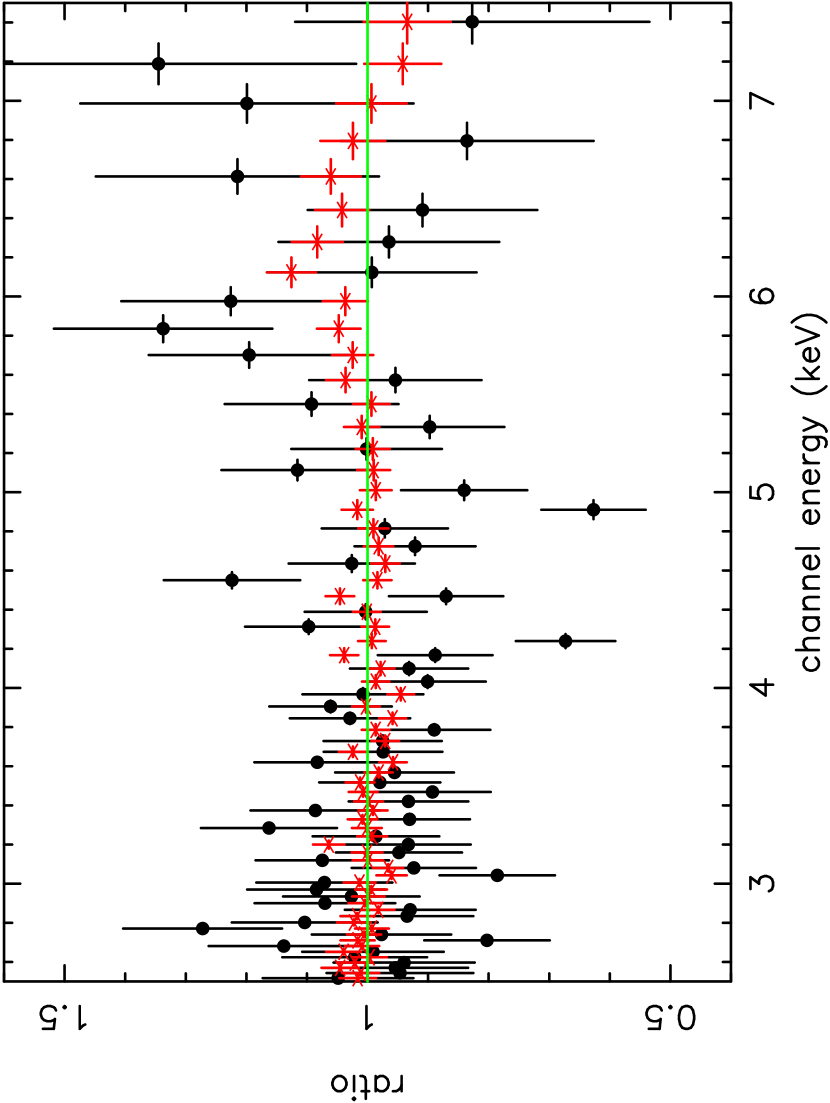
In order to check that the absorption is not due to calibration effects, the PG 1211+143 spectrum was compared to all the archived LETG observations of 3C 273. No residuals are present in the summed or individual 3C 273 spectra near the line energies 4.22 keV and 4.93 keV (Figure 3). The limit on the equivalent width of any absorption lines is eV in the summed spectrum. The source and background spectral extraction regions of PG 1211+143, in each of the three Chandra orbits, were also inspected. No anomalous pixels or rows were observed in the CCD array and no background sources were present within the extraction regions. The separate order spectra of PG 1211+143 were also found to be consistent. Thus the lines are not due to systematic or calibration effects in the LETG.
In order to assess the statistical significance of the lines, we wish to determine the chance probability of falsely detecting two lines, over an energy band of interest. In order to estimate this, 1000 LETG spectra were simulated, under the null hypothesis assumption that the spectrum consists of a broken power-law continuum from 0.4-8.0 keV, with no spectral lines. The distribution of values obtained by fitting a single Gaussian line to each of the 1000 spectra simulated in the null hypothesis case can then be compared to the measured in the real dataset to calculate the false probability of detection (Porquet et al., 2004). The 1st order LETG spectra were simulated using identical continuum parameters and exposure as in the real PG 1211+143 dataset and binned at the FWHM resolution of the LETG. A single narrow Gaussian line (either in absorption or emission) was added to the continuum model and then fitted to each simulated spectrum. The line energy was stepped in increments of one FWHM resolution bin over the 3–7 keV band and the simulated spectrum was re-fitted at each increment to minimize . The minimum obtained from adding the line to the spectral fit was compared to the obtained for the continuum model alone for each spectrum, in order to compute the distribution of versus probability for all 1000 simulated spectra. The 3–7 keV band was chosen for the line search as it is most likely that a strong iron K line will be observed over this energy range; i.e. keV is outside the iron K band-pass for any feasible redshift, while the LETG has little effective area above 7 keV. The improvement in fit statistic obtained for adding the two lines to the actual dataset was and for each line. The simulations show that the false probability of detecting a line with equal or greater is 0.034 and 0.004 for the 4.2 and 4.9 keV lines respectively. The probability of both lines being false detections is the product of these probabilities, which is .
As an independent check, we calculate the line significances using the actual errors on the fitted parameters. The absorption line fluxes at 4.2 and 4.9 keV are photons cm-2 s-1 and photons cm-2 s-1 respectively, while the continuum fluxes at these energies are photons cm-2 s-1 keV-1 and photons cm-2 s-1 keV-1. The equivalent widths of the lines are then eV and eV respectively. The errors are values and the line flux and continuum errors have been propogated. Thus the two absorption lines are significant at and , with corresponding null probabilities of and . However these are single trial probabilities for a line at an a-priori known energy. Taking into account the number of bins searched for line features in the 3-7 keV range, then the null detection probability will be , where is the single trial probability from above. As there are 48 resolution bins in the 3-7 keV range, the null probabilities for the 4.2 and 4.9 keV lines are 0.022 and 0.0067 respectively, in excellent agreement with the Monte-Carlo estimates.
4 Discussion
Two absorption lines are observed at 4.22 and 4.93 keV in the PG 1211+143 LETG spectrum, with a low probability that both are false detections. Although the lines are likely to be associated with redshifted Fe K, we first consider whether the lines could originate from other elements at lower velocities. The absorption line rest frame energies are keV and keV. The closest transitions to those energies are Sc xxi K (at 4.53 keV) or V xxiii (5.43 keV) respectively. The abundances of Sc or V are extremely low, less than Fe. Even if the abundances of were enhanced through spallation of iron nuclei by energetic protons on the disk surface (Skibo, 1997), the strengths of these lines would still be considerably weaker () than due to Fe K. One other possibility is that the absorption originates from lower Z elements such as Si, S or Ca in a relativistic outflow. Blue-shifted lines with have been detected in PG 1211+143 in a previous XMM-Newton observation by Pounds et al. (2003). In this case Ca xx at 4.10 keV would appear the most reasonable identification for the lower energy line, requiring an outflow velocity of 32000 km s-1. However the Ca xx line is still likely to be weak, as the abundance ratio is (Anders & Grevesse, 1989). Si or S are more abundant than Ca, however if the lines originate from Si xiv K and S xvi K, then the outflow velocities are 0.68c and 0.62c respectively. The kinetic power of such a fast flow would be a factor of greater than calculated by Pounds et al. (2003), probably exceeding erg s-1 and the bolometric output of the quasar. Such a highly energetic flow seems implausible, unless the opening angle of the outflow is small.
The most likely scenario is that the lines originate from highly redshifted iron K. Indeed there have been a small number of previous claims of redshifted Fe K absorption lines in other AGN. Nandra et al. (1999) first claimed the possibility of redshifted iron K-shell absorption, through ASCA observations of the Seyfert 1 NGC 3516. However recent Chandra and XMM-Newton observations (Turner et al., 2002) have showed that this is probably due to a strong narrow K core at 6.4 keV and variable emission lines at keV. Other claimed examples include a 6.2 keV line in the quasar 1E 1821+643 with Chandra HETG (Yaqoob & Serlemitsos, 2005) and a weak redshifted line in the quasar Q 0056-363 (Matt et al., 2005). Most recently the detection of transient redshifted Fe absorption lines in Mrk 509 was claimed in Beppo-SAX data, with a velocity shift of (Dadina et al., 2005).
If the lines in PG 1211+143 correspond to H-like iron (i.e. Fe xxvi K at 6.97 keV) then the redshifted velocities are 0.26c and 0.40c, while if the lines correspond to He-like iron (Fe xxv K resonance at 6.70 keV), the velocities are 0.22c and 0.37c. Note that the separation of the two lines requires two distinct velocity components, as the higher order Fe K lines are undetectable in this spectrum. It is unlikely that the lines result from a lower ionization than Fe xxv, as then a series of strong L-shell Fe lines and edges would be detected at lower energies, which is not the case. Furthermore the absorption lines cannot be from near neutral Fe (Fe i-xvii) at 6.4 keV, because no strong K absorption line would be observed, as the L-shell would be fully populated.
The two possible causes for the relativistic shifts are either gravitational redshift of photons near the massive black hole or infall of matter onto the black hole. In the former scenario, the absorbing matter would have to be located at and respectively from a Schwarzschild black hole (where is one gravitational radius). This is within the last stable orbit around a Schwarzschild black hole and requires a Kerr metric (Thorne, 1974) for the matter to exist in a stable orbit within . For a maximal pole-on Kerr black hole, the radii derived are then and respectively. Alternatively, the matter may be infalling onto the black hole, in which case a maximum velocity of (in the frame of the observer) can be achieved at for a Schwarzschild metric.
Modeling the two absorption line systems with Xstar (Kallman et al., 1996), requires a large column density of cm-2 (assuming a turbulence of km s-1 and solar abundances). The ionization parameter is log erg cm s-1, with most of the absorption arising from Fe xxvi K. The equivalent column density of Fe xxvi is cm-2, while the optical depth at the K-shell edge is , i.e. the matter is optically-thin to the continuum. The velocity of the two absorption systems are and , while the line of sight covering fraction is %. From the above parameters we can derive the physical properties of the gas. A black hole mass of is assumed (Kaspi et al., 2000), an ionizing luminosity of erg s-1 and a radial distance of cm (i.e. a few ). The ionization parameter is defined as (n is the electron density), while one can define a filling factor as . A density of cm-3 is calculated, with a filling factor of 1% and a cloud size of cm. Note that these should be considered order of magnitude estimates, due to the uncertainties in and black hole mass. The matter may be clumped, perhaps from density perturbations on the disk or from localized filaments within the infalling matter.
A fast outflow of has already been detected in an earlier XMM-Newton observation of PG 1211+143 (Pounds et al., 2003) which is confirmed from the analysis of the soft X-ray LETG data (Reeves et al. 2005, in preparation). One possibility is that part of this outflow does not escape the gravitational potential of the black hole (Murray & Chiang, 1998; Proga, Stone, & Kallman, 2000). If material is launched with in PG 1211+143, then matter within a radius of may not escape the system. Thus it is possible to produce both red and blue-shifted lines in PG 1211+143, indeed in Mrk 509 both inflow and outflow also appear to be present (Dadina et al., 2005). From above, the mass infall rate required is g s-1 or yr-1. The kinetic power is then a few erg s-1 for an infall velocity of . Interestingly this is similar to the X-ray luminosity of PG 1211+143. Indeed a similar “aborted jet” model has been proposed by Ghisellini Haardt & Matt (2004), where matter in an outflow or jet fails to escape the gravitational potential well. The hard X-ray emission can be produced by shocks and collisions within the flow.
Alternatively the absorption may originate from matter near the highly ionized inner disk surface, with the redshift being largely gravitational in origin. Ruszkowski & Fabian (2000) proposed such a model to explain the absorption line in NGC 3516, although the lines will be broad unless the matter is clumped. Monitoring the line variability will help to reveal its origin, for instance it may possible to track the infall of a dense clump of matter towards the black hole. This bodes well for future longer observations of PG 1211+143, with XMM-Newton or Chandra, to track the line variability. Regardless of the mechanism, the large redshift and high covering fraction imply that most of the X-ray emission in PG 1211+143 originates from a compact region within a few of the black hole.
References
- Anders & Grevesse (1989) Anders, E., & Grevesse, N. 1989, Geochimica et Cosmochimica Acta, 53, 197
- Cash (1979) Cash, W. 1979, ApJ, 228, 939
- Dadina et al. (2005) Dadina, M., Cappi, M., Malaguti, G., Ponti, G., & De Rosa, A. 2005, A&A, in press
- Dickey & Lockman (1990) Dickey, J.M. & Lockman, F.J., 1990, ARA&A, 28, 215
- Dovciak et al. (2004) Dovciak, M., Bianchi, S., Guainazzi, M., Karas, V., & Matt, G. 2004, MNRAS, 350, 745
- Fabian et al. (1989) Fabian, A.C., Rees, M.J., Stella, L., & White, N.E. 1989, MNRAS, 238, 729
- Ghisellini Haardt & Matt (2004) Ghisellini, G., Haardt, F., & Matt, G. 2004, A&A, 413, 535
- Kallman et al. (1996) Kallman, T.R., Liedahl, D., Osterheld, A., Goldstein, W., & Kahn, S. 1996, ApJ, 465, 994
- Kaspi et al. (2000) Kaspi, S., Smith, P.S., Netzer, H., Maoz, D., Jannuzi, B.T., & Giveon, U. 2000, ApJ, 533, 631
- Laor (1991) Laor, A. 1991, ApJ, 376, L90
- Matt et al. (2005) Matt, G., Porquet, D., Bianchi, S., Falocco, S., Maiolino, R., Reeves, J.N., & Zappacosta, L. 2005, A&A, 435, 857
- Murray & Chiang (1998) Murray, N., & Chiang, J. 1998, ApJ, 494, 125
- Nandra et al. (1999) Nandra, K., George, I.M., Mushotzky, R.F., Turner, T.J., & Yaqoob, T. 1999, ApJ, 523, L17
- Nandra et al. (1997) Nandra, K., George, I.M., Mushotzky, R.F., Turner, T.J., & Yaqoob, T. 1997, ApJ, 477, 602
- Porquet et al. (2004) Porquet, D., Reeves, J.N., Uttley, P., & Turner, T.J. 2004, A&A, 427, 101
- Pounds et al. (2003) Pounds, K.A., Reeves, J.N., King, A., Page, K., O’Brien, P.T., & Turner, M.J.L. 2003, MNRAS, 345, 705
- Proga, Stone, & Kallman (2000) Proga, D., Stone, J.M., & Kallman, T.R. 2000, ApJ, 543, 686
- Reeves et al. (2004) Reeves, J.N., Nandra, K., George, I.M., Pounds, K.A., Turner, T.J., & Yaqoob, T. 2004, ApJ, 602, 648
- Ruszkowski & Fabian (2000) Ruszkowski, M., & Fabian, A.C. 2000, MNRAS, 315, 223
- Skibo (1997) Skibo, J.G. 1997, ApJ, 478, 522
- Tanaka et al. (1995) Tanaka, Y., et al. 1995, Nature, 375, 659
- Thorne (1974) Thorne, K.S. 1974, ApJ, 191, 507
- Turner et al. (2005a) Turner, T.J., Kraemer, S.B., George, I.M., Reeves, J.N., & Bottorff, M.C. 2005, ApJ, 618, 155
- Turner et al. (2005b) Turner, T.J., Miller, L., George, I.M., & Reeves, J.N. 2005, A&A, in press
- Turner et al. (2002) Turner, T.J., et al. 2002, ApJ, 574, L123
- Walter & Fink (1993) Walter, R., & Fink, H.H. 1993, A&A, 274, 105
- Yaqoob & Serlemitsos (2005) Yaqoob, T., & Serlemitsos, P. 2005, ApJ, 623, 112
- Yaqoob & Padmanabhan (2004) Yaqoob, T., & Padmanabhan, U. 2004, ApJ, 604, 63
| Parameter | Mean | Obs1 | Obs2 | Obs3 |
|---|---|---|---|---|
| DateaaStart date and time (in UT) for observation. | 21/06/2004 | 21/06/2004 | 23/06/2004 | 25/06/2004 |
| TimeaaStart date and time (in UT) for observation. | 03:09:04 | 03:09:04 | 03:57:43 | 18:30:27 |
| ExposurebbExposure time in ks. | 133.6 | 42.7 | 48.2 | 42.7 |
| ccPhoton index above 2 keV. | ||||
| F2-10dd2-10 keV flux in units ergs cm-2 s-1. | 6.1 | 4.0 | 6.6 | 7.3 |
| EnergyeeObserved line energy in keV. | 4.22ffDenotes model parameter is fixed in fit. | 4.22ffDenotes model parameter is fixed in fit. | ||
| EWggAbsorption line equivalent width in eV. | ||||
| EnergyeeObserved line energy in keV. | 4.93ffDenotes model parameter is fixed in fit. | 4.93ffDenotes model parameter is fixed in fit. | ||
| EWggAbsorption line equivalent width in eV. |