SGRS J05158100: a Fat-Double giant radio galaxy
Abstract
We present here the first detailed study of a giant radio galaxy of the Fat-Double type. The lobes of the double radio galaxy SGRS J05158100 have transverse widths that are 1.3 times their extent from the center, their surface brightness is the lowest among known giant radio sources and the lobes have relatively steep radio spectra. We infer that these wide lobes were created as a result of a highly variable and intermittent jet whose axis direction also varied significantly: the Fat-Double lobes in this giant radio source are a result of the ejection and deposition of synchrotron plasma over a wide range of angles over time rather than the expansion of relic lobes. Additionally, the optical host shows evidence for an ongoing galaxy-galaxy interaction. SGRS J05158100 supports the hypothesis that interactions with companions might perturb the inner accretion disk that produces and sustains the jets at the centers of active galactic nuclei. As a result, it appears unnecessary to invoke black-hole coalescence to explain such morphologies, implying that the corresponding event rates predicted for gravitational wave detectors may be overestimates.
1 Introduction
The interaction between jets of relativistic plasma—that are generated in inner accretion disks of active galactic nuclei—and the ambient gaseous environment creates the synchrotron emitting lobes of powerful radio sources. The giant radio sources are possibly powered by central engines with the longest lifetimes; therefore, they are potentially probes of the long time history of the nuclear jet stability. With linear size exceeding 1 Mpc, the giant radio sources have sound crossing times exceeding 6 Myr; however, spectral aging arguments lead to radiative ages of order 0.1 Gyr and dynamical arguments suggest ages that are an order of magnitude larger. Post starburst stellar populations in radio galaxies have ages 0.5–2.5 Gyr (Tadhunter et al., 2005) consistent with dynamical ages. If the jets vary in power or direction, or if they undergo interruptions over these long timescales, the structures of giant radio galaxies might be expected to show evidence. Not surprisingly, the morphologies of giant radio sources do indeed show evidence for temporal variations in jet power (Subrahmanyan et al., 1996). More recently, detailed radio imaging of giant radio galaxies have yielded some spectacular examples where new jets created in a new epoch of central engine activity are observed to be ploughing through relatively relaxed lobes that were presumably deposited in the past (see, for example, Saripalli et al. (2002) and Saripalli et al. (2003)). The cause for interruptions to the jet might be instabilities in the jet production mechanism, instabilities in the accretion disk, or interruptions to the fuelling of the central engine.
The examples of recurrent activity in giants studied to date have been almost exclusively cases where the jet axis has remained essentially unaltered in the multiple activity phases. S- and X-shaped giant radio sources—which are usually interpreted as cases where the jet axis has varied significantly over time—are extremely rare, consistent with the hypothesis that long timescale stability in the axis might be necessary for the creation of giant Mpc-size radio sources (Subrahmanyan et al., 1996). In this model, giant radio galaxies would not be expected to manifest Fat-Double structure, unless the wide lobes result from transverse expansion in the relic phase after the jets from the central engine switched off.
The evolution of the synchrotron lobes of radio galaxies after the jets cease has important implications for our understanding of their dynamical interaction with the ambient medium. Constraints on models for the dynamical evolution of the relics, together with statistics of the occurrence of relics in complete samples of radio sources, translate into constraints on dynamical ages of active radio sources and, therefore, on the stability and timescale of the nuclear activity and associated fuelling. Additionally, understanding the evolution of relic giant radio sources has implications for the physical properties of the intergalactic medium (IGM) that is not directly observable with the limited sensitivity of present day X-ray telescopes. The activity lifetimes and the disappearance rate of extended extragalactic sources are the parameters defining the injection rate for relativistic plasma and magnetic fields into the IGM. Less than 3% of all double radio sources are relics in existing surveys (Giovannini et al., 1988) and their rarity is an enigma that is a reflection of our lack of understanding of the end stages of the radio source phenomenon and how radio sources exit the observable parameter space.
In the Sydney University Molonglo Sky Survey (SUMSS; Bock et al. (1999)), SGRS J05158100 appeared to be a close pair of low-surface-brightness emission regions that were 3–5 arcmin in size and with their centers separated by about . Followup observations indicated that the source is a giant radio galaxy with an unusual Fat-Double structure: the source was included in the compilation of southern giant radio sources made by Saripalli et al. (2005). SGRS J05158100 appears to be a rare example of a giant radio galaxy in which there has not only been significant variations in jet continuity but also significant variations in the direction of the jet axis. Additionally, the optical host displays evidence of an ongoing interaction/merger. Because this source is a rare type with implications for the stability in the nuclear jets, formation of giant radio galaxies and for the end stages of the evolution of relic lobes in an IGM environment, we present here a case study of SGRS J05158100. A journal of the followup observations is in Table 1.
2 Radio observations
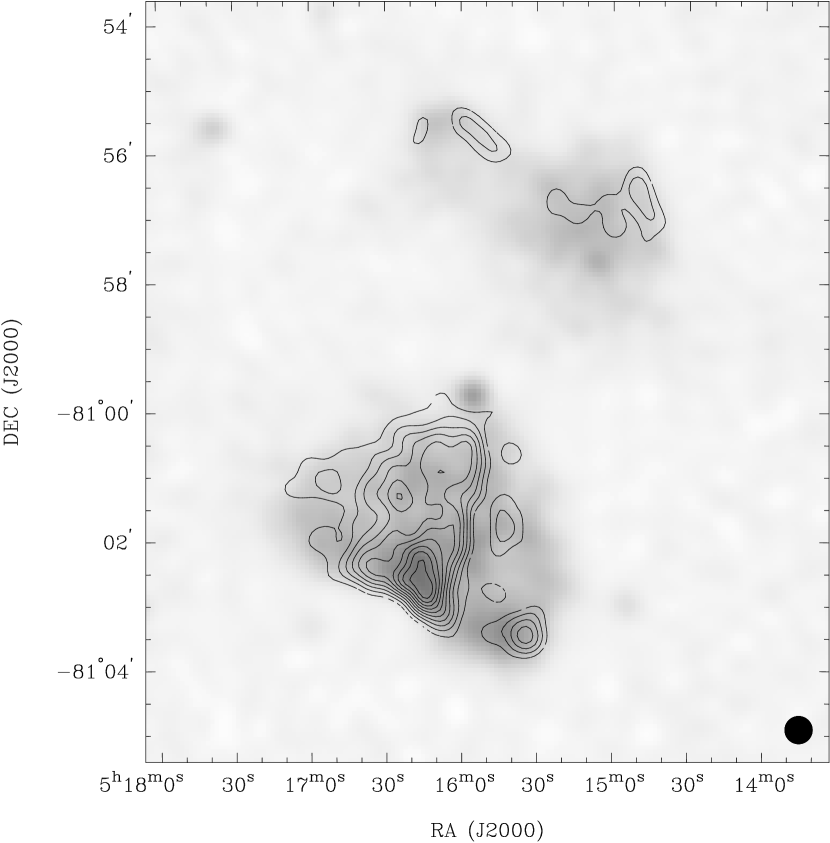
The Molonglo Observatory Synthesis Telescope (MOST) was used to make a 36-cm wavelength image of a field centered on SGRS J05158100. Contours of this radio image made with a beam of full width at half maximum (FWHM) at position angle (P.A.) are shown in Fig. 1 overlaid on a SuperCOSMOS digitization of a UKST blue optical image. The radio image has an rms noise of 0.5 mJy beam-1.
The radio source was subsequently imaged with the Australia Telescope Compact Array (ATCA) at 12 and 22 cm wavelengths from visibility data obtained in the 210 and 375 m configurations, as well as the longer 1.5A and 6C arrays that provide baselines up to 6 km. The flux density scale was set using observations of PKS B1934638 whose flux density was adopted to be 11.1 and 14.9 Jy respectively at 12 and 22 cm. The interferometer data were calibrated and imaged using MIRIAD: multi-channel continuum data were imaged using standard bandwidth-synthesis techniques. The images were first partially deconvolved using the Clark algorithm (Clark, 1980) to remove the effects of unresolved components and then the low-surface-brightness extended emission was deconvolved using the Steer-Dewdney-Ito algorithm (Steer et al., 1984). The 22-cm image of the source, made with a beam of FWHM, is shown in Fig. 2; the rms noise in the image is 0.05 mJy beam-1. The 12-cm image of the source made with the same beam is shown in Fig. 3; here the rms noise is 0.08 mJy beam-1.
The radio images show a pair of disjoint radio lobes with no evidence for any connecting bridge emission. Both lobes are wider in their transverse extents as compared to their axial lengths. The optical host for the double radio source is likely to be the = 17.2 galaxy that appears at a location close to the center of the radio source on the sky and at the northern end of the southern lobe.
When the radio source was reconstructed using the longer 1.5A and 6C array visibilities, and a higher resolution image with beam FWHM at P.A. was made at 12 cm wavelength, two compact unresolved components appear within the sky area spanned by the double radio source. The first, at RA: 05h15m551, DEC: 80°59′430 (J2000), is coincident with the candidate host galaxy and is presumably the radio core component of the double radio source. This core component appears as an unresolved source in both the 12 and 22 cm images and has a flat spectral index between these wavelengths (we adopt the definition for the spectral index, where is the flux density at observing frequency ). A second unresolved component is observed at RA: 05h15m049, DEC: 80°57′401 (J2000) and appears on the sky within the northern lobe. This component has no associated intermediate resolution extended emission and is, therefore, unlikely to be a hotspot. This source has a radio spectral index , has no optical counterpart on the SuperCOSMOS digital sky survey and is presumably an unrelated background object. Both unresolved compact components are estimated to have angular sizes less than 4″.
The southern lobe of the double radio source SGRS J05158100 has a transverse width that increases to the south and away from the core. This lobe is bounded at its southern end by a relatively bright rim of emission that is discontinuous and concave outwards. The surface brightness in this lobe increases away from the core and towards this rim. The disjoint northern lobe is composed of two extended components that are aligned perpendicular to the source axis: a symmetric component to the west that has a relaxed appearance and a smaller edge-brightened component to the NE; these two components are connected by a bridge of emission.
2.1 Radio spectral energy distribution
The radio flux densities of the source components from our MOST and ATCA observations are listed in Table 2. It may be noted here that the northern and southern lobes of SGRS J05158100 have previously been detected in the Parkes-MIT-NRAO (PMN) survey (Griffith & Wright, 1993) at 6 cm wavelength with flux densities of about 13 and 35 mJy respectively; these values are also listed in the Table. The northern and southern lobes have straight radio spectra with steep spectral indices of between 36 and 6 cm wavelengths; within the errors in the measurements there is no evidence for any spectral curvature or breaks in the integrated spectrum over this wavelength range.
The distribution in the spectral index over the source was computed using images at 36 and 12 cm wavelength that had been convolved to a common beam of FWHM; this is shown in Fig. 4. Only pixels exceeding four times the rms noise in the individual images were used in forming the spectral index distribution. Overall the NW part of the northern lobe and the SW part of the southern lobe have the flattest spectra. Excluding the compact core, the extended emission is observed to have a progressive steepening in the spectral index from the ends of the source towards the center. Additionally, the western parts of the lobes are relatively flatter in their indices as compared to the eastern parts. The bridge connecting the NE and NW components of the northern lobe has a relatively steeper spectral index.
The FWHM images at 36, 22 and 12 cm have also been used to make a color-color plot, shown in Fig. 5. At each image pixel ( apart) that had significant flux density at all three wavelengths, the low frequency spectral index (between 36 and 22 cm) is plotted against the high frequency spectral index (between 22 and 12 cm). Each point represents the location of an image pixel in this plane. Pixels over the core component have been omitted.
In the color-color plot, the relatively bright rim along the outer edge of the southern lobe, and the NW end of the northern lobe, occupy an elongated concentration running roughly parallel to and just above the line. In these regions is in the range to and the spectral index between 22 and 12 cm is steeper than that between 36 and 22 cm by about 0.3. Along the southern rim, the spectral index steepens from west to east. In the lower surface brightness regions towards the core and away from the ends of the two lobes, the image pixels have a wider distribution in color-color space. Whereas is between and , steepens and takes on values in the range to . The NE component of the northern lobe displays the most spectral curvature: it occupies a region where and steepens from at the outer end to at its inner end. The few points scattered to the right of the line are from pixels close to the edges of the emission and probably arise from errors in the 12 cm image.
The parts of the extended emission most distant from the core have relatively flatter spectral indices and weak spectral curvature in the observed wavelength range. In both lobes the spectral index of the extended emission steepens and displays enhanced spectral curvature towards the center of the double radio source. The lowest surface brightness regions of the lobes, which are closest to the core, also have the largest spread in the color-color plane. The southern lobe has flatter indices in the SW regions that have the highest surface brightness; in contrast, the northern lobe has a spectral gradient across the lobe—the spectrum is flattest at the NW end and progressively steepens towards the core—although in total intensity the lobe appears symmetric and relaxed.
2.2 Radio polarization properties
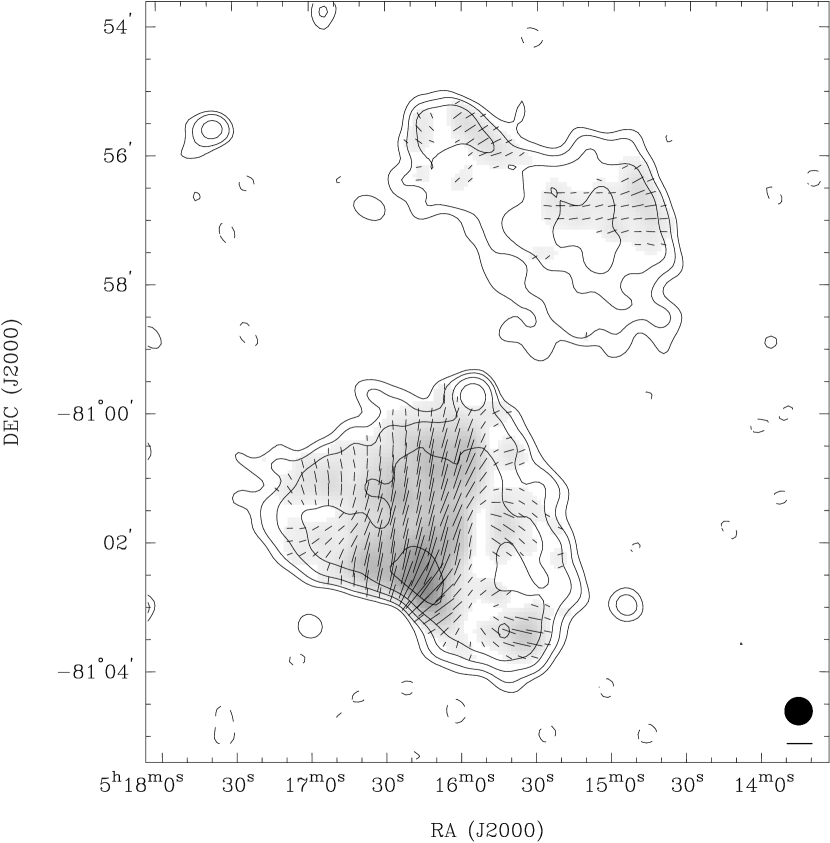
Images in Stokes Q and U were made at 12 and 22 cm with beam FWHM and these were used to construct images of the distribution in polarized intensity and the orientation of the observed E-field vectors across the source. The distribution in the intensity of the linearly polarized emission at 22 cm is shown in Fig. 6 using contours overlaid on a grey scale representation of the total intensity image. In the southern lobe, the polarized emission is sharply bounded along a straight edge running roughly NS; the edge is not aligned with the core and there is no corresponding feature in the total intensity image along this break. To the east of the edge, the southern lobe is 40–60% polarized whereas to the west, the lobe is 10–30% polarized. In the northern lobe, the polarized intensity as well as the fractional polarization are high at the NW end and along the edge-brightened boundary of the NE component: here the fractional polarization rises to 50–60%.
The rotation in the projected E-field vectors between 12 and 22 cm is consistent with a uniform rotation measure (RM) of value +50 rad m-2 over the entire source. The observed RM is consistent with the measurements of Simard-Normandin et al. (1981) towards other extragalactic sources in this sky region indicating that the RM is probably Galactic in origin. The distribution in the orientation of the projected E-field, corrected for this constant RM, is shown in Fig. 7 overlaid on a grey-scale representation of the polarized intensity and contours of the total intensity. The projected magnetic field (assumed to be orthogonal to the observed E-field) appears to be oriented circumferentially along the boundaries of the lobes. Within the southern lobe and to the east of the sharp discontinuity in polarized intensity, the magnetic field has large scale order and is aligned parallel to the southern bounding rim. To the west of the NS break the orientation of the magnetic field, in the regions where it has been reliably detected, changes to a roughly NS orientation.
Using images made with FWHM and examining the regions where the Stokes I, Q and U flux densities exceeded 3 times the image rms noise, the fractional polarization at 12 cm was observed to be higher than that at 22 cm: the depolarization ratio (DR; computed as the ratio of the percentage polarization at 22 cm to that at 12 cm) has a mean of 0.77 and a small spread with standard deviation 0.17.
3 Optical observations
The double-beam spectrograph on the ANU 2.3-m telescope at Siding Spring Observatory was used to get a spectrum of the host galaxy over the wavelength range 6200–7464 Å; this is shown in Fig. 8. H, [N ii] and [S ii] were detected in emission and NaiD in absorption. The redshift of the host was estimated from the absorption line to be ; the emission lines have a somewhat higher redshift and probably arise in infalling gas, with a relative velocity of about 210 km s-1, in the foreground of the host. However, the [N ii]/H and [S ii]/H ratios are as expected for an active narrow-line radio galaxy and unlike those observed in starburst galaxies indicating that the emission lines are from a nuclear narrow-line region.
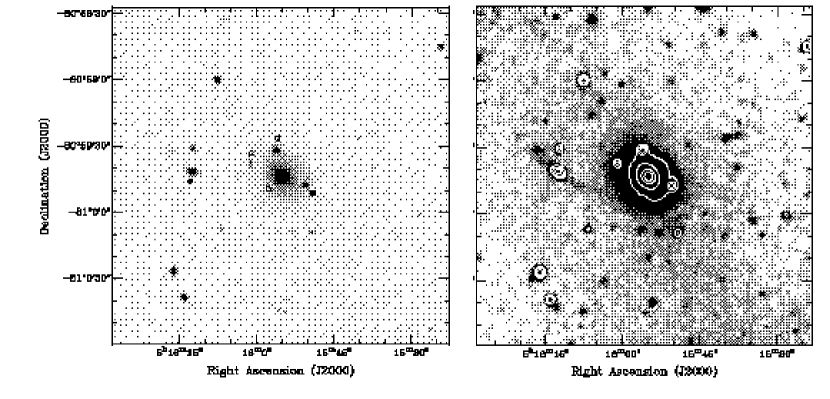
and band images of the field of the host galaxy were made using the imager on the ANU 2.3-m telescope; the seeing was about during the observations. The -band optical field is shown in Fig. 9: in the panel on the left we have marked the nearby objects and in the panel on the right the grey scale has been chosen to display the tidal tails on the two sides of object ‘e’. Fits to objects ‘a’, ‘c’ and ‘d’ show that their FWHM sizes are within the range found for objects that are clearly stars in the field. The photometry of the objects in the field is given in Table 3 where the color in the standard Johnson-Morgan/Cousins bands was derived from the observed and magnitudes using the relation
| (1) |
Objects ‘a’, ‘c’ and ‘d’ are classified as K stars on the basis of their colors. The host of the radio source, marked as object ‘b’, and the companion object with the tidal tails, marked ‘e’, have identical colors and may be classified as E galaxies on the basis of their colors. In the standard Johnson-Morgan/Cousins visual band, the apparent magnitude of the host ‘b’ is and that of the companion ‘e’ is 18.75. We infer the absolute magnitude of the host galaxy to be and that of its companion to be .
Spectra of the host galaxy and its companion were made in the optical blue band using the ANU 2.3-m spectrograph; the spectra covering the wavelength range 4000–5600 Å are shown in Fig. 10. The companion is blue shifted relative to the host and a joint fit to the Ca ii H and K absorption lines gives the line of sight velocity difference to be km s-1. The connecting tidal stream, together with the spectra, suggest a dynamical interaction between the host galaxy ‘b’ and the companion ‘e’.
4 The phenomenology of SGRS J05158100
Adopting a flat adiabatic CDM cosmology with matter density and Hubble constant 70 km s-1 Mpc-1, the source is at a luminosity distance of 486 Mpc and images have a linear scale of 116 kpc arcmin-1.
The source has a total radio power of W Hz-1 at 1.4 GHz. The host has in the Cousins band and for this absolute magnitude the radio power is about a factor 7 below the Fanaroff and Riley (FR) class I/II division for radio sources (Fanaroff & Riley, 1974; Ledlow & Owen, 1996). Moreover, the radio power is well below values typical of sources of the Fat-Double class (Owen & Laing, 1989). The projected linear size of the radio source is about 1.04 Mpc and the lobes have transverse widths of 0.64 Mpc. SGRS J05158100 is a giant radio galaxy and the axial ratio, computed as the ratio of the maximum linear size to the width, is about 1.6.
At 22 cm wavelength, most parts of the lobes of SGRS J05158100 have surface brightness about 10 mJy arcmin-2. Assuming standard minimum energy assumptions (Miley, 1980), we estimate that the relativistic plasma in the lobes of SGRS J05158100 has energy density J m-3. The source has the lowest surface brightness among all double radio sources that we know, and is just a factor of 3 above the surface brightness of the prototypical cluster-wide halo source in the Coma cluster. When compared to giant double radio sources discovered in the WENSS (Schoenmakers et al., 2000) and the VLA NVSS (Machalski et al., 2001), SGRS J05158100 has the lowest lobe synchrotron energy density. The WENSS, NVSS and SUMSS are wide sky area surveys that reach 5- surface brightness detection limits equivalent to 3–6 mJy arcmin-2 at 22 cm wavelength and, therefore, SGRS J05158100 is probably one of the lowest surface brightness extended sources we might expect to have detected in surveys to date.
4.1 SGRS J05158100: a Fat-Double relic giant radio galaxy?
Powerful radio galaxies, including giant radio galaxies, have relatively large axial ratios of about 5–5.6 (Subrahmanyan et al., 1996). Double radio galaxies of the Fat-Double class (Owen & Laing, 1989) have smaller axial ratios. The prototypical Fat-Double is 3C310; other examples in the literature are 3C386, 3C314.1, Fornax A and possibly B2 0924+30; these sources have axial ratios in the range 1.7–2.4. The Fat-Doubles have diffuse lobes that appear relaxed and without hotspots or any compact features, the surface brightness in the lobes diminishes towards their edges and most have lobe spectral indices . Although core radio emission has been detected in the hosts of many of these sources, it is believed that jets from the central engine have stopped feeding the lobes and that their lobes are relics of past activity. Fat-Double sources lie near the FR I/II break in radio power and this is consistent with the hypothesis that they were FR II sources whose luminosity dropped to the present value while their lobes expanded and evolved to their current relaxed state.
The low surface brightness, low energy density, lack of hotspots and steep spectral index are suggestive of an interpretation in which the lobes of SGRS J05158100 are relics of past activity and have attained their present state as a result of the disappearance of hotspots and any bright structures owing to relaxation within the lobes accompanied by expansion losses and synchrotron aging. With its relatively small axial ratio, intermediate radio power and fairly relaxed appearance, SGRS J05158100 might be the first example of a giant radio galaxy in the Fat-Double class. Moreover, the high fractional polarization observed within the lobes of SGRS J05158100 and the circumferential B field orientation along the edges of this source are characteristic of the class of Fat-Doubles.
However, SGRS J05158100 has features that are inconsistent with relic Fat-Doubles. The source has a significant emission gap between the two lobes and such gaps have not been observed in Fat-Doubles in the literature. The northern lobe appears to be composed of a symmetric and diffuse structure to the west which drops off radially in surface brightness as might be expected for a relaxed relic lobe; however, the northern lobe has a NE extension that has a brightening along its outer edge and this component does not have a relaxed structure. The southern lobe is also edge brightened. The absence of hotspots in SGRS J05158100 suggests that currently there are no jets from the central engine injecting energy into the lobes. However, the presence of edge brightening in the NE and southern lobes suggests that energy was being injected at the ends of these lobes in the recent past, likely within a time corresponding to the sound crossing time across the lobes. This suggests that the wide lobes are not a result of expansion in a relic phase after the jets ceased and the lobes relaxed internally.
4.2 Dynamical evolution
Significant depolarization has been observed in regions where the fractional polarization is high and where the field is uniform: the DR is unlikely due to beam depolarization. A significant part of the observed uniform Faraday rotation of +50 rad m-2 is clearly external to the source and presumably originates in the Galaxy; however, a part of the observed RM might arise from entrained plasma that causes internal Faraday rotation and depolarization. If the magnetic field has an energy density equal to the energy density of the relativistic plasma in the lobes, which was estimated assuming standard minimum energy assumptions, a uniform 0.08 nT field threads a large part of the lobes. The observed DR would arise if thermal material with particle number density m-3 is entrained. In this case, the generalized sound speed in the lobes would be as low as 0.0003 and the sound crossing time within the bright structures along the southern end of the source could be as large as 1 Gyr.
The host of SGRS J05158100 is not in any rich group or cluster environment; it is a field galaxy with a companion and is presumably located in the filamentary large scale structure of the present epoch. The Mpc-scale radio structure of this giant radio galaxy is outside any coronal gaseous halo that might be associated with the host galaxy and is expected to be embedded in the warm-hot intergalactic medium (WHIM) that traces large scale filaments. This WHIM constitutes about 30–40% of the total baryons and is expected to have a temperature 0.01–0.5 keV within the filaments that represent overdensities in the range 5–200 (Cen & Ostriker, 1999; Dave et al., 2001). The thermal gas pressure in these unvirialized regions is at most Pa. Today, the non-thermal gas pressure in the radio lobes of SGRS J05158100 is inferred to be Pa, which is just above the range for the external pressure; therefore, during the evolutionary history the lobes are expected to have been overpressured with respect to the ambient gas. The expansion speed of the lobes of SGRS J05158100 is limited by the inertial mass of the WHIM thermal gas, which has a density in the range 0.7– kg m-3. Ram pressure balance indicates that lobe expansion speed –.
The lobes of the radio source are likely to contain thermal gas as a result of entrainment at the termination shock at the ends of the source where the jets meet the IGM. Additionally, entrainment may occur during the propagation of the jets out of the environment of the host galaxy. The gaseous environment is likely to be the WHIM discussed above and, even if a significant fraction of the IGM is entrained, the sound speeds within the lobe plasma could be small enough so that the lobes might expand and be ram pressure confined at speeds –. In this case, lobe expansion by a factor of 2 would require 0.25–1.3 Gyr. However, if the density of the entrained thermal gas in the lobes exceeds about m-3, and takes on values closer to m-3 as suggested by the DR measurements, such an entrainment is likely a result of interactions with relatively dense gas in the interstellar medium of the host galaxy and its immediate environment. High density entrainment would limit lobe expansion speeds to well below 0.001 and expansion by a factor of 2 would require 4 Gyr.
4.3 Spectral evolution
The energy density in the lobes corresponds to an equipartition magnetic field of 0.08 nT, which is a factor of 5 less than the magnetic field equivalent to the energy density in the cosmic microwave background radiation (CMBR). Assuming that the lobes have a tangled magnetic field and that they have not expanded adiabatically by more than a factor of 2 since the jets stopped feeding the lobes, spectral aging in the lobe non-thermal gas would have been dominated by inverse-Compton losses against the CMBR.
Edge-brightened double radio sources in which jets are observed to be powering the lobes usually have spectral indices at the hotspots and we assume that during the active phase the injection index in SGRS J05158100 was . During the active phase, simple models for the spectral aging of the relativistic plasma lead to a spectral break steepening the index to at higher frequencies. The color-color plot in Fig. 5 shows that all parts of the source have ; continuous injection models (Pacholczyk, 1970) suggest that the source age is more than 0.1 Gyr. Spectral aging in the relic phase, with pitch-angle scattering, will cause a much steeper exponential cutoff beyond a break frequency (Jaffe & Perola, 1974). The radio colors of the bright rim along the southern lobe and the NW parts of the northern lobe are consistent with a model in which the lobes were injected with relativistic plasma with spectrum of index that subsequently aged. In this model the NW and SW ends of the source correspond to plasma with relic-phase lifetimes of 40 Myr; the relatively less bright southern rim has a relic life of 55 Myr. The parts of the two lobes closer to the core have a large scatter in color-color space; however, their path traces ages from 60–90 Myr with plasma of larger spectral age lying closer to the core. All these estimates suggest that the activity commenced more than 0.1 Gyr ago and continued until at least 40 Myr ago.
The NE component of the northern lobe is distinctive in that it has and significant spectral steepening at higher frequencies; it has maximum spectral curvature and does not fit any simple model of spectral aging. This anomaly, together with the large spread in colors in the low-surface-brightness parts of the lobes, indicates complexity in source history and particle acceleration: the initial spectra created at the ends of the lobes might have been curved or may have had very different injection indices at different times. Additionally, all of the above spectral age estimates are likely to be overestimates because of expansion out of the hotspots and within the lobes, and because the equipartition magnetic fields are smaller in the NE component and closer to the core where the surface brightness is lower and this would shift any spectral break in the electron energy spectrum to lower emission frequencies. The lack of inversion symmetry in the color distribution properties is additional reason for caution in deriving ages from the color distribution over the source. The morphology itself might in fact be a better indicator of dynamical history.
4.4 Activity and interaction at the host galaxy
The host galaxy that is believed to have created the relic radio lobes of SGRS J05158100 has a radio power of W Hz-1 at 5 GHz with a flat non-thermal radio spectrum indicating ongoing nuclear activity. Only 10% of early type galaxies with absolute magnitude corresponding to that of the host of SGRS J05158100 are expected to host AGNs with this radio power (Sadler et al., 1989) implying that the current activity might be related to that which created the large-scale radio structures. An active radio galaxy with total radio power of W Hz-1 at 0.408 GHz typically has a core power of W Hz-1 at 5 GHz (Giovannini et al., 1988); SGRS J05158100 has a core power just a factor of two below this value. Within the scatter in the relationship this is consistent with the hypothesis that although jets from the core may not be continuing to supply energy to the lobes, the activity at the core continues at the present epoch. Further support for this picture come from the relatively small spectral age and the edge-brightened structures that suggest activity in the recent past.
As seen in Fig. 9, the host galaxy appears to be interacting with a fainter companion. The host elliptical is 2.7 magnitudes brighter than the companion and both have similar colors suggesting that the mass ratio of the interacting pair is about 12. The outer isophotes of the host are offset with respect to the centre of the galaxy and this halo is extended away from the companion and towards the far side. The halo probably represents a dynamical friction wake — a relic expected from an encounter with a relatively small mass companion (Barnes & Hernquist, 1992). The companion is observed to have a fine tidal bridge extending towards the host galaxy and a fine tail on the far side; both features form part of an arc and these structures are presumably the result of a tidal stretching of the companion along its post-encounter trajectory. Such leading and trailing debris trails are expected in ‘victims’ after pericenter passage in moderately high speed encounters with galaxies that are much more massive (see, e.g., Johnston et al. (1996) and references therein). The companion is observed at a projected distance of 80 kpc from the host center. Assuming that the companion has an orbital speed that is greater than its observed line-of sight velocity, we estimate that the pair is currently being observed about 0.2 Gyr after pericenter passage. The data are consistent with a picture where the companion had a close and fast encounter on a highly elliptic or perhaps hyperbolic trajectory and is now in the foreground of the host, moving NE and towards us with a speed about 500 km s-1 relative to the host. The blue-shifted emission line gas that is observed towards the host might represent foreground gas from the companion infalling towards the host.
5 The evolutionary history of SGRS J05158100
The model for edge-brightened lobes is one in which jets terminate in shocks at the ends of the source and advance the heads at speeds limited by ram pressure of the external gas; this advance speed is expected to well exceed the lateral expansion speed that is driven by the excess pressure in the lobes relative to the medium. In comparison with the lobes of powerful edge-brightened radio sources, as well as the relaxed lobes of Fat-Doubles, the southern lobe of SGRS J05158100 is unusual in that the lobe is fan shaped with the lobe width increasing towards its end. This peculiarity in the morphology, together with the extremely small () value of the axial ratio and the edge brightening of the lobes, suggests that the wide lobes in SGRS J05158100 have attained their properties not as a result of expansion in a relic phase but as a result of significant (about ) variations in the direction of the jet axis during the history of its activity.
The evolution in the lobes of SGRS J05158100 may have proceeded in two phases: (i) an active phase during which energy was transported to the lobes via jets whose axis varied significantly, and (ii) a recent relic phase during which the jets were off. Internal relaxation, continuous expansion against the ambient intergalactic medium and radiative losses evolved the structure and spectrum. The active phase might have been punctuated by times when the jets ceased and subsequently restarted. The constraints on the dynamical evolution indicate that if the jet axis were stable over the source lifetime, and the wide lobes were a result of lateral expansion, timescales in the range 0.2–4 Gyr are involved in relaxation processes within the lobes and expansion against the external gas: this exceeds the time since pericenter passage of the companion. However spectral aging considerations suggest timescales of 0.1 Gyr and smaller for the lifetime of the radiating electrons throughout the source, indicating that what we observe are recently accelerated electrons that have rapidly streamed across the giant radio lobes. These radiating electrons throughout the source were accelerated post pericenter passage of the companion.
A possible scenario is that the radio source lifetime is Gyr and was triggered by the pericenter passage of the companion. In this picture the recent close encounter would also be the cause for the jets to swing around and deposit synchrotron plasma over a wide angle and, therefore, the limits to lateral expansion speeds due to ram pressure would not be a constraint on the source age. However, it has been argued that the timescale for a merger event to fuel and trigger jet activity in a massive black hole at a galactic center could well exceed 0.1 Gyr (see, for example, Morganti et al. (2003)). Additionally, the jets in SGRS J05158100 have probably switched off about 40 Myr ago, so this constrains the entire active life of the giant radio source to be Myr following the galaxy-galaxy interaction.
A more likely scenario is one in which the the activity in the host galaxy commenced Gyr ago with the initial fuel provided by a previous interaction, perhaps an earlier close passage of the companion itself. Subsequent activity over the long dynamical timescale led to the formation of the giant radio structure. The more recent close encounter with the companion, 0.2 Gyr ago, might have restarted the activity if it had ceased and, additionally, caused the black hole spin axis and inner accretion disks to change direction.
Flyby encounters with low-mass companions that penetrate the outer regions of galaxy halos, as is the situation in SGRS J05158100, might perturb the gravitational potential deep within the half-mass radius and warp disks embedded within AGN hosts (Weinberg, 1998; Vesperini & Weinberg, 2000). Such tidal encounters are believed to be capable of triggering nuclear activity (Lim et al., 2004), implying that early stages of encounters could perturb the innermost regions of galaxies. Additionally, material added in an encounter might have angular momentum vector inclined to the accretion disk axis causing warps in outer parts of accretion disks. The flywheel that determines the stability of nuclear jets may not be the angular momentum of the central black hole, but the more massive accretion disk (Natarajan & Pringle, 1998) and if flybys cause warps in the outer accretion disk, the black hole spin axis might realign in 0.1–1 Myr, which is much less than the timescale for radio activity. Because the black hole spin axis is coupled to the outer accretion disk, it is not implausible that an encounter, which perturbs/warps the disk, might realign the jet axis.
The relatively short spectral timescales suggest that recent jet activity, 40-100 Myr ago, injected the radiating particles whose emission we observe today. These new jets were likely directed towards the NE parts of the northern lobe, which are edge brightened, and towards the SW parts of the edge brightened southern lobe, which has a lower fractional polarization. These particles, produced in the most recent activity phase, light up the entire radio source by streaming across the lobes and energizing the more relaxed SW parts of the northern lobe and the eastern parts of the southern lobe where the fractional polarization is high and the magnetic field presents a relaxed ordered appearance. The large DR observed might be entrainment related to the galaxy encounter and the addition of cold gas to the central parts of the host galaxy. The scenario sketched here is in some ways similar to the case of 3C293 (Evans et al. (1999) and references therein), where past activity triggered by interaction with a gas-rich galaxy resulted in extended classical double radio lobes and a recent interaction with a companion has triggered the formation of a kpc-sized inner double; the renewed activity in that case was along an axis offset with respect to the outer older axis.
The observations of SGRS J05158100 presented here support the hypothesis that encounters with significantly lower mass galaxies, which presumably result in minor mergers, might perturb the inner accretion disk and black hole spin axis direction. The perturbation manifests as a significant change in the direction of jets from the active galactic nucleus. Merritt & Ekers (2002) argue that minor mergers, leading to black hole coalescence, could significantly perturb the jet axis direction and result in X-shaped radio sources: the abundance of such radio sources was used to infer the black-hole coalescence rate and event-rate expectations for gravitational wave detectors. The observations of SGRS J05158100 indicate that interactions with companions might significantly perturb the radio axis direction well before the minor merger and any black hole coalescence; therefore, evidence for significant changes in jet axis direction does not necessarily imply black-hole coalescence. Consequently, gravitational wave event rates inferred from the abundances of such radio sources might be overestimates.
References
- Barnes & Hernquist (1992) Barnes, J. E., & Hernquist, L. 1992, ARA&A, 30, 705
- Bessell (1990) Bessell, M. S. 1990, PASP, 102, 1181
- Bock et al. (1999) Bock, D. C. -J., Large, M. I., & Sadler, E. M. 1999, AJ, 117, 1578
- Cen & Ostriker (1999) Cen, R., & Ostriker, J. P. 1999, ApJ, 514, 1
- Clark (1980) Clark, B. G. 1980, A&A, 89, 377
- Dave et al. (2001) Dave, R., Cen, R., Ostriker, J. P., Bryan, G. L., Hernquist, L., Katz, N., Weinberg, D. H., Norman, M. L., & O’Shea, B. 2001, ApJ, 552, 473
- Evans et al. (1999) Evans, A. S., Sanders, D. B., Surace, J. A., & Mazzarella, J. M. 1999, ApJ, 511, 730
- Fanaroff & Riley (1974) Fanaroff, B. L., & Riley, J. M. 1974, MNRAS, 164, 31
- Fukugita et al. (1995) Fukugita, M., Shimasaku, K., & Ichikawa, T. 1995, PASP, 107, 945
- Giovannini et al. (1988) Giovannini, G., Feretti., L., Gregorini, L., & Parma, P. 1988, A&A, 199, 73
- Griffith & Wright (1993) Griffith, M. R., & Wright, A. E. 1993, AJ, 105, 1666
- Jaffe & Perola (1974) Jaffe, W. J., & Perola, G. C. 1974, A&A, 26, 423
- Johnston et al. (1996) Johnston, K. V., Hernquist, L., & Bolte, M. 1996, ApJ, 465, 278
- Ledlow & Owen (1996) Ledlow, M. J., & Owen, F. N. 1996, AJ, 112, 9
- Lim et al. (2004) Lim, J., Kuo, C.-Y., Tang, Y.-W., Greene, J., & Ho, P. T. P. 2004, in The Interplay among Black Holes, Stars and ISM in galactic Nuclei, Proceedings of IAU Symposium, No. 222, ed. T. Storchi-Bergmann, L. C. Ho & H. R. Schmitt (Cambridge: Cambridge University Press), 455
- Machalski et al. (2001) Machalski, J., Jamrozy, M., & Zola, S. 2001, A&A, 371, 445
- Merritt & Ekers (2002) Merritt, D., & Ekers, R. D. 2002, Science, 297, 1310
- Miley (1980) Miley., G. 1980, ARA&A, 18, 165
- Morganti et al. (2003) Morganti, R., Oosterloo, T. A., Capetti, A., de Ruiter, H. R., Fanti, R., Parma, P., Tadhunter, C. N., & Wills, K. A. 2003, A&A, 399, 511
- Owen & Laing (1989) Owen, F. N., & Laing, R. A. 1989, MNRAS, 238, 357
- Natarajan & Pringle (1998) Natarajan, P., & Pringle, J. E. 1998, ApJ, 506, L97
- Pacholczyk (1970) Pacholczyk, A. G. 1970, Radio Astrophysics (San Francisco: Freeman and Co.)
- Sadler et al. (1989) Sadler, E. M., Jenkins, C. R., & Kotanyi, C. G. 1989, MNRAS, 240, 591
- Saripalli et al. (2002) Saripalli, L., Subrahmanyan, R., & Udaya Shankar, N. 2002, ApJ, 565, 256
- Saripalli et al. (2003) Saripalli, L., Subrahmanyan, R., & Udaya Shankar, N. 2003, ApJ, 590, 181
- Saripalli et al. (2005) Saripalli, L., Hunstead, R. W., Subrahmanyan, R., & Boyce, E. 2005, AJ, in press
- Schoenmakers et al. (2000) Schoenmakers, A. P., Mack, K. -H., de Bruyn, A. G., Roettgering, H. J. A., Klein, U., & van der Laan, H. 2000, A&AS, 146, 293
- Simard-Normandin et al. (1981) Simard-Normandin, M., Kronberg, P. P., & Button, S. 1981, ApJS, 45, 97
- Steer et al. (1984) Steer, D. G., Dewdney, P. E., & Ito, M. R. 1984, A&A, 137, 159
- Subrahmanyan et al. (1996) Subrahmanyan, R., Saripalli, L., & Hunstead, R. W. 1996, MNRAS, 279, 257
- Tadhunter et al. (2005) Tadhunter, C., Robinson, T. G., Gonzalez Delgado, R. M., Wills, K., & Morganti, R. 2005, MNRAS, 356, 480
- Vesperini & Weinberg (2000) Vesperini, E., & Weinberg, M. D. 2000, ApJ, 534, 598
- Weinberg (1998) Weinberg, M. D. 1998, MNRAS, 299, 499
| Band | Telescope | Date |
|---|---|---|
| Radio 36 cm continuum | MOST | 1999 Aug |
| Radio 22 & 13 cm continuum | ATCA | 2000 Jan, Feb, Jul & Oct |
| Optical R & V imaging | ANU 2.3-m | 2002 Jan |
| Optical spectra | ANU 2.3 m | 2002 Jan & 2004 Jan |
| Wavelength | Tel/Survey | N lobe (mJy) | S lobe (mJy) | Core (mJy) | Total (mJy) |
|---|---|---|---|---|---|
| 36 cm | MOST | 83 | 210 | — | 293 |
| 22 cm | ATCA | 50 | 124 | 1.9 | 176 |
| 12 cm | ATCA | 26 | 63 | 2.1 | 91 |
| 6 cm | PMN | 13 | 35 | — | 48 |
| Object | Class | RefbbReferences for the classification. | |||
|---|---|---|---|---|---|
| a | 20.13 | 19.68 | 0.47 | K0 V | Bessell (1990) |
| b | 16.89 | 16.20 | 0.71 | E(z=0.1) | Fukugita et al. (1995) |
| c | 21.19 | 20.76 | 0.46 | K0 V | Bessell (1990) |
| d | 20.28 | 19.38 | 0.84 | K7 V | Bessell (1990) |
| e | 19.56 | 18.88 | 0.71 | E(z=0.1) | Fukugita et al. (1995) |