Cosmological Simulations of Galaxy Formation I: Star Formation, Feedback, Resolution and Matching the Tully–Fisher Relation (among other things).
Abstract
We used fully cosmological, high resolution N-body+SPH simulations to follow the formation of disk galaxies with a rotational velocity between 140 and 280 Km/sec in a CDM universe. The simulations include gas cooling, star formation (SF), the effects of a uniform UV background and a physically motivated description of feedback from supernovae (SN). Feedback parameters have been chosen to match the star formation rate and interstellar medium (ISM) properties of local galaxies. In cosmological simulations galaxies formed rotationally supported disks with realistic exponential scale lengths and fall on the I-band and baryonic Tully Fisher relations. The combination of UV background and SN feedback drastically reduced the number of visible satellites orbiting inside a Milky Way sized halo, bringing it in fair agreement with observations. Feedback delays SF in small galaxies and more massive ones contain older stellar populations. Here we focus on the SF and feedback implementations. We also briefly discuss how high mass and force resolution and a realistic description of SF and feedback are important ingredients to match the observed properties of galaxies.
1INAF–Brera, Milano. 2University of Washington, Seattle. 3McMaster Univ., Hamilton. [fabio,stinson]@astro.washington.edu
1 Introduction
N–Body/gasdynamical simulations have become the primary tools to model galaxy formation in the hierarchical model of structure formation. They are necessary to follow the internal structure of galaxies as well as the complex interplay between baryon cooling/heating and energy injection from stellar processes. In this paper we describe a revised star formation algorithm[1] combined with a physically motivated description of SN feedback first studied in detail by Thacker & Couchman[2]. We then discuss some results from simulations of the formation of disk galaxies in a fully cosmological CDM context. A complete description of the results presented here will follow in Stinson et al (S05) and Governato et al 2005 (G05).
SN winds or quenching of star formation by UV photons especially in halos with small escape velocities have often[3,4] been mentioned as important in (a) shaping the angular momentum of disk galaxies and the Tully - Fisher relation[5], (b) decreasing or stopping SF in small galactic satellites[6] and (c) explaining the relation between average stellar ages and total stellar masses in disk galaxies[7]. We studied the effect of feedback on the structure of disk galaxies and their satellites by improving over previous works in a number of ways: The mass and spatial resolution of these simulations (5-40 105 particles within the virial radius) are sufficient to (1) resolve the structure of disks without being significantly limited by resolution (2) to resolve the subhalo population for each galaxy in our sample down to circular velocities of about 20% of their parent halo allowing us study the basic properties of galactic satellites. We use the algorithm in cosmological simulations of individual high resolution galaxies spanning a factor of 20 in mass and analyze their properties. To better compare our models with observations we coupled our outputs with GRASIL[8], to obtain the spectral energy distribution (SED) of their stellar components that take into account the effects of metals and dust reprocessing.
2 GASOLINE and the Star Formation/Feedback Algorithm
We used GASOLINE[9], a smooth particle hydrodynamics (SPH), parallel treecode that is both spatially and temporally adaptive with individual particles timesteps. Simulations include the effect of i) Compton and radiative cooling, ii) star formation and supernova feedback and iii) a UV background following an updated version of Haardt & Madau [10]. Our algorithm can be broken down into three main parts: (a) identifying the star forming regions, (b) forming stars and (c) treating stellar evolution including such effects as mass loss, SN winds and metal enrichment.
The criteria for star formation are as follow: (a) Gas particle colder than Tmax = 30,000 K (b)Local gas density nmax 0.1 cm-3 (c) Gas particle part of a converging flow measured over the 32 nearest neighbors. We do not include the criterion that gas particle be Jeans unstable as the criterion proved to be resolution dependent (see S05). A minimum overdensity is also required to avoid spurious star formation at very high z.
SF Efficiency: we base the number of stars that form on the proposed relation [11] , where represents the volume density. These formulations use the fact that dynamical time, , so that
| (1) |
where we have introduced a constant efficiency factor that enables tuning of the star formation rate to observations We experimented with values in the range 0.01 – 1. and adopted a a value of = 0.05. Higher values have been used when star forming regions are individually resolved[13]. The mass of star particles formed is fixed to 30% of its parent gas initial mass. This choice is shown to give results weakly dependent on resolution. Once the particle passes the above criteria, to implement eq.(1) in a discrete system we assign a probability that a star will actually be spawned from its parent gas particle:
| (2) |
where we have introduced , the spawning mass for star particles, , the mass of the gas particle that is creating the star, , the star formation timescale (1 Myr in all of the simulations described in this paper) and , which can be either the dynamical time or the cooling time whichever is longer. Gas particles in dense regions with shorter dynamical times will form stars at a higher probability.
Feedback, mass loss and metal enrichment: Once formed, a star particle can be considered as a single stellar population with uniform metallicity. We use a Miller – Scalo IMF[14] (but we will use Kroupa’s IMF[15] in future work). The use of stellar lifetimes and integration over the initial mass function provides the total mass and number of stars that will explode during a timestep[16]. Metals come from both SNs Ia & II. The code also keeps track of mass loss from stellar winds (e.g. planetary nebulae). With the adopted IMF star particles lose up to 30-40% of their original mass as their underlying stellar population ages. Neglecting this constant resupply of gas would underestimate the SFR at late times. Feedback in our simulations is purely thermal as we assume that the blastwaves of SNII convert the kinetic energy of the ejecta into thermal energy on scales smaller than those resolved in our simulations.
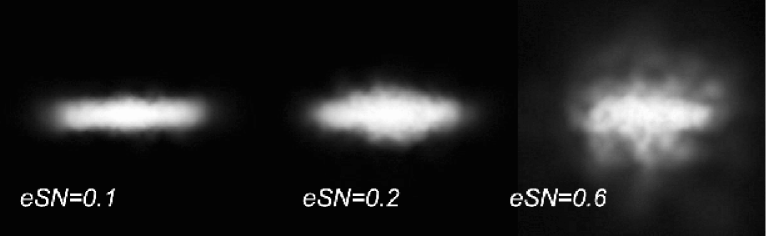
Since some of the energy from SNs is quickly radiated away, we multiply the number of SNII that explode by a fraction of the canonical ergs/SN times an efficiency term (eSN), and distribute that energy to the surrounding gas particles. We explore efficiency values in the range 0.1 to 0.6 with eSN = 0.4 being our preferred value. At an efficiency of 0.1, ergs of energy are deposited into the surrounding gas for every one of star formed. In this version of the feedback algorithm, energy and metals are distributed using the smoothing kernel over the 32 nearest neighbor particles (but see the Blastwave approach). Our implementation of feedback follows qualitatively the algorithm implemented by Thacker & Couchman[2]: we assume that the energy released into the ISM turns into turbulent motions (at unresolved scales) and stops the gas from cooling and forming stars. However, the time scale for the cooling shutoff and the amount of mass affected are now physically motivated and chosen following typical values from the MacKee and Ostriker [17] blast wave model (see next par.). In this version of the feedback algorithm we disable the radiative cooling for 20 million years in a number of the nearest neighbor particles that satisfy eq. (3):
| (3) |
where is the mass of supernovae produced in a star in a given timestep, r is the distance from the star to the gas particle in question and is the local gas density and is a normalization factor. The maximum number of particles that we can disable the cooling on is the number of SPH neighbors (32 in our simulations). For each of the simulations described in this work we assumed a fixed value for = 5000. We then performed a large number of simulations to study the effect of different combination of the main three star formation parameters: (a) the star formation efficiency parameter c⋆, (b) the mass factor and (c) the SN efficiency eSN (Fig.1, left). We applied our algorithm to two N–body models of isolated galaxies having circular velocities of 220 and 70 km/sec describing a Milky Way like and a dwarf galaxy respectively. They include a rotationally supported stellar and gaseous disk, a bulge for the MW model and a cosmologically motivated dark matter halo component. Stars start with a Toomre parameter Q=2. Disks are built to be stable to bar instabilities. With the best parameters indicated in italics model galaxies satisfy a number of observational criteria (see G05 for more details): the amplitude of cold ISM turbulence, present day SFR vs total stellar mass, Rd/Rz (i.e disk radius/height scale lengths ratios). The isolated MW model satisfies the Schmidt law and its normalization (Fig.1, right). We then held the best parameters fixed as we applied them to full fledged cosmological simulations.
The Blastwave Approach: As described in S05, exploration of the parameter led us toward introducing an explicit blastwave solution[17]. This solution reduces the number of tunable parameters by providing both a maximum radius to which the blastwave explosion will reach and a time that the blastwave will keep the gas hot. corresponds to the end of the snowplow phase and to its radius and they are function of the local properties of energy injected, E51, and the gas pressure and density n0.
-
•
(SN blast radius) = 10 pc
-
•
(cooling shutoff timescale) = 10 years
.
With this approach, we only disable cooling in a fraction of the particles within the smoothing length. We verified that results presented here do not change significantly as the more sophisticated feedback recipe is adopted. However, the “blastwave approach” further reduces star formation in halos with mass . This refined approach has as free parameters only c∗, eSN, wich we contrained from local galaxies and will become our standard for future works. While scales below the resolution (0.2-1kpc) remain unresolved, the approach outlined above gives a simple, but physically motivated description of star formation and feedback with no fudge factors at the resolved scales that can be tested and ultimately falsified. Additional levels of complexity can eventually be added.
| Run | Virial Mass | Vca | spin | Last major merger | N at z=0 | |
|---|---|---|---|---|---|---|
| M | Km/sec | z | kpc | dark+gas+stars | ||
| DWF1 | 1.6 1011 | 70 | 0.01 | 2.2 | 0.3 | 860.000 |
| MW11 | 1.15 1012 | 134 | 0.04 | 2.5 | 0.6-0.31 | 700.000 - 4.000.0002 |
| GAL1 | 3.1 1012 | 185 | 0.035 | 2.75 | 1. | 480.000 |
3 Cosmological simulations
For our cosmological runs we selected three halos from low resolution, dark matter only simulations in a concordance flat CDM cosmology: , =0.7, , . From a 28.5 and 100 Mpc box, low resolution simulations, we selected and resimulated at higher resolution three halos with mass between 1.6 1011 and 3 1012 M⊙ and a relatively quiet merger history: good candidates to host spiral galaxies. The “zoomed in”[18] approach for the initial conditions is the most realistic as torques from distant objects and infall from surrounding regions are more correctly described than in isolated initial conditions of uniform collapsing regions with solid body rotation. Table 1 shows the main parameters of the simulations and of the selected halos, whose mass should correspond to a small galaxy (DWF1), a Milky Way sized one (MW1) and a more massive halo (GAL1) likely associated with early type spirals or S0s. Halos were selected with somewhat early but not uncommon epochs for their last major merger event to test the null hypothesis that the simulations should produce disk dominated galaxies. The MW1 simulation was run with increasing feedback (SN efficiency 0.2,0.4 and 0.6) and once with 8 times more particles to test resolution effects (to z = 0.5). This “super” run is the highest resolution run to date of a MW sized galaxy with more than 4 million particles, a gas particle mass of only 105 M and force resolution of 0.3 kpc. By the present time all three galaxies show an extended disk component supported by rotation. In all but the most massive galaxy the bulge component is sub-dominant, with the outer stellar halo contributing only 10% to the total stellar mass. Once corrected for dust reprocessing in their disks, the three galaxies show fairly blue colors (B-V = 0.6).
The simulated galaxies share some important properties with real ones: since feedback removes gas and reduces drastically star formation in halos with Vc ( ) 50 Km/sec, MW1 has only about 10 satellites with a significant stellar component (Fig.3) with another 20 dark satellites. The smaller galaxy (DWF1) has all but one satellite completely dark.
One difference with most previous works is that the galaxies fall easily on the I-band Tully–Fisher relation[19] (Fig.3) and provide an equally good match to the baryonic Tully Fisher[20]. Following the observational sample for Vrot we used the azimuthally averaged rotation curves (using cold gas as a tracer) of galaxies at 3.5 and 2.2Rd, where Rd is the disk scale length in the approximate I band (stars younger than 5 Gyrs).
4 Resolution
Why do our simulations successfully reproduce the TF relation? Tests[18] show that low resolution and possibly lack of feedback cause baryons to become too centrally concentrated due to angular momentum transfer from the disk to the halo (due to a grainy potential causing scattering of disk particles by two–body encounters) (Fig.4). A galaxy too centrally concentrated would shift to the right of the observed TF plotted in Fig.3 [3]. As our simulations have a force resolution smaller than 25% of the disk scale lengths and use several hundreds of thousands particles within the virial radius they give robust and likely converging results at scales corresponding to the typical scale length of stellar disks (1-5 kpc). Feedback also helped to prevent gas to accumulate and form stars at the center. A comparison between our standard MW1 run and its super high resolution version at z=0.5 clearly shows that as resolution is increased the peak Vc (linked to the underlying density profile) and the bulge component both decrease significantly (Fig.4). At even lower resolutions an artificially dominant and concentrated bulge would have caused Vrot(3.5 Rd) to be severely overestimated, shifting simulations to the right of real data. This test suggest that about several 105 particles and force resolution 1 kpc are needed to simulate the dynamics of galactic disks. As many as 106 DM particles and 0.4 kpc force resolution might be needed to study the formation of galactic bulges.
Acknowledgements. FG would like to thank Chris Brook, Victor Debattista, Elena D’Onghia, Adriano Fontana, George Lake, Anatoly Klypin and Matthias Steinmetz for helpful and sometimes intense conversations. FG was a Brooks Fellow when this project started. FG was supported in part by NSF grant AST-0098557 and the Spitzer Space Telescope Theor. Res. Prog., provided by NASA through a contract issued by JPL. We thank A.Brooks, N.Katz, L.Mayer, A.Seth, O.Valenzuela & B.Willman for allowing us to show results in advance of publication.
References
[1]Katz, N. 1992, ApJ, 391, 502 [2]Thacker, R. J., & Couchman, H. M. P. 2001, ApJ, 555, L17 [3]Binney J., Gerhard O., Silk J., 2001, MNRAS, 321, 471, [4]Benson et al. 2002, MNRAS, 333,177, [5]Navarro J. F., Steinmetz M., 2000, ApJ, 538, 477 [6]Moore B., Ghigna S., Governato F., Lake G., Quinn T., Stadel J., Tozzi P., 1999, ApJ, 524, L19 [7]MacArthur, L. A., et al. 2004, ApJS, 152, 175 [8]Silva, L. et al. 1998 MNRAS, 509, 103 [9] Wadsley J. W., Stadel J., Quinn T., 2004, New Astron., 9, 137 [10]Haardt F., Madau P., 1996, ApJ, 461, 20 [11]Larson, R. B. 1969, MNRAS, 145, 405 [12]Kennicutt R. C., 1998, ApJ, 498, 541 [13]Li Y., Mac Low M.-M., Klesse R. S., 2005, ApJ, 626, 823 [14]Miller G.E, Scalo, J.M. 1979, ApJS, 41, 513 [15]Kroupa, P. 2002, Science, 295, 82 [16]Raiteri C. M.,Villata M.,Navarro J. F., 1996, A&A, 315, 105 [17]McKee, C. F. and Ostriker, J. P., 1977, 218, 148 [18]Governato, F., et al. 2004, ApJ, 607, 688 [19]Giovanelli, R. et al. 1997, AJ, 113, 53 [20]McGaugh, S.S. astro-ph/0506750, in press.