Modelling the energy dependencies of X-ray quasi-periodic oscillations in accreting compact objects
Abstract
We have constructed models of quasi-periodic variability of X–ray emission from accreting compact objects. Assuming a general scenario of a propagation model of variability, with inverse Compton upscatering as the emission mechanism, we have considered a number of cases for the periodic modulation: modulation of the plasma heating rate, cooling rate by external soft photons, and the amplitude of the reprocessed component. We have computed various observational characteristics which can be compared to good quality data. These include Fourier-frequency resolved spectra and results of cross-correlation analysis between light-curves at different energies. Each model of modulation predicts specific observational signatures, which help in identifying the physical processes driving QPO emission in accreting sources.
keywords:
accretion, accretion disc – instabilities – radiation mechanisms: thermal – binaries: close – X–rays: binaries1 Introduction
X–ray lightcurves from accreting compact objects (neutron star X–ray binaries, black hole X–ray binaries and active galactic nuclei) are generally non-periodic, showing significant variability in broad range of time scales. Consequently, their power spectra are broad, extending through a few decades in Fourier frequency (van der Klis 1995; Markowitz et al. 2003). Nevertheless, periodic, or quasi-periodic components appear often in the lightcurves of the stellar systems. Typically, these quasi-periodic oscillations (QPO) contain only a small fraction of total variability power, and are hardly, if at all, recognizable in lightcurves in the time domain. Usually, they are only clearly visible in power density spectra (PDS), where a large number of oscillations is co-added. The observed QPO frequencies range from Keplerian frequency near a surface of a neutron star (kilo-Hz QPO in some neutron star X–ray binaries) to below Hz (review in Wijnands 2001).
Despite the fact that a QPO component is almost never the dominant light curve component, their significance for our understanding of the accretion process should not be underestimated. In accreting black hole systems QPO features seem to appear preferentially when the state of the source is changing. For example, Rutledge et al. (1999) found correlations between spectral state transitions and QPO appearance in soft X–ray transient sources in Ginga data. Numerous works were devoted to study such correlations in good quality RXTE data (e.g., Cui et al. 1999; Kalemci et al. 2004; Rodriguez et al. 2004). In many neutron star X–ray binaries many long-lived QPO features were observed and studies of their time history revealed such interesting phenomena as saturation of QPO frequency with mass accretion rate (Kaaret et al. 1999) or “parallel tracks” phenomenon (van der Klis 2001 and references therein). This latter phenomenon is a hysteresis effect similar to that observed also on longer time scales in some black hole X-ray binaries (Maccarone & Coppi 2003). QPO offer also a method to constrain the mass of the central compact object, provided that their frequency is identified with a physical frequency of the system.
A variety of spectral/timing behaviour, including several types of QPO, is shown by the black hole binary (BHB) system GRS 1915+105. This is a peculiar source, most likely due to its high mass accretion rate (Sobolewska & Życki 2004; Done, Wardziński & Gierliński 2004). Recently, Miller & Homan (2005) noticed changes in the intensity of the Fe K fluorescent line at 6.4 keV during QPO period in this source. This is a potentially important clue to the origin of the periodicity, suggesting that variations occur in the relative configuration of the cold reprocessing matter and the X–ray source.
All of these demonstrate the importance of understanding the origin of the QPO features. Of course, given the variety of QPO components it is rather unlikely that a single mechanism could explain all of them, despite correlations between different QPO frequencies (Belloni, Psaltis & van der Klis 2002).
QPO models considered so far concentrated on identifying the frequencies of oscillations (see, e.g., Lee, Abramowicz & Kluźniak 2004 and references therein, and a review of QPO models in Psaltis 2001). Rather little attention was paid to the fact that it is the X–ray emission, which is modulated. A notable exception is the paper by Giannios & Spruit (2004), where a model of global oscillations of the hot inner flow interacting with outer cool disc was constructed. Oscillations are driven by feedback loop between heating the cool disc by ions from the hot flow and cooling of the hot disc by soft photons from the cool disc. The model predicts that r.m.s. variability of the QPO is highest at lower energies, therefore creating a rather soft QPO spectrum.
In this paper we address the problem of QPO origin from a complementary point of view, considering how such variable hard X–ray emission may be generated. Assuming that the X–ray are produced in the thermal (or hybrid thermal-nonthermal; Coppi 1999) Comptonization process (review in Zdziarski & Gierliński 2004), we construct a number of geometrical/phenomenological scenarios of oscillations. The main idea here is that – irrespectively of the physical mechanism – QPO may be driven by modulations of only a few physical parameters which determine the Comptonized spectrum: plasma heating rate, cooling rate by soft photons, amplitude of the reflected component (feedback between the heating and cooling), or a temperature of soft seed photons. It is also possible that a QPO is a simple geometrical effect of, for example, periodic obscuration of the source of emission. For each such case we predict various energy and timing characteristics which could be compared with observations. In particular, we emphasize the Fourier-frequency resolved spectroscopy as an important tool (Miyamoto et al. 1991; Revnivtsev, Gilfanov & Churazov 1999; Życki 2002; 2003, hereafter Z03).
2 The Model
The general scenario for time variability considered in this paper is a radial propagation model, as described in details in Z03 and Życki (2004). That is, we assume that X–rays are produced by structures propagating radially inwards, towards the central compact object (Kotov, Churazov & Gilfanov 2001). Dissipation of gravitational energy causes a flare of radiation as the structures are approaching the center. The X–rays are produced in inverse Compton process on thermal electrons, with the soft seed photons provided by optically thick cold accretion disc (review in Done 2002). Evolution of energy spectrum during a flare of radiation, from softer to harder, produces hard X-ray time lags – commonly observed in these sources (Poutanen & Fabian 1999; review in Poutanen 2001). The model reproduces also the Fourier-frequency resolved spectra (-spectra; Revnivtsev et al. 1999), which get harder with increasing Fourier frequency, at least in low/hard state of BHB (Z03). We employ the idea of flare avalanches to generate lightcurves with PDS of a doubly-broken power law form (Stern & Svensson 1996; Poutanen & Fabian 1999). The correlations between the flares (avalanches) go some way towards explaining the flux- relation of Uttley & McHardy (2001).
We note that the propagation model was formulated for low/hard state of BHB, whose spectral/timing properties are known best. QPO are mostly observed in softer/brighter states of BHB. However, there is certainly a continuity of spectral/timing properties when the sources make transitions between the states (see, e.g., Zdziarski & Gierliński 2004; Done & Gierliński 2004; Kubota & Done 2004), so it does seem reasonable to adopt the same general scenario for the soft states as well. On the other hand, data analyses do show differences between some timing properties in hard and soft states, for example in Fourier-frequency resolved spectra (Revnivtsev et al. 1999 for hard state; Sobolewska & Życki 2005 for soft state).
The flare of radiation is described by a specific time dependence of plasma heating rate, expressed as compactness parameter, , where is the luminosity and is the characteristic dimension of the emission region. We adopt the following descriptions of (Z03),
| (1) |
which describes the dissipation of gravitational energy in an accreting ring. Initial and final radial positions of the propagating structures are denoted and , respectively. is the duration of a flare, computed assuming motion of the emission region at a fraction of free-fall velocity (Z03).
The cooling of the plasma is described by cooling compactness, . In the basic model the main source of soft photons is reprocessing of hard X–rays, which is described as (Z03),
| (2) |
where has the meaning of a covering factor of the reprocessing matter. It is described by
| (3) |
i.e. it equals 1 when the emitting structure is above the cold disc, but it gradually decreases to 0 approaching the black hole. The decline of below the truncation radius, , has indeed to be rather gradual, as discussed in some detail in Z03; specifically the exponent is assumed .
As indicated above, the idea for generating a QPO is then to impose an additional periodic modulation of one or more of the above time dependencies. For example, if the QPO were a result of oscillations of the accretion disc, then irrespectively of physical origin of the oscillations, they could affect the flux of soft photons, or the temperature of the soft emission, , or the amplitude of the reflected component, , or some combinations of the above. This will produce a definite signature in, for example, energy dependence of QPO strength, or, related quantity, energy spectra computed at the QPO frequency.
The Comptonized spectra are computed with the eqpair code (Coppi 1999). The code computes thermal and pair balance of a spherical plasma cloud, given the heating rate of the plasma and cooling rate by soft photons, and other necessary parameters. It then computes the spectrum of emerging radiation. In our case, at each time step the heating and cooling compactnesses are calculated from eq. (1) and (2) with the additional periodic modulation as detailed below, and the spectrum of emergent radiation is computed. The reprocessed component is then added to it, with relative amplitude, , where is the solid angle of the reprocessor from the X–ray source. Narrow Fe K fluorescent line is added to the Compton reflected continuum. Its energy is fixed at 6.4 keV, while its equivalent width (EW) depends of the continuum slope (Życki & Czerny 1994; Z03), roughly covering the range of 1 to 1.3 keV.
A sequence of spectra is computed with total duration of 256 sec. with time step of 1/32 sec. It is then analysed using standard tools of Fourier analysis. The -spectra are computed as described in Revnivtsev et al. (1999) and Życki (2002). An implicit assumption here is that the radius of the flaring region is constant in time, that is, the flare luminosity is represented by the compactness parameter. One may imagine more complex models where both and vary, which may lead to luminosity–spectrum relations different than those presented in this paper.
3 Results
Computations are performed for a black hole system. Flare duration (travel time), , is generated from a probability distribution between sec and sec, so that the PDS roughly matches PDS of Cyg X-1 (Z03). Initially, is set to but it is set smaller for short flares, so that the propagation velocity does not exceed the free-fall velocity. The normalization constant in eq. (1) is such that the maximum of . The parameters are chosen so that the time average spectra are rather hard: normalization constant in eq. 2, , and , which give final spectrum with . The QPO frequency is assumed 1 Hz.
3.1 A test case – modulation of reflection amplitude
Let us consider first a simple case of modulation of amplitude of the reprocessed component, . That is, we use un-modified eqs. (1), (2) and (3) to describe heating and cooling of the plasma, but the reflection amplitude is
| (4) |
with and Hz. We call it a test case because it is not a self-consistent situation in our model, since should equal to the feedback function . It does, nevertheless, demonstrate well the meaning of the r.m.s. spectrum. The r.m.s. spectra were obtained by first fitting to the PDS in each energy channel a model consisting of a doubly broken power law,
| (5) |
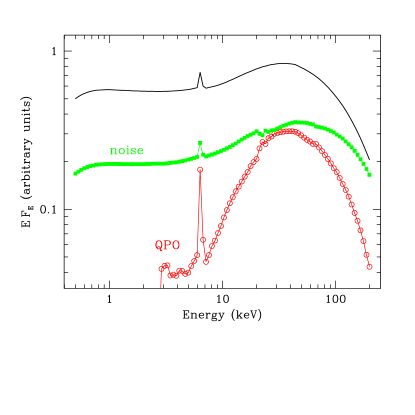
(where and ensure continuity of ), with a Lorentzian QPO feature. Fitted parameters are the overall normalization , two break frequencies , and normalization and width of the Lorentzian. The rms are then simply computed as integrals over of the continuum and the QPO. The QPO r.m.s. spectrum plotted in Fig. 1 reproduces the energy spectrum of the process which generated the QPO.
3.2 Modulation of the heating rate
Here we consider periodic modulation of the heating rate, . The motivation for this case comes from the description of broad band X–ray power spectra as a sum of a number of Lorentzians (e.g., Miyamoto et al. 1991; Nowak 2000). If taken seriously, it may be interpreted that X–rays (not only QPO) are emitted in the form of damped or forced oscillators. One might then imagine that a QPO is one of those oscillatory modes, of rather higher quality factor than oscillations producing the broad band noise. Furthermore, Maccarone, Coppi & Poutanen (2000) demonstrated that in the low/hard state the flares have to be driven by the heating rate rather than cooling flux of soft photons. Specifically, we assume then
| (6) |
where is start time of a given flare. The time is a global time, thus the above formula describes really a background modulation acting on a collection of flares, whose start time and durations are randomly generated from appropriate probability distributions (Z03). If the phase, , was constant, the modulation would be a perfectly periodic, thus producing a narrow feature in PDS. In order to produce a quasi-periodic modulation, we change the phase abruptly at random moments in time. Such a procedure is motivated by results of Morgan, Remillard & Greiner (1997), who found random walk of QPO phase in GRS 1915+105. Parameters and are constant.
Of crucial importance is the response of the soft flux, , to the modulation of . In the basic model of Poutanen & Fabian (1999) the soft flux comes only from reprocessing of hard X–rays, which means that the former must respond coherently to the variations of the latter. This assumption was made so that the model reproduces the spectral slope – reflection amplitude correlation observed in low/hard state (Zdziarski, Lubiński & Smith 1999). However, in soft states the disc emission usually dominates the hard X-ray emission, therefore we have to allow for the possibility that they are at least partially independent. Consequently, we consider also the situation where the soft flux might respond only to the flare of radiation, described by , but it does not respond to the quasi-periodic component.
3.2.1 Cooling rate responding to QPO
Here we assume that the flux of soft photons cooling the plasma is related to the heating as
| (7) |
that is, the soft flux comes from reprocessing of the entire flux of hard X–rays, including the quasi-periodic modulation. We assume that any delay in the response of is negligible. This is certainly correct for QPO of considered frequency, Hz, since the light travel time through is only s.
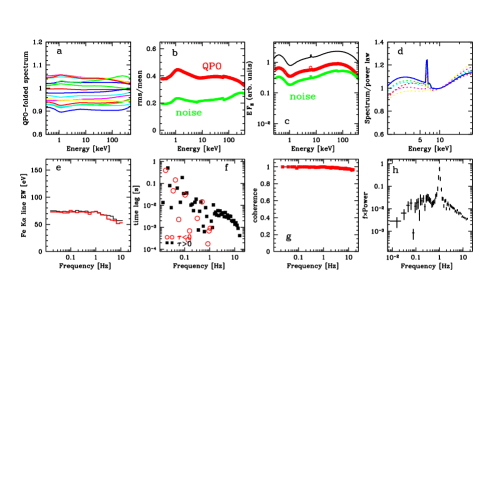
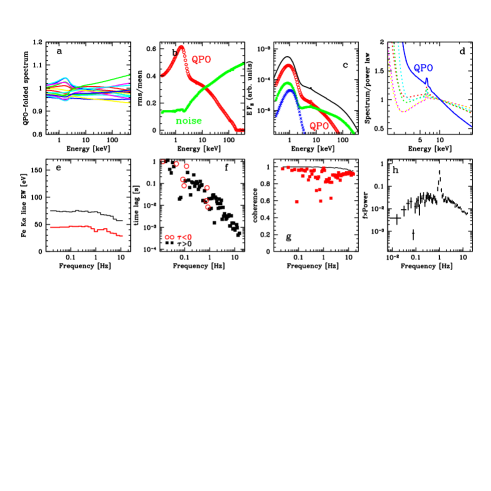
The results are presented in Fig. 2. Panel (a) shows the energy spectra folded with the period of the QPO, , and divided by the time average spectrum. No clear spectral evolution during the QPO is seen. This is obviously a consequence of eq. 7, since the spectral slope depends only on the ratio , which is unaffected by the QPO. Panel (b) shows the frequency-integrated r.m.s. variability as a function of energy for both the broad band noise component (excluding the QPO) and the QPO. This is computed as explained in Sec. 3.1. The QPO rms is basically independent of energy, again as a consequence of the lack of spectral variability. The noise rms increases somewhat with energy, because of the spectral evolution (hardening) during each flare. Panel (c) shows energy spectra in representation: time averaged spectrum, r.m.s. spectrum of the variable component and the QPO r.m.s. spectrum. The two latter spectra are simply the rms dependencies from previous panel multiplied by time averaged count rate . Panel (d) show the -spectra computed in the following ranges of : 0.04–0.06 Hz, 0.4–0.7 Hz, 0.9–1.3 Hz (QPO), 1.7–2.5 Hz, 4.1-6.1 Hz and 11–16 Hz. There is a weak overall trend for hardening of the spectra with and the QPO -spectrum (i.e. the spectrum at around ) is not much different than for other values of frequency111The QPO -spectrum is constructed from total around , i.e., containing contribution both from the broad band noise and the QPO, while the previously considered QPO r.m.s. spectrum was constructed from the component describing the QPO only. Panel (e) shows the equivalent width (EW) of the Fe K line as a function of Fourier frequency, comparing it to the basic case of no QPO. Again, in the considered case there is no additional signal at . Panels (f) and (g) show results of cross-correlation analysis of light curves at 3 keV and 9 keV. By construction, the model produces hard X–ray time lags. The time lags show what seems to be the only signature of QPO in the considered case, namely the lags show a clear minimum at . The coherence function is equal to 1 in almost entire range of , in particular there is no signature of QPO here. Finally, (h) shows the PDS from light curve at 9 keV.
3.2.2 Cooling rate not responding to QPO
In this case we assume that the soft flux comes from reprocessing of the non-periodic flare of hard X–rays only,
| (8) |
It is not entirely clear how this situation may be realized geometrically, since it would probably require a specifically anisotropic emission. It is nevertheless an interesting one to examine because of clear observational signatures. Results, plotted in Fig. 3 show an obvious pattern of spectral variability during the QPO: the brighter the spectra the harder they are222Note that our model produces a broad band PDS with a QPO, which means that individual spectra may not obey the trends; the trends are visible as the shapes of envelopes of QPO period-folded spectra.. A consequence of this is that the QPO rms increases with energy, and the QPO energy spectrum is much harder than the other -spectra. The harder QPO spectrum produces somewhat larger EW of the K line at . Similarly to the previous case, the 9 keV vs. 3 keV timelags show some sign changing around , and the coherence function remains equal to 1 at all .
3.3 Modulation of the soft flux
Here we assume that the flux of soft photons is additionally modulated in quasi-periodic manner. Again, we consider two situations: modulation of the flux with constant temperature of soft seed photons, and modulation of the flux with corresponding change of the soft photons temperature.
3.3.1 Constant soft photons temperature
We assume that the temperature of the soft seed photons is constant in time, while their flux is additionally modulated. Specifically, (eq. 1) and
| (9) |
where the square of the sine function assures that . Such form of could correspond to accretion disc pulsations modulating the intrinsic (rather than reprocessed) flux of soft photons. We now assume Hz, so that the QPO is still at 1 Hz in PDS.
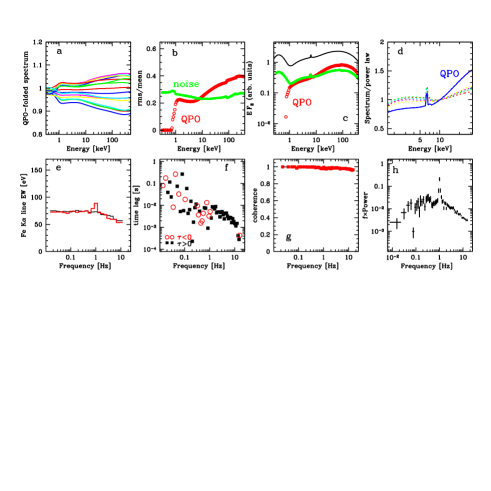
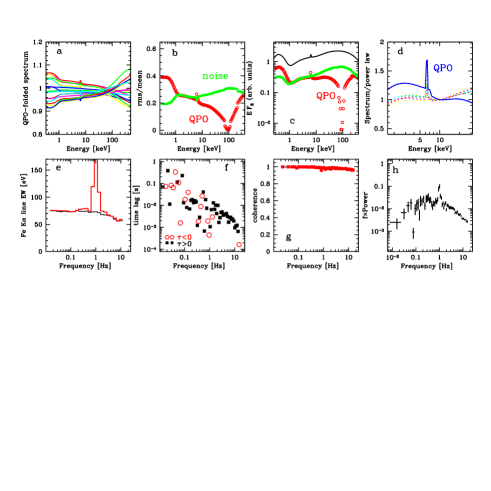
Spectral variability driven by the soft flux produce a characteristic pivoting behaviour, with the pivot energy intermediate between and . This is evident in our simulations presented in Fig. 4, where the pivot energy is about 20 keV. As a consequence, the rms has a broad minimum around 20 keV. The QPO spectrum is in consequence much softer than the other -spectra, at least up to keV. This in turn explains the small EW of K line at the QPO frequency. Time lags between 3 keV and 9 keV light curves do not show any clear feature at , but a sharp drop of the coherence function at is observed. This is caused by the existence of two independent Fourier components at : one from the broad band noise, the other from the QPO. The lack of QPO in PDS from the 9 keV light curve is consistent with the presence of minimum in rms.
3.3.2 Modulation of the seed photons temperature
We assume that the temperature of the soft photons, , is modulated as
| (10) |
and the corresponding modulation of the soft flux is given by
| (11) |
where we assume and Hz. The above form describes two sources of soft photons: in addition to the reprocessed photons, there is an additional flux from periodically modulated intrinsic dissipation. We assume that the geometrical dependence of the modulated flux is different than that of the reprocessed flux and that the covering factor does not appear in the second term in the expression for cooling compactness.
The results (Fig 5) are rather different than those for previous case of constant . Strongest variability is now at low energies, around , and its amplitude decreases with energy. Consequently, the QPO spectra are soft and the Fe K line EW is lower than our reference case. It does not show any clear feature at . Time lags do show some sign changes around , while the coherence shows a complex behaviour, with local minima around , but a maximum equal to 1 at . There is also a harmonic QPO at , which is related to the fact that the flux modulation is not a simple sinusoidal modulation. The harmonic is strong only at the energies where the soft flux appears.
3.4 Modulation of the covering factor of the reprocessor
Here we assume that the covering factor of cold matter is additionally quasi-periodically modulated,
| (12) |
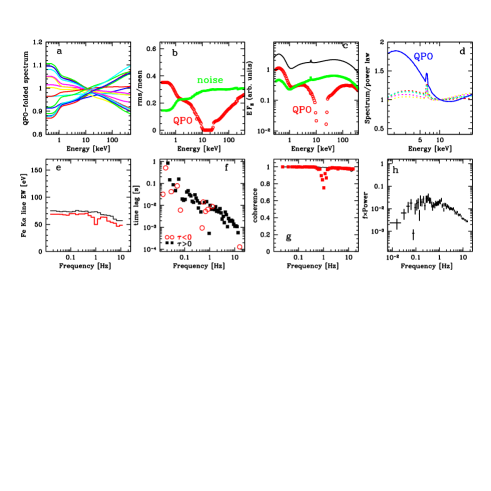
with , Hz, and generated as described earlier. Both the heating rate and cooling rate are described by their basic equations, eq. 1 and eq. 2, respectively. Compared to the previous case of modulation of , now the amplitude of the reprocessed component (Compton reflected continuum with consistent Fe K line) varies as well, . This scenario may correspond to disc warping due to, e.g., Lens–Thirring precession (e.g., Miller & Homan 2005). Results of computations are presented in Fig. 6. The QPO-folded energy spectra show clear pivoting around 30–50 keV. The variability of the K line with the QPO phase is noticeable even in those folded spectra. The QPO rms dependence shows an increase of variability rms at the line energy, and a broad minimum around 20–50 keV. The QPO spectrum is then softer than the other -spectra, while the EW of the K line has a sharp maximum at . This is a clear difference with the previous case of modulation, where a soft QPO spectrum was accompanied by a weak line. Here, the correlation between the spectral slope and amplitude of reflection is obeyed in the -spectra, because of eq. 2. Thus a soft continuum is accompanied by a strong reflection component, hence strong K line. The 3 vs. 9 keV time lags appear to reverse sign at (but are positive on both sides of it), but there is only very weak loss of coherence between the two light curves at .
3.5 Modulation of absorption column
One might imagine that modulation of the observed flux could be produced simply as a result of obscuration by an absorber. Here the results fall into either of two extreme categories. If the variable obscuration affects the source spectrum, the results are very complex. For example, the power spectra contain a number of strong harmonics at , , …of the fundamental frequency. Also the coherence function then shows a number of minima at the same ’s. This is obviously because the way the spectra are distorted by absorption is not linear in , thus the complexity appears even if is modulated periodically. On the other hand, if the absorber is very optically thick , so that practically no photons are transmitted and the only variable factor is the covering factor, then only the luminosity is modulated, but no spectral signatures are observed.
4 Discussion
We have constructed models of X–ray QPO in accreting compact systems, and computed specific energy-spectral properties of the QPO in each model. We have assumed general radial propagation model, where the X–ray emission is produced by structures moving radially towards the central black hole (Kotov et al. 2001; Z03). Assuming that the relevant radiative process is thermal Comptonization, we considered cases when the quasi-periodically modulated factor is plasma heating rate, cooling rate by soft photons, amplitude of the reprocessed component (feedback factor between the heating rate and cooling rate), or the temperature of soft photons. For each case we have constructed a set of observable quantities, which may be compared to good quality data. These are generally of two types: energy dependencies at various Fourier frequencies, and Fourier frequency dependencies, showing possible signatures at . QPO amplitude as a function of is the obvious characteristic, but it is really a powerful tool for constraining models only when used in conjunction with similar dependencies at other . Such Fourier spectra show distinct signatures at in most considered models. The QPO spectrum is harder than other -spectra when is modulated and does not respond fully to that modulation. The QPO spectrum is softer than other -spectra if the modulated factor is or the reflection amplitude, (assuming the latter controls the feedback between and ). The difference between modulation of and is in the behaviour of Fe K line as a function of : for modulation it shows local minimum at , while it shows local maximum at for modulation. The coherence function also differs between the case of and modulation: it shows a dip at (weaker coherence) in the former case only.
The significance of the presented models is in offering possibilities of providing hints as to the physical models of QPO. The basic question is whether the modulation occurs as a result of instabilities in the hot plasma or in the cold disc. The former would produce modulation of the heating rate, while the latter modulation of the cooling rate, soft photons temperature, reflection amplitude, or some combination of these. Candidates for the cold disc instabilities have been discussed in literature for some time now (review in Kato, Fukue & Mineshige 1998), but no work was done on consequences of these on X–ray spectra. This is of course not surprising because physical models of transitions between and interactions of the cold disc and hot corona are at a very early stages of development (Różańska & Czerny 2000, Giannios & Spruit 2004 and references therein).
Models presented in this paper certainly do not cover all possibilities. One can imagine other, more complex scenarios. In particular, we have assumed here purely thermal Comptonization, while most spectra of sources in bright soft states require hybrid thermal/non-thermal plasmas (Gierliński & Done 2003 and references therein). Fits to such spectra usually imply that both direct heating and injection of energetic non-thermal particles contribute to the energy input. One can then imagine that a modulation might affect one of those channels, or their relative importance. We discuss some of such models in Sobolewska & Życki (2005) as a possible description of low frequency QPO in XTE J1550-564 in anomalous very high state.
Generally, observational data on QPO energy dependencies from a number of black hole binaries point to a complex picture (Sobolewska & Życki 2005), although certain correlations do appear. The QPO r.m.s. spectra of sources in hard states seem to be softer than the time averaged spectra, while the QPO spectra of sources in soft state appear to be harder than time averaged spectra. According to our analysis, this would point to driving the modulation by plasma heating in soft state, while in the hard state the driver would be related to changes in the cold disc. This would correspond to the modes of long-term variability discussed for Cyg X-1 (Zdziarski et al. 2002), perhaps suggesting that the low frequency QPO (which appear preferentially during state transitions; Rutledge et al. 1999), are simply faster and more coherent version of the general variability pattern operating in a given spectral state. We discuss this in more detail in Sobolewska Życki (2005).
5 Conclusions
Signatures of quasi-periodic modulation of physical parameters in spectral and timing observables are complex, depending on details of a particular model. The QPO r.m.s. spectra can be harder than time average spectra if the the plasma heating rate is modulated. The QPO r.m.s. spectra can be softer than the time average spectrum if parameters of the cool disc are modulated: flux of cooling soft photons or covering factor of the cold plasma.
Acknowledgments
This work was partly supported by grants no. 2P03D01225 and PBZ-KBN-054/P03/2001 from the Polish State Committee for Scientific Research (KBN).
References
- [] Belloni T., Psaltis D., van der Klis M., 2002, ApJ, 572, 392
- [] Coppi P. S., 1999, in Poutanen J., Svensson R., eds, ASP Conf Ser. Vol. 161. Astron. Soc. Pac., San Francisco, p. 375 (astro-ph/9903158)
- [] Cui W., Zhang S. N., Chen W., Morgan E. H., 1999, ApJ, L32
- [] Done C., 2002, Philosophical Transactions of the Royal Society, 360, 1967 (astro-ph/0203246)
- [] Done C., Gierliński M., 2004, Prog. Theor. Phys. Supp., 155, 9 (astro-ph/0403546)
- [] Done C., Wardziński G., Gierliński M., 2004, MNRAS, 349, 393
- [] Giannios D. & Spruit H. C, 2004, A&A, 427, 251
- [] Gierliński M. & Done C., 2003, MNRAS, 342, 1083
- [] Kaaret P., Piraino S., Bloser P. F., Ford E. C., Grindlay J. E., Santangelo A., Smale A. P., Zhang W., 1999, ApJ, 520, L37
- [] Kalemci E., Tomsick J. A., Rothschild R. E., Pottschmidt K., Kaaret P., 2004, ApJ, 603, 231
- [] Kato S., Fukue J., Mineshige S., 1998, Black-Hole Accretion Disks, Kyoto University Press, Kyoto
- [] Kotov O., Churazov E., Gilfanov M., 2001, MNRAS, 327, 799
- [] Kubota A., Done C., 2004, MNRAS, 353, 980
- [] Lee W. H., Abramowicz M. A., Kluźniak W., 2004, ApJ, 603, L93
- [] Maccarone T. J., Coppi P. S., 2003, MNRAS, 338, 189
- [] Maccarone T. J., Coppi P. S., Poutanen J., 2000, ApJ, 537, L107
- [] Markowitz A., et al., 2003, ApJ, 593, 96
- [] Miller J. M., Homan J., 2005, ApJ, 618, L107
- [] Miyamoto S., Kimura K., Kitamoto S., Dotani T., Ebisawa K., 1991, ApJ, 383, 784
- [] Morgan E. H., Remillard R. A., Greiner J., 1997, ApJ, 482, 993
- [] Nowak M. A., 2000, MNRAS, 318, 361
- [] Poutanen J., 2001, AdSpR, 28, 267 (astro-ph/0102325)
- [] Poutanen J., Fabian A. C., 1999, MNRAS, 306, L31
- [] Psaltis D., 2001, AdSpR, 28, 481 (astro-ph/0012251)
- [] Revnivtsev M., Gilfanov M., Churazov E., 1999, A&A, 347, L23
- [] Rodriguez J., Corbel S., Hannikainen D. C., Belloni T., Paizis A., Vilhu O., 2004, ApJ, 615, 416
- [] Różańska A., Czerny B., 2000, A&A, 360, 1170
- [] Rutledge R. E. et al., 1999, ApJS, 124, 265
- [] Sobolewska M., Życki P. T., 2004, A&A, 400, 553
- [] Sobolewska M., Życki P. T., 2005, in preparation
- [] Stern B. E., Svensson R., 1996, ApJ, 469, L109
- [] Uttley P., McHardy I. M., 2001, MNRAS, 323, L26
- [] van der Klis M., 1995, in Lewin W. H. G., van Paradijs J., van den Heuvel E. P. J., eds, X–ray binaries, Springer, Berlin, p. 157
- [] van der Klis M., 2001, ApJ, 561, 943
- [] Wijnands R., 2001, AdSpR, 28, 469 (astro-ph/0008096)
- [] Zdziarski A. A., Gierliński M., 2004, Prog. Theor. Phys. Supp., 155, 99
- [] Zdziarski A. A., Lubiński P., Smith D. A., 1999, MNRAS, 303, L11
- [] Zdziarski A. A., Poutanen J., Paciesas W. S., Wen L., 2003, ApJ, 578, 357
- [] Życki P. T., 2002, MNRAS, 333, 800
- [] Życki P. T., 2003, MNRAS, 340, 639 (Z03)
- [] Życki P. T., 2004, MNRAS, 351, 1180
- [] Życki P. T., Czerny B., 1994, MNRAS, 266, 653