Specific star formation rates to redshift 5
from the FORS Deep Field
and the GOODS-S Field11affiliation: Based on observations collected at the European
Southern Observatory, Chile; proposal numbers 63.O-0005,
64.O-0149, 64.O-0158, 64.O-0229, 64.P-0150, 65.O-0048, 65.O-0049,
66.A-0547, 68.A-0013, and 69.A-0014. This work makes use of data
obtained by the ESO GOODS/EIS project under Program ID LP168.A-0485.
Abstract
We explore the build-up of stellar mass in galaxies over a wide redshift range by studying the evolution of the specific star formation rate (SSFR), defined as the star formation rate per unit stellar mass, as a function of stellar mass and age. Our work is based on a combined sample of galaxies from the FORS Deep Field and the GOODS-S field, providing high statistical accuracy and relative insensitivity against cosmic variance. As at lower redshifts, we find that lower-mass galaxies show higher SSFRs than higher mass galaxies, although highly obscured galaxies remain undetected in our sample. Furthermore, the highest mass galaxies contain the oldest stellar populations at all redshifts, in principle agreement with the existence of evolved, massive galaxies at . It is remarkable, however, that this trend continues to very high redshifts of . We also show that with increasing redshift the SSFR for massive galaxies increases by a factor of , reaching the era of their formation at and beyond. These findings can be interpreted as evidence for an early epoch of star formation in the most massive galaxies, and ongoing star-formation activity in lower mass galaxies.
Subject headings:
surveys — galaxies: evolution — galaxies: formation — galaxies: fundamental parameters — galaxies: high-redshift — infrared: galaxies1. Introduction
In recent years, there has been considerable interest in the relation of the stellar mass in galaxies and their star-formation rate (SFR), since this allows to quantify the contribution of the recent star formation to the build up of stellar mass for different galaxy masses. Cowie et al. (1996) used -band luminosities and [OII], H or ultraviolet (UV) fluxes to investigate this connection for a -selected sample of galaxies at and noted an emerging population of massive, heavily star forming galaxies at higher redshifts, a phenomenon they termed ‘downsizing’. Later on, the ‘specific SFR’ (SSFR), defined as the SFR per unit stellar mass, was used to study this relation.
Guzman et al. (1997) derived the SSFR for 51 compact galaxies at in the HDF flanking fields (Williams et al., 1996) finding no evidence for an increase of the peak SSFR with redshift. Brinchmann & Ellis (2000) studied 321 -selected field galaxies at and detected a clear upper limit on the SSFR moving to higher SFRs with increasing redshift. They conclude that the most massive galaxies must have formed the bulk of their stars before . Pérez-González et al. (2003) and Brinchmann et al. (2004) presented detailed investigations of the SSFR in the local universe, while Fontana et al. (2003) used a deep -selected sample of galaxies in the HDF-S (Casertano et al., 2000) to trace the SSFR to and found more evidence for higher SSFRs in the past, a result confirmed at by Bauer et al. (2005) using spectroscopic data for galaxies. Juneau et al. (2005) found clear evidence for downsizing in a sample of galaxies at from the GDDS, and Feulner et al. (2005) used the MUNICS data (Drory et al., 2001; Feulner et al., 2003) to study the SSFR of galaxies with photometric redshifts to , placing strong emphasis on the age of the stellar populations. They confirmed previous results on the rise of the SSFR with redshift, but found in addition that the highest mass galaxies are dominated by the oldest stellar populations at all redshifts.
Hammer et al. (2005) obtained 15m fluxes for galaxies and estimated that 15% of all galaxies are luminous IR galaxies with SSFRs well above the range usually found using other star-formation estimators. Bell et al. (2005b) investigated -selected galaxies at with photometric redshifts, % of which could be detected at m. They found that these galaxies typically have masses in the range and SFRs of up to . Pérez-González et al. (2005) used about 8000 sources selected at 24m to study the SSFR to , finding clear support for the downsizing picture.
In the following we present results on the SSFR of galaxies at in the FORS Deep Field (FDF) and the GOODS-S field, reaching higher redshifts than previous investigations. This letter is organized as follows: We introduce the galaxy sample and our method to derive the SSFR in Section 2. In Section 3 we present our results on the evolution of the SSFR with redshift. Section 4 gives a brief account on the influence of dust attenuation. In Section 5 we discuss different evolutionary paths in the SSFR–stellar mass diagram, before we summarize our findings in Section 6. Throughout we assume , and . All magnitudes are in the Vega system.
2. The Galaxy Samples
The FDF (Heidt et al., 2003) offers photometry in the , , , , , 834 nm, , and bands and is complimented by deep spectroscopic observations (Noll et al., 2004). In this letter we use the -selected sub-sample covering the deep central part of the field ( 40 arcmin2) as described in Gabasch et al. (2004a), containing 5557 galaxies down to .
Our -band selected catalog for the GOODS-S field (Salvato et al., in prep.) is based on the publicly available 8 arcmin2 , , VLT/ISAAC images and contains 3297 galaxies down to in 50 arcmin2. The and images are described in Arnouts et al. (2001), the , , and images in Schirmer et al. (2003). The data were analyzed in a very similar way to the FDF data and already used in Gabasch et al. (2004b) and Drory et al. (2005). Although both samples in itself are not large in area, having two different lines of sight helps to overcome some of the effects of cosmic variance. Furthermore, we chose our redshift intervals large enough to further minimize the effect.
Photometric redshifts are derived using the method described in Bender et al. (2001). We estimate the SFRs of our galaxies from the spectral energy distribution by deriving the luminosity at Å and converting it to an SFR as described in Madau et al. (1998) assuming a Salpeter initial mass function (Salpeter, 1955). Although this is an extrapolation for the lower redshift bins, the results agree very well with our work at lower redshifts (Feulner et al., 2005). Stellar masses are computed from the multi-color photometry using the same method as in Drory et al. (2005). It is described in detail and tested against spectroscopic and dynamical mass estimates in Drory, Bender & Hopp (2004). In brief, we derive stellar masses by fitting a grid of stellar population synthesis models by Bruzual & Charlot (2003) with a range of star formation histories (SFHs), ages, metallicities and dust attenuations to the broad-band photometry. We describe the SFHs by a two-component model consisting of a main component with a smooth SFH and a burst contributing up to 15% in mass. We allow SFH timescales Gyr, metallicities , ages between 0.01 Gyr and the age of the universe at the objects’ redshift, and independent extinction values of for the main component and the burst, respectively. We adopt a Salpeter initial mass function for both components, with lower and upper mass cutoffs of 0.1 and 100 . The SFR is corrected with the dust attenuation obtained for the burst component using the extinction curve of Calzetti (1997). Note that at higher redshift the uncertainty in the mass estimate increases since the observed band then probes the rest-frame blue or UV (Drory et al., 2005). We have verified the uncertainty in the mass estimate by comparing masses at lower redshifts from simulations with and without the NIR bands.
3. The Specific Star Formation Rate
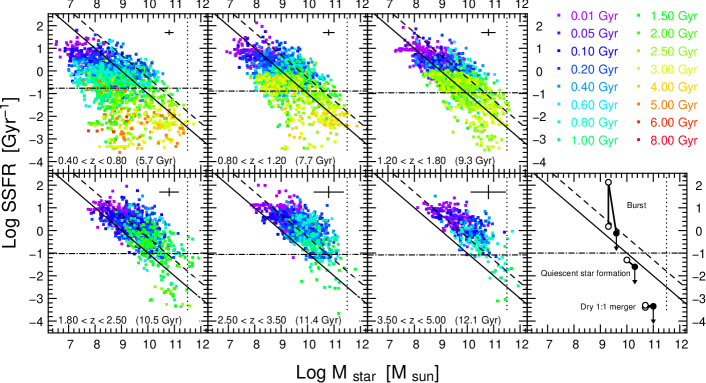
One way to explore the contribution of star formation to the growth of stellar mass in galaxies of different mass is to study the redshift evolution of the specific SFR (SSFR; Guzman et al. 1997; Brinchmann & Ellis 2000) which is defined as the SFR per unit stellar mass. In Figure 1 we present the SSFR as a function of stellar mass and age for six different redshift bins covering the range . We have convinced ourselves that the distributions of galaxies from the FDF and GOODS-S are in very good agreement.
Several effects can be observed in Fig. 1. The upper cut-off of the SSFR running essentially parallel to lines of constant SFR and shifting to higher SFRs with increasing redshift was already noted in earlier work (Brinchmann & Ellis, 2000; Feulner et al., 2005; Bauer et al., 2005). This trend seems to continue to the highest redshifts probed by our sample: While at we find , galaxies reach as much as at . Note that this upper envelope is partly due to a selection effect: Heavily dust obscured star bursts cannot be detected in our sample (see, e.g., Hammer et al., 2005; Pérez-González et al., 2005), but our conclusions still hold for galaxies not heavily affected by dust extinction (see the discussion below). Furthermore, it is evident from the distribution of ages in this diagram, that the most massive galaxies contain the oldest stellar populations, as has been shown already in Feulner et al. (2005) and Drory et al. (2005). This is in agreement with the ‘downsizing’ scenario (Cowie et al., 1996)
4. The role of dust
The influence of dust extinction on the determination of the SSFR is two-fold. First, heavily dust enshrouded objects might escape detection because too much of the optical light is absorbed. Secondly, objects might be detected, but their SFR (and stellar mass) might be underestimated because of the increasing dust extinction in the UV. We try to correct for the second effect by including dust attenuation in our model fitting, and correcting both the SFR and the stellar mass accordingly, but the correction will likely be underestimated for extremely dusty objects. It is more complicated, of course, to overcome the first effect.
In principle both sources of uncertainty could be overcome with observations in the thermal infrared (IR), where the radiation absorbed by the dust component is re-emitted. Note however, that this approach suffers from confusion and identification problems and also involves uncertainties in the conversion of the observed IR flux to the total IR flux, and in the unknown contribution of dust heating by old stellar populations, see, e.g., the discussion in Bell et al. (2005b).
Luminous IR galaxies (LIRGs) are a well known population of dusty galaxies with very high SFRs and thus also SSFRs (see, e.g., Hammer et al., 2005; Pérez-González et al., 2005). They can be interpreted as galaxies experiencing a brief episode of heavy star formation triggered by mergers or gas infall. Due to their limited gas supply, these galaxies would spend most of their time in a ‘normal’ state with lower SSFR. Therefore, although our survey misses dust enshrouded star forming galaxies, they can be considered as intermittent stages in the evolution of galaxies. In particular our results on the existence of massive evolved galaxies even at high redshifts remain unaffected.
5. Evolutionary paths
In order to understand the role of various evolutionary paths in Fig. 1, it is helpful to visualize schematically different ways to double a galaxy’s mass as shown in the lower right-hand panel of Fig. 1. In the following we will discuss these paths in more detail.
Quiescently star-forming galaxies: A galaxy doubling its stellar mass by quiescent star formation at moves along a line of constant SFR towards the lower right part of the diagram. Note that galaxies below the doubling line in Fig. 1 do not have enough time to double their mass until today.
Starbursts: In contrast to a quiescent galaxy, a starburst can increase its mass in a shorter time interval, provided it has enough gas to consume. Bursts of star formation may be triggered by gas inflow or galaxy interactions, and quickly move a galaxy to high SSFRs, where it stays for a brief period of time before it fades back to ‘normal’ SSFRs. Given the typical dusty nature of starburst galaxies, they might escape detection in optical surveys during this stage. However, since these bursts are typically brief, the galaxies spend most of their time with the quiescent galaxies. Note that the exact path depends on the details of the star formation history during the burst phase, however, the only relevant parameter for the final mass is the mass of the consumed gas.
Dry mergers: Two galaxies undergoing a dry merger (i.e. without interaction-induced star formation) basically move to the right in the diagram. We illustrate this with equal stellar mass mergers; the stellar mass clearly doubles, while the final SSFR is the average of the two initial SSFRs.
Note that the ‘true’ endpoint of the galaxies’ evolution will in all three cases likely be lower than shown, since all three processes diminish the limited gas supply. This is indicated by the down-ward pointing arrows.
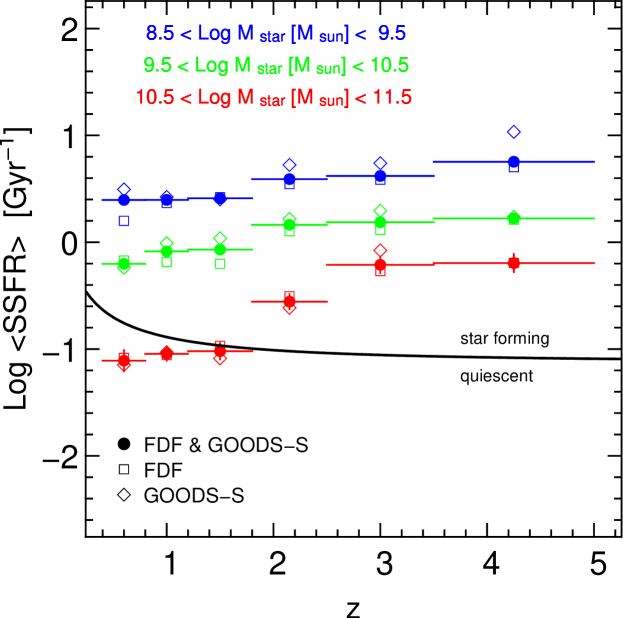
In the light of these evolutionary possibilities it is obvious that the only two ways to form massive galaxies with old stellar populations is by highly efficient early star formation in massive haloes, or by dry merging of less massive galaxies harboring old stars. Both scenarios can, in principle, be distinguished by analyzing the redshift dependence of the SSFR in the most massive galaxies. The result is presented in Fig. 2, where we show the average SSFR as a function of redshift for galaxies in three mass intervals. At redshifts , the most massive galaxies with are in a quiescent state with SSFRs not contributing significantly to their growth in stellar mass. However, at redshifts , the picture changes dramatically: The SSFR for massive galaxies increases by a factor of until we witness the epoch of their formation at and beyond. The fact that we miss galaxies at which have both high star-formation rate and mass, e.g. sub-mm galaxies at (e.g. Smail et al., 2002), might shift this formation epoch to lower redshifts, but does not affect our conclusions.
6. Discussion and Conclusions
It is remarkable that the most massive galaxies show evidence of harboring the oldest stellar populations at all redshifts. Our sample shows this effect robustly out to very high redshifts of . Note that this is in agreement with the findings of massive, evolved galaxies in the population of Extremely Red Objects (EROs) at (Saracco et al., 2003; Cimatti et al., 2004; Saracco et al., 2005; Longhetti et al., 2005) and among the Distant Red Galaxies (DRGs) at (Labbé et al., 2005). Apparently this trend continues to even higher redshifts, indicating a very early formation epoch for the most massive galaxies in the universe, favoring the ‘downsizing’ picture (Cowie et al., 1996).
| log SSFR | log SSFR | log SSFR | |
|---|---|---|---|
| (1) | (2) | (3) | |
| 0.60 | 0.40 0.04 | 0.20 0.03 | 1.11 0.10 |
| 1.00 | 0.40 0.02 | 0.09 0.03 | 1.04 0.06 |
| 1.50 | 0.41 0.02 | 0.07 0.02 | 1.02 0.08 |
| 2.15 | 0.59 0.03 | 0.16 0.03 | 0.56 0.07 |
| 3.00 | 0.62 0.03 | 0.19 0.02 | 0.21 0.08 |
| 4.25 | 0.75 0.04 | 0.22 0.04 | 0.20 0.08 |
Note. — The SSFR is given in units of Gyr-1. (1) . (2) . (3) .
This important finding is evident in Fig. 2, where we show the average SSFR of galaxies with different masses as a function of redshift. While at redshifts the most massive galaxies are in a quiescent state, at redshifts the SSFR for massive galaxies increases by a factor of reaching the epoch of their formation at and beyond. While there is evidence for dry merging in the field galaxy population (Faber et al., 2005; Bell et al., 2005a), this strong increase in the SSFR of the most massive galaxies suggests that at least part of this population was formed in a period of efficient star formation in massive haloes.
References
- Arnouts et al. (2001) Arnouts, S., et al. 2001, A&A, 379, 740
- Bauer et al. (2005) Bauer, A. E., Drory, N., Hill, G. J., & Feulner, G. 2005, ApJ, 621, L89
- Bell et al. (2005a) Bell, E. F., et al. 2005a, ApJ, submitted, astro-ph/0506425
- Bell et al. (2005b) Bell, E. F., et al. 2005b, ApJ, 625, 23
- Bender et al. (2001) Bender, R., et al. 2001, in Deep Fields, ed. S. Cristiani, A. Renzini, & R. E. Williams (Springer), 96
- Brinchmann et al. (2004) Brinchmann, J., Charlot, S., White, S. D. M., Tremonti, C., Kauffmann, G., Heckman, T., & Brinkmann, J. 2004, MNRAS, 351, 1151
- Brinchmann & Ellis (2000) Brinchmann, J., & Ellis, R. S. 2000, ApJ, 536, L77
- Bruzual & Charlot (2003) Bruzual, G., & Charlot, S. 2003, MNRAS, 344, 1000
- Calzetti (1997) Calzetti, D. 1997, AJ, 113, 162
- Casertano et al. (2000) Casertano, S., et al. 2000, AJ, 120, 2747
- Cimatti et al. (2004) Cimatti, A., et al. 2004, Nature, 430, 184
- Cowie et al. (1996) Cowie, L. L., Songaila, A., Hu, E. M., & Cohen, J. G. 1996, AJ, 112, 839
- Drory et al. (2004) Drory, N., Bender, R., Feulner, G., Hopp, U., Maraston, C., Snigula, J., & Hill, G. J. 2004, ApJ, 608, 742
- Drory et al. (2004) Drory, N., Bender, R., & Hopp, U. 2004, ApJ, 616, L103
- Drory et al. (2001) Drory, N., Feulner, G., Bender, R., Botzler, C. S., Hopp, U., Maraston, C., Mendes de Oliveira, C., & Snigula, J. 2001, MNRAS, 325, 550
- Drory et al. (2005) Drory, N., Salvato, M., Gabasch, A., Bender, R., Hopp, U., Feulner, G., & Pannella, M. 2005, ApJ, 619, L131
- Faber et al. (2005) Faber, S. M., et al. 2005, ApJ, submitted, astro-ph/0506044
- Feulner et al. (2003) Feulner, G., Bender, R., Drory, N., Hopp, U., Snigula, J., & Hill, G. J. 2003, MNRAS, 342, 605
- Feulner et al. (2005) Feulner, G., Goranova, Y., Drory, N., Hopp, U., & Bender, R. 2005, MNRAS, 358, L1
- Fontana et al. (2003) Fontana, A., et al. 2003, ApJ, 594, L9
- Fontana et al. (2004) Fontana, A., et al. 2004, A&A, 424, 23
- Gabasch et al. (2004a) Gabasch, A., et al. 2004a, A&A, 421, 41
- Gabasch et al. (2004b) Gabasch, A., et al. 2004b, ApJ, 616, L83
- Guzman et al. (1997) Guzman, R., Gallego, J., Koo, D. C., Phillips, A. C., Lowenthal, J. D., Faber, S. M., Illingworth, G. D., & Vogt, N. P. 1997, ApJ, 489, 559
- Hammer et al. (2005) Hammer, F., Flores, H., Elbaz, D., Zheng, X. Z., Liang, Y. C., & Cesarsky, C. 2005, A&A, 430, 115
- Heidt et al. (2003) Heidt, J., et al. 2003, A&A, 398, 49
- Juneau et al. (2005) Juneau, S., et al. 2005, ApJ, 619, L135
- Labbé et al. (2005) Labbé, I., et al. 2005, ApJ, 624, L81
- Longhetti et al. (2005) Longhetti, M., et al. 2005, MNRAS, 361, 897
- Madau et al. (1998) Madau, P., Pozzetti, L., & Dickinson, M. 1998, ApJ, 498, 106
- Noll et al. (2004) Noll, S., et al. 2004, A&A, 418, 885
- Pérez-González et al. (2005) Pérez-González, P., et al. 2005, ApJ, in press, astro-ph/0505101
- Pérez-González et al. (2003) Pérez-González, P. G., Gil de Paz, A., Zamorano, J., Gallego, J., Alonso-Herrero, A., & Aragón-Salamanca, A. 2003, MNRAS, 338, 525
- Salpeter (1955) Salpeter, E. E. 1955, ApJ, 121, 161
- Saracco et al. (2005) Saracco, P., et al. 2005, MNRAS, 357, L40
- Saracco et al. (2003) Saracco, P., et al. 2003, A&A, 398, 127
- Schirmer et al. (2003) Schirmer, M., Erben, T., Schneider, P., Pietrzynski, G., Gieren, W., Carpano, S., Micol, A., & Pierfederici, F. 2003, A&A, 407, 869
- Smail et al. (2002) Smail, I., Ivison, R. J., Blain, A. W., & Kneib, J.-P. 2002, MNRAS, 331, 495
- Williams et al. (1996) Williams, R. E., et al. 1996, AJ, 112, 1335