Morphology of the coronal line region in active galactic nuclei
Abstract
We present new images111Observations done under ESO/VLT programs 70.B-0409 and 74.B-0404 of the coronal line region, as traced by [Si VII] 2.48 , in some of the nearest Seyfert 2 galaxies. In each of these galaxies, the coronal line emission comprises a bright, compact central source and extended emission showing broad alignment along a particular direction, usually coinciding with that defined by the radio emission or the extended narrow line region. The full extent of the coronal line emission ranges from few tens of pc to 150 pc radius from the nucleus and is a factor smaller than that seen in the extended, lower-ionization gas. With a spatial resolution of 10 pc or better, the coronal region shows diffuse and filamentary structure in all cases, and it is difficult to see whether it breaks down into discrete blobs as those seen in lower-ionization-lines- or radio- images of comparable resolution. The extent of the coronal line emission is larger than would be predicted by photoionization models, which argues for additional in-situ gas excitation, the most plausible energy source being shock-excitation.
keywords:
galaxies:nuclei – galaxies:Seyfert – infrared:galaxies1 Introduction
Coronal lines are collisionally excited forbidden transitions within low-lying levels of highly ionized species (IP 100 eV). As such, these lines form in extreme energetic environments and thus are unique tracers of AGN activity; they are not seen in starburst galaxies. Coronal lines appear from X-rays to IR and are common in Seyfert galaxies regardless of their type (Penston et al. 1984; Marconi et al. 1994; Prieto & Viegas 2000). The strongest ones are seen in the IR; in the near-IR they can even dominate the line spectrum (Reunanen et al. 2003).
Owing to the high ionization potential, these lines are expected to be limited to few tens to hundred of parsec around the active nucleus. On the basis of spectroscopic observations, Rodriguez-Ardila et al. (2004, 2005) unambiguously established the size of the coronal line region (CLR) in NGC 1068 and the Circinus Galaxy, using the coronal lines [SiVII] 2.48 , [SiVI] 1.98 ,̃, [Fe vii] 6087Å, [Fe x] 6374 Å and [Fe xi] 7892 ÅṪhey find these lines extending up to 20 to 80 pc from the nucleus, depending on ionization potential. Given those sizes, we started an adaptive-optics-assisted imaging program with the ESO/VLT aimed at revealing the detailed morphology of the CLR in some of nearest Seyfert galaxies. We use as a tracer the isolated IR line [Si VII] 2.48 (IP=205.08 eV). This letter presents the resulting narrow-band images of the [Si VII] emission line, which reveal for the first time the detailed morphology of the CLR, and with suitable resolution for comparison with radio and optical- lower-ionization-gas images. The morphology of the CLR is sampled with a spatial resolutions almost a factor 5 better than any previously obtained, corresponding to scales 10 pc. The galaxies presented are all Seyfert type 2: Circinus, NGC 1068, ESO 428-G1 and NGC 3081. Ideally, we had liked to image type 1 objects, but, in the Southern Hemisphere, there are as yet no known, suitable type 1 sources at sufficiently low redshift to guarantee the inclusion of [Si VII] 2.48 entirely in the filter pass-band.
2 Observations, image registration and astrometry
Observations were done with the adaptive-optics assisted IR camera NACO at the ESO/VLT. Two narrow band filters, one centered on the coronal [SiVII] 2.48 line and an adjacent band centered on 2.42 line-free continuum, were used. The image scale was 0.027 arcsec pixel-1 in all cases, 0.013 arcsec pixel-1 in NGC 1068. Integration times were chosen to keep the counts within the linearity range: minutes per filter and source. For each filter, the photometry was calibrated against standard stars observed after each science target. These stars were further used as PSF when needed and for deriving a correction factor that normalizes both narrow-band filters to provide equal number of counts per a given flux. In deriving this factor it is assumed that the continuum level in the stars is the same in both filters and not emission lines are not present. The wavefront sensor of the adaptive optics system followed the optical nucleus of the galaxies to determine seeing corrections.
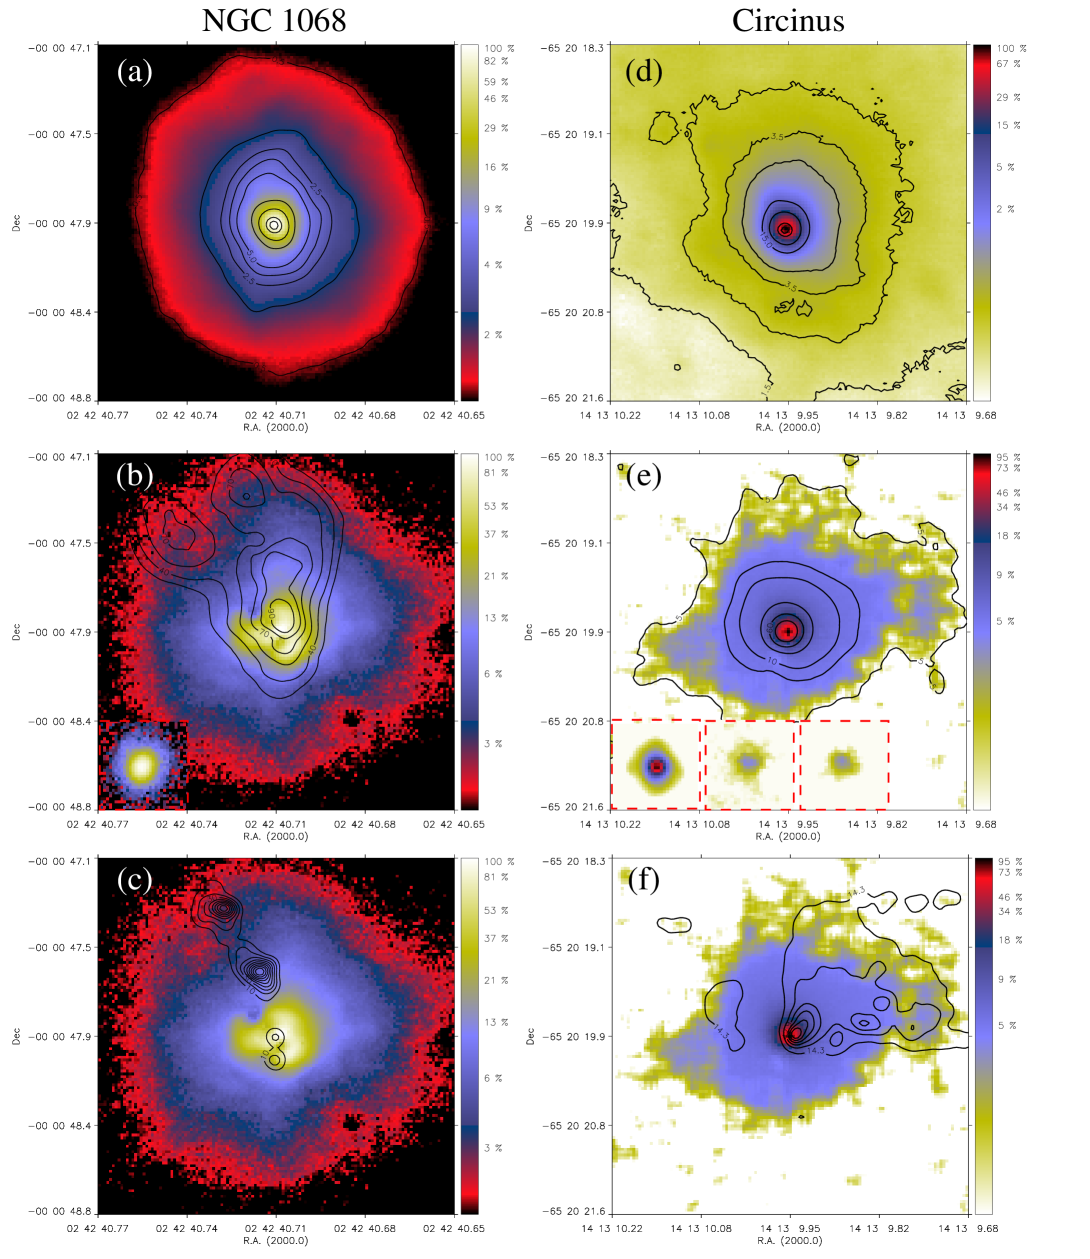
The achieved spatial resolution was estimated from stars available in the field of the galaxies when possible; this was not possible in NGC 3081 and NGC 1068 (cf. Table 1). The resolutions were comparable in both filters within the reported errors in Table 1. Continuum-free [SiVII]2.48 line images are shown in Figs. 1 and 2 for each galaxy. These were produced after applying the normalization factor derived from the standers stars. The total integrated coronal line emission derived from these images is listed in Table 2. For comparison, [SiVII] 2.48 fluxes derived from long-slit spectroscopy are also provided.
Also in these figures, images with the 2.48 f̃ilter of the standard stars -also used as PSF’s control- are shown. The images provide a rough assessment of the image quality/resolution achieved in the science frames. For the case of Circinus and ESO 428-G014, a more accurate evaluation is possible from the images of a field star. One of these field star is shown in both filters in Figs. 1e and 2b respectively.. To get an assesment of the image quality at the lowest signal levels, the images of the field stars in particular are normalized to the galaxy peak at the corresponding filter. These are much fainter than the galaxy nucleus, thus, the star peak is a mere 5% of the galaxy peak.
| AGN | Seyfert | 1 arcsec | Stars | FWHM | FWHM | Size of nucleus |
|---|---|---|---|---|---|---|
| type | in pc | in field | arcsec | pc | FWHM arcsec | |
| Circinus | 2 | 19 | 2 | 0.190.02 | 3.6 | 0.27 |
| NGC 1068 | 2 | 70 | 0 | 0.097∗ | 6.8 | 0.097 |
| ESO 428-G014 | 2 | 158 | 3 | 0.0840.006 | 13 | 0.150.01 |
| NGC 3081 | 2 | 157 | 0 | 0.095∗ | 14 | 0.32 |
| AGN | Radius from nucleus | Flux NACO | Flux long-slit | Reference long-slit |
| pc | in units of erg s-1 cm-2 | |||
| Circinus | 30 | 20 | 16 | Oliva et al. 1994 |
| NGC 1068 | 70 | 72 | 47∗ | Reunanen et al. 2003 |
| ESO 428-G014 | 120 - 160 | 2.0 | 0.7∗ | Reunanen et al. 2003 |
| NGC 3081 | 120 | 0.8 | 0.8∗ | Reunanen et al. 2003 |
Radio and HST images were used, where available, to establish an astrometric reference frame for the CLR in each of the galaxies. For NGC 1068 (Fig 1a, b, & c), the registration of radio, optical HST and adaptive-optics IR images by Marco et al. (1997; accuracy 0.05”) was adopted. The comparison of the [SiVII] 2.48 line image with the HST [OIII] 5007 Å followed by assuming the peak emission in Marco’s et al. K-band image to coincide with that in the NACO 2.42 continuum image. The comparison with the MERLIN 5 GHz image of Gallimore et al. (2004) was done assuming that the nuclear radio source ’S1’ and the peak emission in the NACO 2.42 image are coinciding.
In Circinus (Fig. 1d, e & f), the registration of NACO and HST/ images was done on the basis of 3–4 stars or unresolved star clusters available in all fields. That provides an accurate registration better than 1 pixel (see Prieto et al. 2004). No radio image of comparable resolution is available for this galaxy.
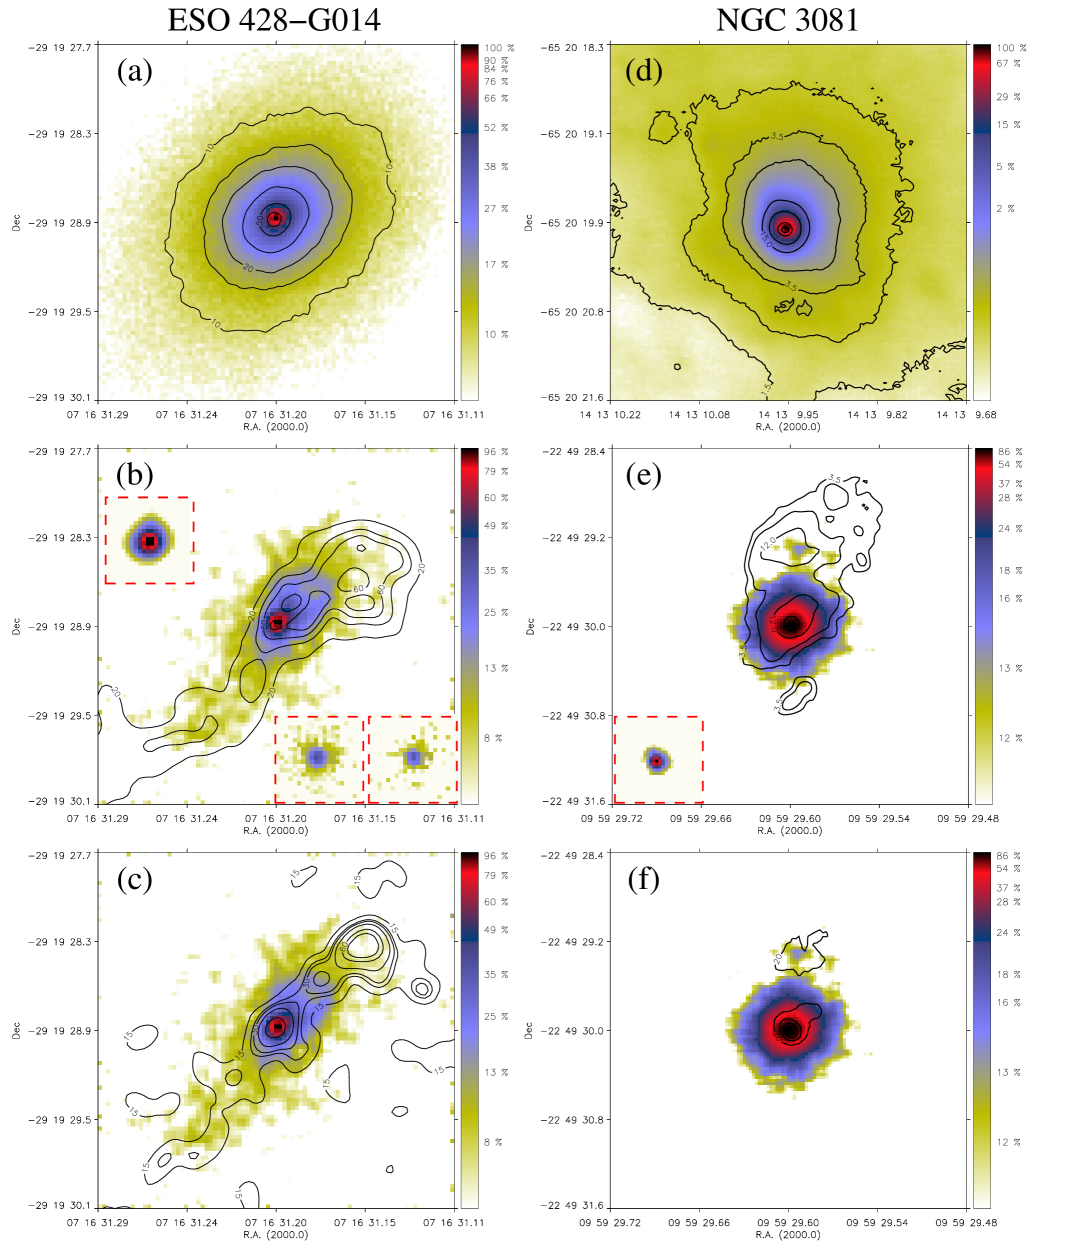
For ESO 428-G014 (Fig. 2a, b, & c), NACO images were registered on the basis of 3 available stars in the field. Further registration with a VLA 2 cm image (beam 0.2”; Falcke, Wilson & Simpson 1998) was made on the assumption that the continuum peak at 2.42 coincides with that of the VLA core. We adopted the astrometry provided by Falcke et al. (uncertainty 0.3”) who performed the registration of the 2 cm and the HST/H images, and plotted the HST/H atop the NACO coronal line image following that astrometry.
NGC 3081 (Fig. 2d, e, & f) has no stars in the field. In this case NACO 2.42 and 2.44 images, and an additional NACO deep Ks-band image, were registered using the fact that the NACO adaptive optics system always centers the images at the same position of the detector within 1 pixel (0.027”). The registration with a HST/WFPC2 image at 7910Å (F791W), employed as a reference the outer isophote of the Ks-band image which show very similar morphology to that seen in the HST 7910Å image. Further comparison with an HST PC2 image relied on the astrometry by Ferruit et al. (2000). The registration with an HST/FOC UV image at 2100Å (F210M) was based on the assumption that the UV nucleus and the continuum peak emission at 2.42 2.42 coincides. The radio images available for this galaxy have a beam resolution (Nagar et al. 1999), which includes all the detected coronal extended emission, and are therefore not used in this work.
3 The size and morphology of the coronal line region
In the four galaxies, the CLR resolves into a bright nucleus and extended emission along a preferred position angle, which usually coincides with that of the extended lower-ionization gas. The size of the CLR is a factor 3 to 10 smaller than the extended narrow line region (NLR). The maximum radius (Table 2) varies from 30 pc in Circinus to 70 pc in NGC 1068, to 120 pc in NGC 3081 and ESO 428-G014. The emission in all cases is diffuse or filamentary, and it is difficult to determine whether it further breaks down into compact knots or blobs such as those found in H, [OIII] 5007Å or radio images even though the resolutions are comparable.
In Circinus, [SiVII]2.48 emission extends across the nucleus and aligns with the orientation of its one-sided ionization cone, seen in H, or in [OIII] 5007 Å. In these lines, the counter-cone is not seen (Wilson et al. 2002), but in [SiVII], presumably owing to the reduced extinction, extended diffuse emission is detected at the counter-cone position (Fig. 1f; Prieto et al. 2004). This has been further confirmed with VLT/ISAAC spectroscopy which shows both [SiVII]2.48 and [SiVI] 1.96 extending up to 30 pc radius from the nucleus (Rodriguez-Ardila et al. 2004). In the coronal line image, the North-West emission is defining an opening cone angle larger than that in . The morphology of [SiVII] in this region is suggestive of the coronal emission tracing the walls of the ionization cone (see fig. 1f).
In ESO 428-G014, the coronal emission is remarkably aligned with the radio-jet (Fig. 2c). The 2 cm emission is stronger in the northwest direction, and [SiVII] is stronger in that direction too. H emission is also collimated along the radio structure, but the emission spreads farther from the projected collimation axis and extends out to a much larger radius from the nucleus than the coronal or radio emission (Fig. 2b). Both H and the 2 cm emission resolve into several blobs but the coronal emission is more diffuse.
In NGC 3081, the coronal emission resolves into a compact nuclear region and a detached faint blob at 120 pc north of it. The HST [OIII] 5007 and H images show rather collimated structure extending across the nucleus along the north-south direction over 300 pc radius (Ferruit et al. 2000). Besides the nucleus, the second brightest region in those lines coincides with the detached [Si VII] emission blob (Fig. 2d). At this same position, we also find UV emission in a HST/FOC image at 2100 Å.
NGC 1068 shows the strongest [Si VII] 2.48 emission among the four galaxies, a factor three larger than in Circinus, and the only case where the nuclear emission shows detailed structure. At radius from the radio core S1, [Si VII] emission divides in three bright blobs. The position of S1 falls in between the blobs. The southern blob looks like a concentric shell. The northern blob coincides with the central [OIII] peak emission at the vortex of the ionization cone; the other two blobs are not associated with a particular enhancement in [OIII] or radio emission (Fig. 1b & c). [Si VII] depression at the position of S1 may indicate a very high ionization level at already 7 pc radius (our resolution) from the center; the interior region might instead be filled with much higher ionization-level gas, e.g. [FeX], [Si IX] and higher. This central structure, 14 pc radius in total, is surrounded in all directions by much lower surface brightness gas, extending up to at least 70 pc radius. The presence of this diffuse region is confirmed by VLT/ISAAC spectra along the north-south direction, which reveal [SiVI]1.96 and [Si VII]2.48 extending at both sides of the nucleus up to comparable radii (Rodriguez-Ardila et al. 2004, 2005). This diffuse emission shows slight enhancement at both sides of the 5 GHz jet, but there otherwise appears no direct correspondence between the CLR and radio morphology.
4 Discussion
ESO 438-G014 and NGC 3081 show the largest and best collimated [SiVII] emission, up to 150 pc radius from the nucleus. To reach those distances by nuclear photoionization alone would require rather low electron densities or a very strong (collimated) radiation field. Density measurements in the CLR are scarce: Moorwood et al. (1996) estimate a density in Circinus on the basis of [NeV] 14.3 /24.3 ; Erkens et al. (1997) derive in several Seyfert 1 galaxies, on the basis of several optical [FeVII] ratios. This result may be uncertain because the optical [Fe VII] are weak and heavily blended. Taking as a reference value, it results in an ionization parameter U at 150 pc from the nucleus, which is far too low to produce strong [SiVII] emission (see e.g Ferguson et al. 1997; Rodriguez-Ardila et al. 2005).
We argue that, in addition to photoionization, shocks must contribute to the coronal emission. This proposal is primarily motivated by a parallel spectroscopic study of the kinematics of the CLR gas of several Seyfert galaxies (Rodriguez-Ardila et al. 2005), which reveals coronal line profiles with velocities 500 2000 . Here we assess the proposal in a qualitative manner, by looking for evidence for shocks from the morphology of the gas emission.
In ESO 428-G014, the remarkable alignment between [Si VII] and the radio emission is a strong indication of the interaction of the radio jet with the ISM. There is spectroscopic evidence of a highly turbulent ISM in this object: asymmetric emission line profiles at each side of the nucleus indicate gas velocities of up to 1400 (Wilson & Baldwin 1989). Shocks with those velocities heat the gas to temperatures of , which will locally produce bremsstrahlung continuum in the UV – soft X-rays (Contini et al. 2004) necessary to produce coronal lines. [Si VII] 2.48 with IP = 205.08 eV eV will certainly be enhanced in this process.
The concentric shell-like structure seen in NGC 3081 in [OIII] 5007 Å and H (Ferruit et al. 2000) is even more suggestive of propagating shock fronts. From the [OIII]/H map by Ferruit et al., the excitation level at the position of the [Si VII] northern blob is similar to that of the nucleus, which points to similar ionization parameter despite the increasing distance from the nucleus. The cloud density might then decrease with distance to balance the ionization parameter, but this would demand a strong radiation field to keep line emission efficient. Alternatively, a local source of excitation is needed. The presence of cospatial UV continuum, possibly locally generated bremsstrahlung, and [Si VII] line emission circumstantially supports the shock-excitation proposal.
In the case of Circinus and NGC 1068, the direct evidence for shocks from the [Si VII] images is less obvious. In NGC 1068, the orientation of the three blob nuclear structure does not show an obvious correspondence with the radio-jet; it may still be possible we missed the high velocity coronal gas component measured in NGC 1068 in our narrow band filter. In Circinus, there are not radio maps of sufficient resolution for a meaningful comparison. However, both galaxies present high velocity nuclear outflows, which are inferred from the asymmetric and blueshifthed profiles measured in the [OIII] 5007 gas in the case of Circinus (Veilleux & Bland-Hawthorn 1997), and in the Fe and Si coronal lines in both. In the latter, velocities of 500 in Circinus and 2000 in NGC 1068 are inferred from the coronal profiles (Rodriguez-Ardila et al. 2004, 2005).
An immediate prediction for the presence of shocks is the production of free-free emission, with a maximum in the UV- – X-ray, from the shock-heated gas. We make here a first order assessment of this contribution using results from photoionization - shocks composite models by Contini et al. (2004), and compare it with the observed soft X-rays. For each galaxy, we derive the 1 keV emission due to free-free from models computed for a nuclear ionizing flux, , pre-shock density and shock velocity closer to the gas velocities measured in these galaxies (we use figure A3 in Contini et al.). The selection of this high- ionizing-flux value has a relative low impact does on the 1 keV emission estimate as the bremsstrahlung emission from this flux drops sharply shortwards the Lyman limit; the results are more depending on the strength of the post-shock bremsstrahlung component, this being mainly dominated by the shock velocity and peaks in the soft X-rays (see fig. A3 in Contini et al. for illustrative examples). Regarding selection of densities, pre-shock densities of a few hundred actually imply densities downstream (from where shock-excited lines are emitted) a factor of 10 - 100 higher, the higher for higher velocities, and thus whitin the range of those estimated from coronal line measureemnts (see above).
Having selected the model parameters, we further assume that the estimated 1 keV emission comes from a region with size that of the observed [Si VII] emission. Under those premises, the results are as follows. For NGC 1068, assuming the free-free emission extending uniformly over a region (cf. Table 1), and models for shock velocities of 900 , the inferred X-ray flux is larger by a factor of 20 compared with the nuclear 1 keV Chandra flux derived by Young et al. (2001). One could in principle account for this difference by assuming a volume filling factor of 5-10%, which in turn would account for the fact that free-free emission should mostly be produced locally at the fronts shock.
In the case of Circinus, following the same procedure, we assume a free-free emission size of (cf. Table 1), and models of shock velocities of 500 (see above). In this case, the inferred X-ray flux is lower than the 1 keV BeppoSAX flux, as estimated in Prieto et al. (2004), by an order of magnitude. For the remaining two galaxies, we assume respective free-free emission areas (cf. Table 1) of 300 pc x 50 pc for ESO 428-G014 – the width of [Si VII] is in the direction perpendicular to the jet – and for NGC 3081 – in this case, free-free emission is assumed to come from the nucleus and the detached [Si VII] region North of it only. Taking the models for shocks velocities of 900 , the inferred X-ray fluxes, when compared with 1 KeV fluxes estimated from BeppoSAX data analysis by Maiolino et al. (1998), are of the same order for ESO 428-G014 and about an order of magnitude less in NGC 3081.
The above results are clearly dominated by the assumed size of the free-free emission region, which is unknown. The only purpose of this exercise is to show that under reasonable assumptions of shock velocities, as derived from the line profiles, the free-free emission generated by these shocks in the X-ray could be accommodated within the observed soft X-ray fluxes.
We thank Heino Falcke who provided us with the 2 cm radio image of ESO 428-G014, and Marcella Contini for a thorough review of the manuscript.
References
- Contini et al. (2004) Contini, M., Viegas, S. & Prieto, M.A. 2004 MNRAS 348, 1065
- Erkens et al. (1997) Erkens, U., Appenzeller, I., Wagner, S. 1997, A&A 323, 707
- Falke et al. (1999) Falcke, H., Wilson, A. & Simpson, C., 1998, ApJ 502, 199
- Ferguson et al. (1997) Ferguson, J. W.; Korista, Kirk T.; Ferland, G. 1997, ApJSS 110, 287
- Ferruit et al. (2000) Ferruit, P., Wilson, A., Mulchaey, J. 2000, ApJS 128, 139
- Gallimore et al. (2004) Gallimore, J., Baum, S. A., O’Dea, C. P., 2004, ApJ 613, 794
- Marco et al. (1997) Marco, O., Alloin, D. & Beuzit J. L. 1997, A&A, 320, 399
- Marconi, A. et al. (1994) Marconi, A., Moorwood, A. F. M., Salvati, M., Oliva, E. 1994, A&A 291, 18
- (9) Maiolino et al. 1998, A&A 338, 781
- Moorwood et al. (1996) Moorwood et al. A&A 315L, 109
- Nagar et al. (1999) Nagar. N., Wilson, A., Mulchaey, J. & Gallimore, J. 1999, ApJSS 120, 209
- Oliva et al. (1994) Oliva, E., Salvati, M., Moorwood, A. F. M., & Marconi, A. 1994, A&A, 288, 457
- Penston et al. (1984) Penston, M., Fosbury, R. A. E., Boksenberg, A., Ward, M. J., & Wilson, A. S. 1984 MNRAS 208, 347.
- Prieto et al. (2004) Prieto et al. 2004, ApJ 614, 135
- Prieto et al. (2000) Prieto M.A. & Viegas, S. 2000, ApJ 532, 238
- Reunanen et al. (2003) Reunanen, J., Kotilainen, J. & Prieto M. A., 2003, MNRAS 343, 192
- Rodriguez-Ardila et al. (2004) Rodriguez-Ardila, A., Prieto, M. A., Viegas, S. & Gruenwald, R. 2004, in Proceedings of the IAU 222, Ho, C. & Schmitt, H. eds., Cambridge University Press, 2004., p. 283
- Rodriguez-Ardila et al. (2005) Rodriguez-Ardila, A., Prieto, M. A., Viegas, S. & Gruenwald, R. 2005, in preparation.
- (19) Veilleux, S. & Bland-Hawthorn, J. 1997, ApJ 479, L105
- (20) Weigelt, G. et al. 2004, A&A 425, 77
- Wilson et al. (0000) Wilson, A. S., Shopbell, P. L., Simpson, C., Storchi-Bergmann, T. Barbosa, F. K. B., & Ward, M. J. 2000, ApJ, 120, 1325
- Wilson & Baldwin (1989) Wilson, A. S. & Baldwin, J. A. 1980, AJ 99, 2056
- (23) Young, A., Wilson, A. S. & Shopbell, P.L., 2001, ApJ 556, 23