Swift XRT Observations of the Breaking X–ray Afterglow
of GRB 050318
We report the results of Swift X–Ray Telescope (XRT) observations of GRB 050318. This event triggered the Burst Alert Telescope (BAT) aboard Swift and was followed-up with XRT and UVOT for 11 consecutive orbits starting from 54 minutes after the trigger. A previously unknown fading X–ray source was detected and accurately monitored. The source was found to decrease in intensity with time and a clear temporal break occurring at 18000 s after the trigger was observed. The X–ray light curve was found to be consistent with a broken power-law with decay indices and before and after the break. The spectrum of the X–ray afterglow was well described by a photoelectrically absorbed power-law with energy index of . No evidence of spectral evolution was found. We compare these results with those obtained with UVOT and separately reported and refine the data analysis of BAT. We discuss our results in the framework of a collimated fireball model and a synchrotron radiation emission mechanism. Assuming the GRB redshift derived from the farthest optical absorption complex (), the event is fully consistent with the – correlation.
Key Words.:
gamma rays: bursts – X–rays: individual (GRB 050318)1 Introduction
Following the crucial step forward in the knowledge of the Gamma–Ray Burst (GRB) phenomenon accomplished with the BeppoSAX satellite, great expectations are placed in the Swift mission. The BeppoSAX discovery of GRB afterglows with the resulting determination of the distance scale of long events (duration greater than 2 seconds), allowed, among other things, the first spectral and temporal studies of the late (i.e. after 0.25 days) X–ray afterglow (see, e.g., the review by Frontera (2003)). However, no observation of the early afterglow, except in one case (GRB 990123, Maiorano et al. 2005), was possible with BeppoSAX. Indications about an afterglow onset during the tail of the prompt emission could be inferred only from the comparison of the prompt with the delayed X–ray emission (Frontera et al. (2000)). No evidence of temporal breaks in the late afterglow light curves could be detected, although the X–ray data were found to be consistent with the afterglow breaks observed in the optical band (see, e.g., Pian et al. (2001), in’t Zand et al. (2001)). The true onset of GRB X–ray afterglows, their light curves at early times, their spectra, the existence of time breaks in the X–ray afterglow light curves are among the issues left open by BeppoSAX and still unsolved despite the availability of large X–ray observatories, like Chandra or XMM–Newton.
The Swift Gamma–ray Burst Explorer (Gehrels et al. (2004)) was successfully launched on 2004 November 20. The scientific payload of the observatory consists of a wide-field instrument, the gamma–ray (15–350 keV) Burst Alert Telescope (BAT, Barthelmy et al. (2005)) which detects bursts and determines their position with 3 arcmin precision, and two co-aligned narrow-field instruments: the X–Ray Telescope (XRT, Burrows et al. 2005a ), operating in the 0.2–10 keV energy band with source localization capabilities of 5–6 arcsec, and the Ultraviolet/Optical Telescope (UVOT, Roming et al. (2005)), sensitive in the 170–600 nm band with 0.3 arcsec positioning accuracy.
The autonomous and rapid slewing capabilities of Swift allow the prompt (1–2 minutes) observation of GRB afterglows with the XRT and UVOT instruments. In particular in the X–ray energy band, where the reaction times of other satellites are limited to time scales of several hours, it is possible to study the afterglows in their previously unexplored early phases. At the time of writing (June 2005), the XRT has performed follow-up observations of 30 bursts discovered by the BAT instrument and detected in all cases their X–ray afterglows (e.g. Burrows et al. 2005b , Campana et al. (2005), Tagliaferri et al. (2005), Cusumano et al. (2005), Page et al. 2005).
In this letter we present a detailed analysis of the XRT follow-up observation of GRB 050318. The analysis of UVOT data has been presented in a separate paper (Still et al. (2005)). All the uncertainties on the derived quantities are given at 90% confidence level for one interesting parameter. Temporal and spectral indices are written following the notation .
2 Observations and BAT results
The BAT discovered and located this GRB at 15:44:37 UT on 2005 March 18 (Krimm et al. 2005a ). The BAT position (RA(J2000)=49651, Dec(J2000)=46392 with a 90% containment radius of 3 arcmin) was distributed via the GRB Circular Network (GCN). This position was within the Swift Earth horizon constraint and the spacecraft had to execute a delayed automatic slew to the burst position, settling on target at 16:39:11 UT, when XRT and UVOT observations started. The XRT detection of the X–ray afterglow was reported shortly afterwards together with a more accurate (6 arcsec) X–ray position determination (Nousek et al. (2005), Beardmore et al. (2005)). The afterglow detection by UVOT in the , , and bands was also soon distributed via GCN (McGowan et al. (2005), De Pasquale et al. (2005)). Ground-based follow-up observations in the optical band with the 6.5m Magellan/Baade telescope (Mulchaey & Berger (2005)) also led to the detection of two absorption systems at and , indicating as likely redshift of the event (Berger & Mulchaey (2005)).
In the BAT prompt emission light curve three peaks are observed. The first peak is followed by a quiet phase lasting 17 seconds and then by two overlapping peaks. On the basis of the preliminary analysis (Krimm et al. 2005b ), the burst is characterized by a duration of , a fluence in the 15–350 keV band of and a time averaged 15–350 keV spectrum described by a power–law model with energy index at 90% confidence level. We refined the preliminary spectral analysis by grouping the data points in order to increase the significance of each spectral bin at energies above 100 keV, where the signal is weak. We find that, in the 18–200 keV energy band, a cut–off power–law () fits the BAT spectrum significantly better ( with 8 degrees of freedom, dof) than a simple power–law (, 9 dof), with an energy index and keV. The corresponding peak energy of the spectrum is keV, in the uncertainty of which the covariance between and is taken into account. From these results and assuming as redshift , the rest frame peak energy is keV, while the isotropic-equivalent radiated energy in the rest frame 1– keV energy band is erg determined with the same method adopted by Amati et al. (2002) and Ghirlanda et al. (2004) with the following cosmological parameters: , and km s-1 Mpc-1. Results on the spectral evolution of the prompt emission are reported by Still et al. (2005).
3 XRT data analysis and results
The XRT observations of the GRB 050318 field started on 2005 March 18 at 16:39:11 UT, about 54 minutes after the BAT trigger. The instrument was in Auto State and the relatively low count rate level detected on the CCD automatically configured the instrument to its most sensitive “Photon Counting” operational mode (Hill et al. (2004)) at 16:39:21 UT. The field was then observed for 11 consecutive orbits until 09:25:48 UT on 2005 March 19.
The XRT data were processed with the XRTDAS111http://swift.gsfc.nasa.gov/docs/swift/analysis/xrtswguidev12.pdf software package (v. 1.4.0) developed at the ASI Science Data Center. Calibrated and cleaned Level 2 event files were produced with the xrtpipeline task. Only time intervals with a CCD temperature below C and events with grades 0–12 were considered for the data analysis. The total exposure time of data in Photon Counting mode after screening is 23540 s.
The 0.2–10 keV image of the field centered on GRB 050318 was analyzed with the XIMAGE package (v. 4.3). A previously uncatalogued bright X–ray source is clearly visible within the BAT error circle with coordinates RA(J2000) = , Dec(J2000) = . This position, determined with the detect routine of XIMAGE which uses a sliding-cell method, has a 90% uncertainty of 6 arcsec including systematic errors which take into account the residual calibration uncertainties in the spacecraft attitude and telescope misalignment. The XRT coordinates of the image centroid are 2.6 arcmin from the BAT centroid position and 1.1 arcsec from the centroid position of the optical counterpart. Thus X–ray and optical counterparts are fully consistent with being the same object.
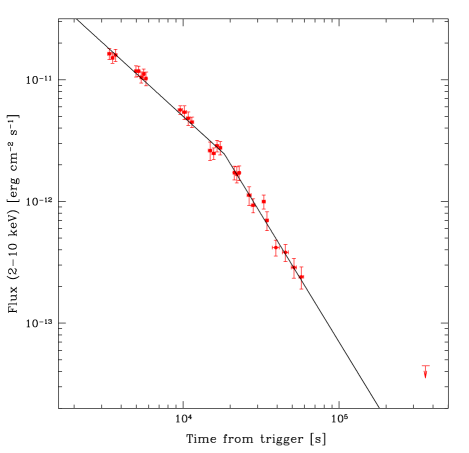
Events for the temporal analysis were selected within a circle of 20 pixel (47 arcsec) radius, which encloses about 90% of the PSF at 1.5 keV (Moretti et al. (2004)), centered on the source position. The background was extracted from a nearby source-free circular region of 30 pixel radius. The 2–10 keV light curve, binned to that each bin contains at least 20 counts, is shown in Fig. 1. The X–ray afterglow of GRB 050318 is clearly fading. We first fitted the afterglow decay with a single power law model and found . However, this fit was clearly not acceptable, with (25 dof). From the inspection of the residuals a clear steepening of the light curve with time was observed and a broken power law model with slopes , and break was adopted. The model provided a very good fit with (23 dof) and best fit parameters , and .
The field of GRB 050318 was re-observed with the XRT on March 22 starting at 01:09:50 UT until March 23 23:59:56 UT. In the Photon Counting mode exposure of 6394 s the X–ray afterglow was not detected. Its three-sigma upper-limit on the 2–10 keV flux, plotted in Fig. 1, is consistent with the extrapolation of the best fit model.
For the spectral analysis events were extracted from the same circular region used to produce the light curve. A further selection on XRT event grades 0–4 (i.e. single and double pixel events) was applied to the data. The spectrum was binned to ensure a minimum of 20 counts per bin, and energy channels below 0.2 keV and above 10.0 keV were excluded, leaving a total of 1874 photons. The XRT average spectrum was fitted using the XSPEC package (v. 11.3.2, Arnaud (1996)). We adopted an absorbed power law model with energy index and the results of the spectral fit are shown in Table 1. This model fits the data well (, 75 dof), with some evidence of a hydrogen-equivalent column density higher than the Galactic value ( cm-2 versus , Dickey & Lockman (1990), Elvis et al. (1994)). The average 2–10 keV flux corrected for absorption is erg cm-2 s-1. We also froze to the Galactic value leaving the redshifted to the rest frame of the GRB host () free to vary (zwabs model in XSPEC). We found cm-2 as best fit with unchanged with respect to the value reported in Table 1.
| time interval | (cm-2) | (d.o.f.) | |
|---|---|---|---|
| all | 0.96 (75) | ||
| 1.22 (57) | |||
| 0.48 (20) |
The spectral analysis was performed also in shorter time intervals to study the possible evolution of the spectrum with time. The observation was split in two segments, the first corresponding to the light curve before the break time , and the second one covering the remainder of the light curve. The results of the two spectral fits are shown in Table 1. No evidence for spectral variations of the X–ray afterglow is found.
4 Discussion
The results reported here, along with those of other GRBs detected by Swift (Burrows et al. 2005b , Campana et al. (2005), Tagliaferri et al. (2005), Cusumano et al. (2005)), clearly show that the study of the early afterglows and of the possible breaks in the X–ray afterglow light curves is well within the Swift possibilities. For GRB 050318 we have found a clear break in the X–ray afterglow light curve occurring at s, with no evidence of spectral change (see Table 1). The slope of the light curve before the temporal break is , while that measured after is . The light curve of the GRB050318 optical counterpart obtained with UVOT (Still et al. (2005)), although determined only before the break observed with XRT, shows a slope consistent with the X–ray afterglow light curve.
In the framework of the fireball model, this fact points to a forward shock with the circumburst material responsible for the observed X–ray and optical emission. The origin of the break was investigated. From the derived estimates of and before and after the temporal break, assuming a synchrotron emission (see below), it results that the break is inconsistent with the transition of the cooling frequency from above to below the X–ray energy band either when the fireball expands in a wind (Chevalier & Li (1999)) or in a constant density medium (Sari et al. (1998)). The temporal break also resulted to be inconsistent with the transition of the fireball to a non relativistic phase (Dai & Lu (1999)). It is therefore very likely to interpret the temporal break as due to the effect of a collimated relativistic outflow, when its bulk Lorentz factor becomes lower than the inverse of the jet opening angle (e.g., Rhoads (1997), Sari et al. (1999)). In this framework, the jet opening angle can be determined through the equation (e.g., Bloom et al. 2003) where is in radians, in days, in units 1052 erg, the density of the circumburst medium in cm-3, and is the efficiency of conversion of the outflow kinetic energy in electromagnetic radiation. With and thus with the and values above derived (see Section 2), we find deg, for (Frail et al. (2001)) and assuming the new canonical value of circumburst density cm-3, as discussed by Bloom et al. (2003). With this value of the jet opening angle, the inferred collimation-corrected radiated energy is erg.
While the value of is within the range of values found for the GRBs with known , the value of is in the tail () of the distribution reported by either Ghirlanda et al. (2004) or Friedman & Bloom (2005). Taking into account the value above derived (see Section 2), it is possible to see that GRB 050318 is fully consistent with the vs. relation found by Amati et al. (2002), while is inconsistent ( distance) with the vs. relation found by Ghirlanda et al. (2004). Assuming that the 90% confidence interval (95–152 keV) of (see Sect. 2) is not strongly affected by systematics, the only viable way to make this event consistent with the Ghirlanda relation, (a higher value of appears unlikely) is to assume a higher circumburst density medium ( cm-3). This would imply a higher deg) and ( erg).
The X–ray afterglow spectrum is consistent with a synchrotron emission model from a spreading jet, confirming the given interpretation of the temporal break in the X–ray light curve. Indeed, following Sari et al. (1999), we find that, assuming a constant density medium and an adiabatic expansion of the fireball, in the slow cooling regime, in which the peak frequency is lower than the cooling frequency , the slopes of the X–ray spectrum and light curve are mutually consistent. With these assumptions, the following closure relations should be satisfied: for , for , while for ; for , for , while for . In our case, given that we do not find significant spectral evolution (see Table 1), we assume . From the value derived for the temporal index after the break (), we can state that can be excluded (expected value of ) while the case is fully consistent with the data (expected ). With , for , the power-law index of the electron energy distribution (), that gives rise to the synchrotron photons, is expected to be coincident with (), and thus in the range of values found for all the BeppoSAX GRBs (Frontera (2003)). With this value of we expect a temporal index before the temporal break () and an energy index (), both consistent with the measured values (, ). We notice that, on the basis of the X–ray spectrum alone, we cannot distinguish between a wind and a constant density medium: both media require the same closure relations for (Chevalier & Li (1999)).
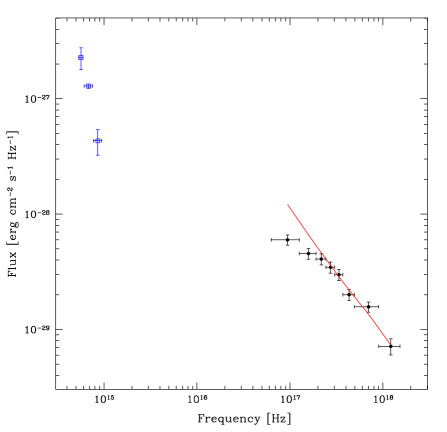
In the optical band the observational scenario is more complex. The measured temporal index in the band (, Still et al. 2005) is consistent with a synchrotron emission model from a spreading jet. In Fig. 2 the multiwavelength spectrum of the afterglow is plotted. The UVOT optical points are taken from Still et al. (2005) and refer to an epoch of 4061 seconds after the trigger. Accordingly, the XRT data have been selected in the same time interval of the UVOT exposures, i.e. between 3180 and 5822 seconds after the trigger (Still et al. (2005)). As can be seen, it appears that the optical spectrum from V to U is much steeper than the X–ray spectrum (energy index , Still et al. 2005). The issue has been discussed by Still et al. (2005), finding that the XRT and UVOT spectral data could be reproduced assuming either a gas and dust complex redshifted by or dust extinction by more absorbing complexes at more moderate redshifts, like those discovered by Berger & Mulchaey (2005). The above considerations on the vs. and vs. relations remain unchanged even assuming .
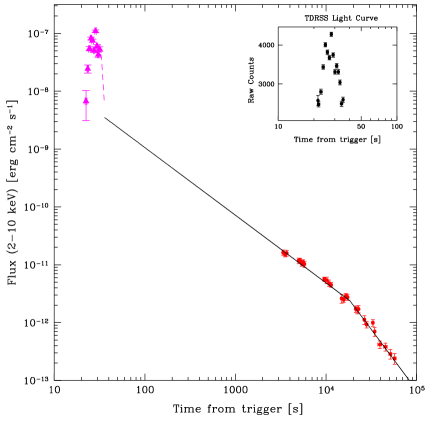
Finally, we focus on the connection between prompt and afterglow emission. In Fig. 3 the 2–10 keV X–ray light curve of the afterglow emission from GRB 050318 is compared with the 25–50 keV prompt emission profile measured with BAT, rescaled to the 2–10 keV band using the BAT spectrum (see Section 2). The back extrapolation of the afterglow light curve to the time of the prompt emission is somewhat below, but marginally consistent, with the end of the prompt light curve. However, uncertainties in the conversion factor from the 25–50 keV to the 2–10 keV energy band and the event data loss that affected the last 2 seconds of the burst (see Fig. 3) do not allow us a more detailed investigation.
5 Conclusions
On the basis of the Swift observations, GRB 050318 appears to be a classical GRB, with observational properties consistent with a collimated fireball model, with a cone angle of 3–5 deg and a radiated energy of (4–8) erg against an isotropic-equivalent energy of erg, assuming a GRB redshift derived from the farthest absorbing system discovered in the optical band (). A search of the GRB host galaxy and its redshift should be crucial to confirm these results and/or the inference of a from the UVOT data. In both cases the event fully satisfies the Amati relation and marginally the Ghirlanda relation. The X–ray afterglow light curve and spectrum are consistent with a synchrotron emission model during a slow cooling regime with cooling frequency below the X–ray band.
Acknowledgements.
We thank F. Tamburelli and B. Saija for their work on the XRT data reduction software. This work is supported in Italy from ASI on contract number I/R/039/04 and through funding of the ASI Science Data Center, at Penn State by NASA contract NAS5-00136 and at the University of Leicester by the Particle Physics and Astronomy Research Council on grant numbers PPA/G/S/00524 and PPA/Z/S/2003/00507.References
- Amati et al. (2002) Amati, L.. Frontera, F., Tavani, M. 2002, A&A, 390, 81
- Arnaud (1996) Arnaud, K.A., 1996, Astronomical Data Analysis Software and Systems V, eds. Jacoby G. and Barnes J., p17, ASP Conf. Series vol. 101
- Barthelmy et al. (2005) Barthelmy, S.D., Barbier, L.M., Cummings, J.R., et al., 2005, Space Science Rev., 120, in press (astro-ph/0507410)
- Beardmore et al. (2005) Beardmore, A.P., Page, K.L., Mangano, V., et al., 2005, GCN, 3133
- Berger & Mulchaey (2005) Berger, E., Mulchaey J., 2005, GCN, 3122
- Bloom et al. (2003) Bloom, J.S., Frail, D.A., & Kulkarni, S.R. 2003, ApJ, 594, 674
- (7) Burrows, D.N., Hill, J.E., Nousek, J.A., et al., 2005a, Space Science Rev., 120, in press (astro-ph/0508071)
- (8) Burrows, D.N., Hill, J.E., Chincarini, G., et al., 2005b, ApJ, 622, L85
- Campana et al. (2005) Campana, S., Antonelli, L.A., Chincarini, G., et al., 2005, ApJ, 625, L23
- Chevalier & Li (1999) Chevalier, R.A. & Li, Z.Y., 1999, ApJ, 520, L29
- Cusumano et al. (2005) Cusumano, G., Mangano, V., Abbey, A.F., et al., 2005, ApJ, submitted
- Dai & Lu (1999) Dai, Z.G. & Lu, T., 1999, ApJ, 519, L155
- De Pasquale et al. (2005) De Pasquale, M., Boyd, P., Holland, S.T., et al., 2005, GCN, 3123
- Dickey & Lockman (1990) Dickey, J.M. & Lockman., F.J., 1990, ARA&A, 28, 215
- Elvis et al. (1994) Elvis, M., Lockman, F.J. and Fassnacht, C., 1994, ApJS, 95, 413
- Frail et al. (2001) Frail, D.A., Kulkarni, S.R., Sari, R. et al., 2001, A&A, 562, L55
- (17) Friedmann, A.S. & Bloom, J.S., 2005, ApJ, 627, 1
- Frontera et al. (2000) Frontera, F., Amati, L., Costa, E. et al., 2000, ApJS, 127, 59
- Frontera (2003) Frontera, F. 2003, in Supernovae and Gamma–Ray Bursters, ed. K. Weiler (Springer, Berlin), Lecture Notes in Physics, 598, 317
- Gehrels et al. (2004) Gehrels, N., Chincarini, G., Giommi, P., et al., 2004, ApJ, 611, 1005
- Ghirlanda et al. (2004) Ghirlanda, G., Ghisellini, G., & Lazzati, D. 2004, ApJ, 616, 331
- Hill et al. (2004) Hill, J.E., Burrows, D.N., Nousek, J.A., et al., 2004, Proceedings of SPIE, Vol. 5165, 217
- (23) Krimm, H., Barthelmy, S., Barbier, L., et al., 2005a, GCN, 3111
- (24) Krimm, H., Barthelmy, S., Barbier, L., et al., 2005b, GCN, 3134
- McGowan et al. (2005) McGowan, K., De Pasquale, M., Boyd, P., et al., 2005, GCN, 3115
- Maiorano et al. (2005) Maiorano, E., Masetti, N., Palazzi, E., et al., 2005, A&A, in press (astro-ph/0504602)
- Moretti et al. (2004) Moretti, A., Campana, S., Tagliaferri, G., et al., 2004, Proceedings of SPIE, Vol. 5165, 232
- Mulchaey & Berger (2005) Mulchaey, J., Berger, E., 2005, GCN, 3114
- Nousek et al. (2005) Nousek, J.A., Morris, D.C., Burrows, D.N., et al., 2005, GCN, 3113
- Page et al. (2005) Page, K.L., Rol, E., Levan, A.J., et al., 2005, MNRAS, in press (astro-ph/0508011)
- Pian et al. (2001) Pian, E., Soffitta, P., Alessi, A., et al., 2001, A&A, 372, 456
- Rhoads (1997) Rhoads, J. 1997, ApJ, 487, L1
- Roming et al. (2005) Roming, P.W.A., Kennedy, T.E., Mason, K.O., et al., 2005, Space Science Rev., 120, in press (astro-ph/0507413)
- Sari et al. (1998) Sari, R., Piran, T., & Narayan, N., 1998, ApJ, 497, L17
- Sari et al. (1999) Sari, R., Piran, T. & Halpern, J.P. 1999, ApJ, 519, L17
- Still et al. (2005) Still, M., Roming, P.W.A., Mason, K.O., et al., 2005, ApJ, in press (astro-ph/0509060)
- Tagliaferri et al. (2005) Tagliaferri, G., Goad, M.R., Chincarini, G., et al., 2005, Nature, 436, 985
- in’t Zand et al. (2001) in’t Zand, J.J.M., Kuiper, L., Amati, L. et al., 2001, ApJ, 559, 710