The Antennae Ultraluminous X-Ray Source, X-37,
Is A Background Quasar
Abstract
In this paper we report that a bright, X-ray source in the Antennae galaxies (NGC 4038/9), previously identified as an ultra-luminous X-ray source, is in fact a background quasar. We identify an isolated infrared and optical counterpart within the X-ray source X-37. After acquiring an optical spectrum of its counterpart, we use the narrow [OIII] and broad H emission lines to identify X-37 as a quasar at a redshift of z=0.26. Through a , , and photometric analysis, we demonstrate that most of the observable light along this line of sight is from the quasar. We discuss the implications of this discovery and the importance of acquiring spectra for optical and IR counterparts to ULXs.
1 Introduction
Ultraluminous X-ray sources (ULX) are typically defined as point sources with X-ray luminosities ergs s-1. Einstein (Long & van Speybroeck, 1983; Helfand, 1984; Fabbiano, 1989) and ROSAT (Roberts & Warwick, 2000; Colbert & Ptak, 2002) observations revealed many of these objects in nearby galaxies. Recent Chandra observations indicate the Antennae (NGC 4038/4039) contain 9 ULXs (Zezas, et al., 2002a, assuming here and hence forth = 75 km s-1 Mpc-1), the largest number discovered so far in a single galaxy (Fabbiano, et al., 2003).
One X-ray source in the Antennae that has received considerable attention in the recent literature is X-37, as designated by Zezas, et al. (2002a). At the distance to these interacting galaxies (19.3 Mpc) it would have an X-ray luminosity, = 4.5ergs s-1, making it a ULX. A previous attempt to match X-ray positions directly to HST positions indicated that this object has a significant () offset from a nearby optical source (Zezas, et al., 2002b). This spawned discussions of whether this is a runaway X-ray binary escaping from its parent cluster (Zezas, et al., 2002b; Miller, et al., 2004a; Fabbiano, 2004). But, matching X-ray positions directly to the optical is difficult due to the crowded HST field and image rotation.
In Clark, et al. (2005) (henceforth Paper 1) we demonstrated that the infrared (IR) is a powerful method for finding counterparts to X-ray sources. This wavelength regime has similar dust penetrating properties to X-rays, facilitating counterpart identification. In a subsequent paper we match X-ray and optical HST positions with high precision by using the IR frame tie as a go-between (Clark, et al. 2005, in preparation; henceforth Paper 2). Here we use X-37 to demonstrate the success of our method and show the importance of obtaining follow-up spectra of counterparts to ULX candidates. §2 describes our spectroscopic observations and briefly discusses our analysis of the IR and optical images. We summarize our results and present the implications of our discovery in §3.
2 Observations and Data Analysis
2.1 Infrared and Optical Images
Our analysis of the counterpart to X-37 is based in part on IR (1.25 m) and (2.15 m) band images of the Antennae. These images were first analyzed by Brandl, et al. (2005), who reported the details of the data reduction. In summary, we acquired 20 minute total exposures in each filter using the Wide-field InfraRed Camera (WIRC) on the Palomar 5-m telescope during the night of March 22nd, 2002.
In Paper 1, we made a frame tie between the IR and X-ray using IR counterparts to compensate for the poor astrometric accuracy of Chandra (). We matched 7 IR sources from the WIRC images with Chandra X-ray point sources. Using a least squares fit of a linear matching function we tied Chandra R.A. and Dec. to WIRC x,y pixel positions. The RMS positional uncertainty is .
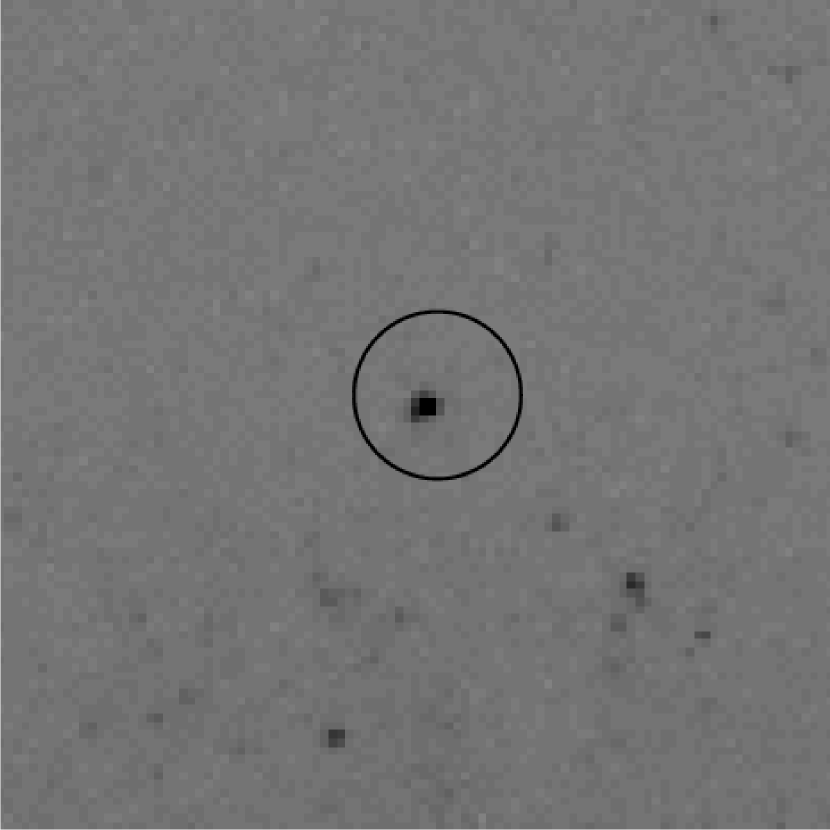
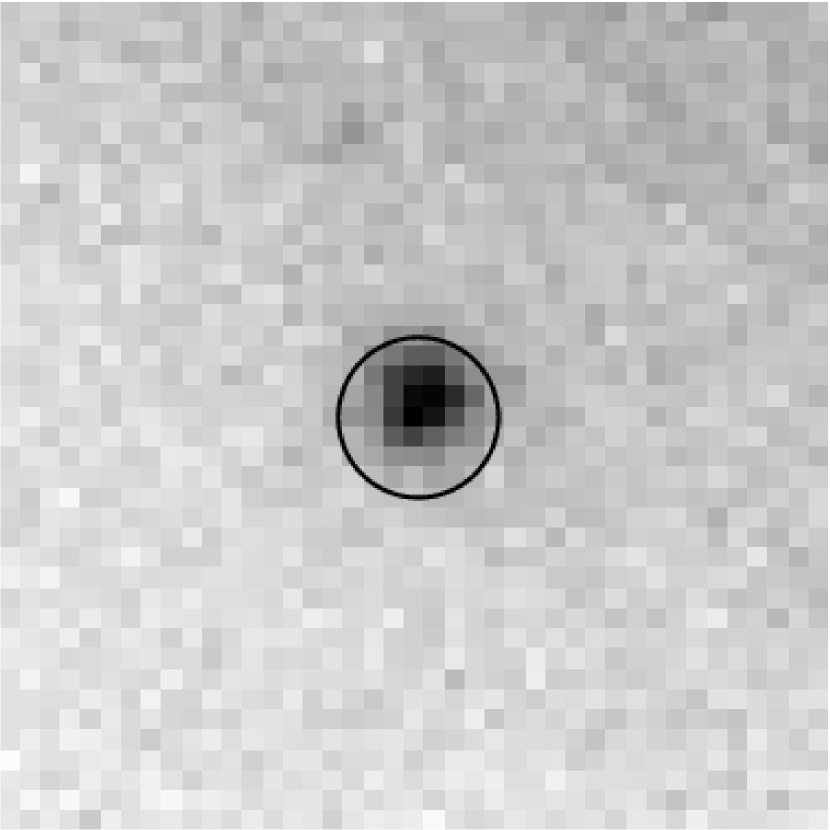
With the astrometric frame tie in place, we identified a bright, = 16.2 mag source from the X-ray position of X-37 (see Figure 1). Note that this contradicts previous reports of a significant offset between X-37 and the star cluster candidate, and independently eliminates any need for the hypothesis that this X-ray source is a runaway X-ray binary (Zezas & Fabbiano 2002; see also Miller et al. 2004a; Fabbiano et al. 2003).
We also base this study on work done in Paper 2 where we studied optical counterparts to X-ray sources in the Antennae. We obtained archival HST images (Whitmore, et al., 1999) in the following filters: F336W(), F439W(), F555W(), and F814(). Tying Chandra X-ray coordinates to HST positions is nontrivial due to image rotation and the crowded field in the HST images. Instead, we used our excellent frame tie between the IR and X-ray as an intermediate step. We used the same basic procedure as that used in Clark, et al. (2005). Using this astrometric frame tie, we found an optical source from the X-ray position of X-37 (Figure 1) — again, an insignificant offset.
2.2 Spectroscopy
We acquired an optical spectrum of X-37 on March 7, 2003, using the Low Resolution Imaging Spectrograph (Oke, et al., 1995, LRIS) on Keck I. We observed this source in two separate slitmasks with a 400 lines mm-1 grating and blaze wavelength of 8500 Å, yielding a total wavelength coverage on the red side of 5600-9400 Å. Seeing throughout the observations was . We observed X-37 for a total of 6000 seconds between the two masks with typical single exposure times of 600 seconds.
We reduced the spectrum with a combination of standard IRAF procedures and IDL code using the NeAr arc-lamp spectrum for wavelength calibration. We used the standard star Feige 67 to flux calibrate the spectrum.
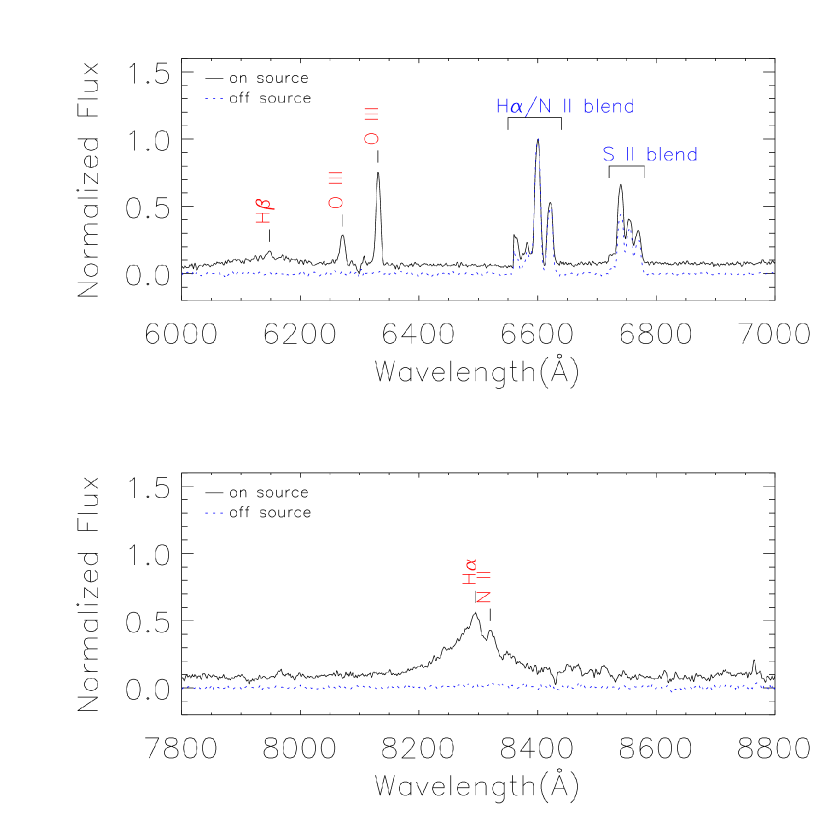
We extracted spectra of the X-37 counterpart from each individual exposure in a (approximately 2 FWHM) region centered on the emission peak. A background spectrum extracted from a region removed from the counterpart was sufficient for removing the night sky lines. We point out the blended lines, H/[NII] at Å and the [SII] pair at Å, observed at the redshift of the Antennae (Figure 2). These spectral features are at approximately the same levels in the on-source and background spectra, suggesting that they are likely diffuse emission from the Antennae and not associated with X-37.
Noting the broad emission lines characteristic of a quasar we looked for other spectral features to confirm this classification. The realization that the broad line at 8296 Å was red-shifted H prompted a search for additional lines generally associated with quasars. We noted a plethora of such identifiers including the non-restframe wavelengths of H at 6148 Å, [OI] at 7965 Å, [NII] at 8320 Å, and [SII] at 8510 Å. This corroborated our conclusion that X-37 is a quasar.
Using the observed, narrow [OIII] lines at 6270.45 Å and 6330.94 Å, we measured a redshift of z=0.26. At the redshift to this quasar, X-37 would now have an X-ray luminosity of ergs s-1. As we show in Table 1, this luminosity is typical of the X-ray luminosity for quasars at a similar distance (Schartel, et al., 1996).
2.3 Photometry
To investigate how much of the continuum flux could be due to the quasar, we compared the photometric properties of this source to that of other quasars at X-37’s redshift of z=0.26. We chose and -band photometry from the HST images and -band photometry from the WIRC images. This choice in filters covers the full wavelength range used in our studies of the Antennae (Clark, et al. 2005, in preparation). The full-width at half-maximum (FWHM) in , , and are , and , respectively. Defining the photometric aperture as of the Gaussian point spread function (PSF) width, the aperture radii are 3-pixels in , 2.5-pixels in , and 5-pixels in .
Subtracting sky background flux is especially difficult in the Antennae considering the bright, crowded background in these galaxies. To compensate for this difficulty, we chose to measure the mean and median sky background flux in two separate annuli between of the PSF. Being an isolated source, we did not have to compensate for crowded conditions in the field around the X-37 counterpart. Multiplying the mean and median sky background by the area of the central aperture and then subtracting this from the central aperture yielded four separate flux measurements for the source. We then averaged these four values to give us the source flux. When computing errors, we considered variations in the sky background, , and Poison noise, . To calculate we found the standard deviation of the four flux values for each source. Dividing the mean source flux by the instruments gain and then taking the square root of these, we found . The known gain for WIRC is 2 e-1/DN (Wilson, et al., 2003), while Whitmore, et al. (1999) use a gain of 7 e-1/DN for HST. Both and were added in quadrature to yield a total error in flux, .
We used a bright, 2MASS star to convert flux into a magnitude. We derived HST magnitudes using zero points listed in Table 28.1 of the HST Data Handbook (Voit, 1997). Applying color transformations defined in Holtzman, et al. (1995), we converted HST magnitudes to Johnson and . We expressed errors in magnitude, , as divided by the mean flux. In the case of and , consists of the additional errors in the zeropoint and color transformations, all of which were added in quadrature.
2.3.1 Absolute Magnitudes
We next converted these photometric measurements to reddening-corrected absolute magnitudes. At the redshift of X-37, the distance modulus is 40.1 mag. We derived reddening in , = 1.3 mag, using the X-ray derived column density, , listed in Table 5 of Zezas, et al. (2002a) and the relationship = . We used the value provided by the power-law spectral fits of Zezas, et al. (2002a). These authors computed assuming the absorption is at zero redshift. This should not be a problem for us since the broad absorption lines observed in the X-37 spectrum suggest there is little extinction along the line of sight to it.
To find reddening in other filters, we used the extinction law defined in Cardelli, Clayton, & Mathis (1989, CCM). We also computed separate reddenings in each filter using the Rieke-Lebofsky (RL) Law (Rieke & Lebofsky, 1985). We then expressed errors in reddening, , as the difference in , and derived from each law. Adding and in quadrature, we computed a total error in absolute magnitude.
In Table 1, we compare the absolute magnitudes, , , and , of the X-37 counterpart to typical magnitudes for quasars at a similar distance. We obtained and from the Sloan Digital Sky Survey (SDSS) quasar catalog (Schneider, et al., 2003) for 33 quasars at a redshift of 0.26. Using color transformations listed in Fukugita, et al. (1996), we converted SDSS magnitudes to the Johnson photometric system. We used the catalog described in Barkhouse & Hall (2001) to derive for 17 quasars at a redshift of 0.26. Considering the absolute magnitude of X-37 in the , and bands falls within the range of catalog quasar magnitudes, X-37 has the luminosity of a typical quasar.
3 Discussion
The identification of X-37 with a background quasar further demonstrates the importance of spectroscopic followup for the study of ULX sources. While the overabundance of such sources near galaxies clearly demonstrates that a physical connection does exist for many ULX sources as a population (e.g. Colbert & Ptak, 2002), the strong possibility of background quasar contamination makes such identification for any particular source perilous (see also Gutiérrez & López-Corredoira, 2005).
A specific example involving X-37 is the recent work of Miller, et al. (2004b). In their Figure 2, Miller, et al. (2004b) compare the black hole mass to inner disk temperature for both ULX sources and “standard” stellar-mass black holes, finding that the ULX sources have cooler disk temperatures. They use this to conclude that ULX are likely to be powered by accretion onto Intermediate-Mass Black Holes (IMBH). While some of the sources in this diagram are almost certainly ULXs (i.e. NGC 1313 X-1 and NGC 1313 X-2), and thus possible IMBH, it is somewhat surprising to note that the “ULX” X-37 is grouped with these sources in the diagram – despite the fact that its actual black hole mass is at least 4 orders of magnitude higher than assumed by Miller, et al. (2004b). Thus, X-37 illustrates the importance of follow-up spectroscopic confirmation of ULXs, and sounds a cautionary note regarding conclusions based on observations without such confirmation.
References
- Antonucci (1993) Antonucci, R. 1993, ARA&A, 31, 473
- Barkhouse & Hall (2001) Barkhouse, W.A. & Hall, P.B. 2001, AJ, 121, 2843
- Brandl, et al. (2005) Brandl, B.R., et al. 2005, ApJ, submitted
- Cardelli, Clayton, & Mathis (1989) Cardelli, J.A., Clayton, G.C., & Mathis, J.S. 1989, ApJ, 345, 245
- Clark, et al. (2005) Clark, D.M., et al. 2005, ApJ, submitted
- Colbert & Ptak (2002) Colbert, E.J.M., & Ptak, A.F. 2002, ApJS, 143, 25
- Fabbiano (2004) Fabbiano, G. 2004, RevMexAA, 20, 46
- Fabbiano, et al. (2003) Fabbiano, G., Zezas, A., King, A.R., Ponman, T.J., Rots, A., & Schweizer, F. 2003, ApJ, 584, 5
- Fabbiano, Zezas, & Murray (2001) Fabbiano, G., Zezas, A., & Murray, S.S. 2001, ApJ, 554, 1035
- Fabbiano (1989) Fabbiano, G. 1989, ARA&A, 27, 87
- Fukugita, et al. (1996) Fukugita, M., Ichikawa, T., Gunn, J.E., Doi, M., Shimasaku, K., Schneider, D.P. 1996, AJ, 111, 1748
- Gutiérrez & López-Corredoira (2005) Gutiérrez, C.M., & López-Corredoira, M. 2005, ApJ, 622, L89
- Helfand (1984) Helfand, D.J. 1984, PASP, 96, 913
- Holtzman, et al. (1995) Holtzman, J.A., et al. 1995, PASP, 107, 1065
- Long & van Speybroeck (1983) Long, K.S., & van Speybroeck, L.P. 1983, in Accretion-Driven X-Ray Sources, ed. W.H.G. Lewin, & E.P.J. van den Heuvel (Cambridge: Cambridge Univ. Press) 117
- Miller, et al. (2004a) Miller, J.M., Zezas, A., Fabbiano, G., & Schweizer, F. 2004a, ApJ, 609, 728.
- Miller, et al. (2004b) Miller, J.M., Fabian, A.C., & Miller, M.C. 2004b, ApJ, 614, L117
- Miller, et al. (2003) Miller, J.M., Fabbiano, G., Miller, M.C., & Fabian, A.C. 2003, ApJ, 585, L37
- Oke, et al. (1995) Oke, J.B., et al. 1995, PASP, 107, 375
- Rieke & Lebofsky (1985) Rieke, G.H., & Lebofsky, M.J. 1985, ApJ, 288, 618
- Roberts & Warwick (2000) Roberts, T.P., & Warwick, R.S. 2000, MNRAS, 315, 98
- Schartel, et al. (1996) Schartel, N., Walter, R., Fink, H.H., & Trümper, J. 1996, A&A, 307, 33
- Schneider, et al. (2003) Schneider, D.P., et al. 2003, AJ, 126, 2579
- Voit (1997) Voit, M. 1997, HST Data Handbook (Baltimore: STScI)
- Whitmore, et al. (1999) Whitmore, B.C., Zhang, Q., Leitherer, C., Fall, S.M., Schweizer, F., & Miller, B.W. 1999, AJ, 118, 1551
- Wilson, et al. (2003) Wilson, J.C., et al. 2003, SPIE, 4841, 451
- Zezas, et al. (2002a) Zezas, A.L., Fabbiano, G., Rots, A.H., & Murray, S.S. 2002a, ApJS, 142, 239
- Zezas, et al. (2002b) Zezas, A.L., Fabbiano, G., Rots, A.H., & Murray, S.S. 2002b, ApJ, 577, 710
| Filter | Observed Magnitudes 11Absolute magnitudes include uncertainties in each value. Catalog values were taken from separate sources: and from Schneider, et al. (2003), from Barkhouse & Hall (2001), and from Schartel, et al. (1996). | Typical Catalog Range |
|---|---|---|
| -20.90.2 | -23.9 – -20.8 | |
| -20.40.2 | -23.4 – -21.0 | |
| -24.10.1 | -25.6 – -23.8 | |
| log() | 43.1 | 43.7 – 44.1 |