The Low Quiescent X-Ray Luminosity of the Transient X-Ray Burster EXO 1747–214
Abstract
We report on X-ray and optical observations of the X-ray burster EXO 1747–214. This source is an X-ray transient, and its only known outburst was observed in 1984–1985 by the EXOSAT satellite. We re-analyzed the EXOSAT data to derive the source position, column density, and a distance upper limit using its peak X-ray burst flux. We observed the EXO 1747–214 field in 2003 July with the Chandra X-ray Observatory to search for the quiescent counterpart. We found one possible candidate just outside the EXOSAT error circle, but we cannot rule out the possibility that the source is unrelated to EXO 1747–214. Our conclusion is that the upper limit on the unabsorbed 0.3–8 keV luminosity is erg s-1, making EXO 1747–214 one of the faintest neutron star transients in quiescence. We compare this luminosity upper limit to the quiescent luminosities of 19 neutron star and 14 black hole systems and discuss the results in the context of the differences between neutron stars and black holes. Based on the theory of deep crustal heating by Brown and coworkers, the luminosity implies an outburst recurrence time of 1300 yr unless some form of enhanced cooling occurs within the neutron star. The position of the possible X-ray counterpart is consistent with three blended optical/IR sources with -magnitudes between 19.4 and 19.8 and -magnitudes between 17.2 and 17.6. One of these sources could be the quiescent optical/IR counterpart of EXO 1747–214.
Subject headings:
accretion, accretion disks — stars: neutron — stars: individual (EXO 1747–214) — X-rays: stars — X-rays: general1. Introduction
Observations of transient X-ray binary systems in quiescence have greatly advanced studies of compact objects over the past decade. While both black hole and neutron star systems can approach or possibly even exceed their Eddington luminosities during outbursts, their quiescent X-ray luminosities can be factors of lower than their peak luminosities. Quiescent optical observations allow for the measurement of compact object masses as the optical companion’s radial velocity curves can be measured as well as the binary inclination via studies of ellipsoidal modulations (Charles & Coe, 2003, and references therein). Such measurements have been especially important for confirming that there is a population of compact objects with masses that are too high (3) to be neutron stars so that these objects are very likely black holes. In the future, mass measurements of neutron star transients may lead to constraints on the equation of state for matter at high densities (Lattimer & Prakash, 2004).
Quiescent X-ray observations are also interesting for neutron star and black hole systems. For many neutron star systems, a thermal component is seen in the quiescent X-ray spectrum that is likely blackbody emission from the neutron star surface. Measurements of the evolution of this component allow for constraints on the thermal properties of the neutron star crust and core (Wijnands, 2004). The core temperature is thought to be set by the accretion history over a time period of 10,000 years (Brown, Bildsten & Rutledge, 1998; Colpi et al., 2001). Quiescent X-ray spectra of black hole systems do not appear to show a blackbody component, which is one reason they tend to be fainter than neutron star systems. It has also been argued that, in quiescence, black holes are radiatively less efficient than neutron star systems, which has been taken as evidence that a large fraction of the accreted matter is advected across the black hole event horizon (Narayan, Garcia & McClintock, 1997; McClintock et al., 2003).
With sensitive X-ray missions like the Chandra X-ray Observatory and the X-ray Multi-Mirror Mission (XMM-Newton), it has been possible to observe many more neutron star and black hole systems in quiescence. As more systems are observed, it has been found that many of the neutron star systems are fainter than the erg s-1 range usually considered as the typical range for neutron stars in quiescence (Campana et al., 2002; Wijnands et al., 2005b; Tomsick et al., 2004; Jonker, Wijnands & van der Klis, 2004). Thus, it is important to obtain the largest samples possible to avoid any selection biases when comparing the quiescent properties of black holes and neutron stars.
In this paper, we use archival data as well as our recent observations to study the neutron star X-ray transient EXO 1747–214. This system was discovered during the EXOSAT Galactic plane scans in 1984 June (Warwick et al., 1988; Parmar et al., 1985) and was detected again by EXOSAT in 1985 April at about the same flux level (Magnier et al., 1989; Parmar et al., 1985). These are the only two known detections of the source, so that it has apparently been in quiescence for 20 years. An X-ray burst was detected in 1985, demonstrating that the system definitely harbors a neutron star (Magnier et al., 1989). Although EXOSAT provided a relatively good position for the source, and the extinction along the line of sight to the source () is fairly low, the source has not been optically identified. The primary goal of this work is to use a Chandra observation of moderate length to detect the source in quiescence and to search for an optical counterpart. We report on our search below, including a constraint on the quiescent luminosity and a comparison between the Eddington-scaled luminosity of EXO 1747–214 and those of 19 neutron star and 14 black hole systems.
2. Analysis and Results
The data we used for this work come from the X-ray, optical, and infrared observations listed in Table 1. First, we went back to the discovery observations made by EXOSAT in 1984–1985. During this time, the source was bright in X-rays, and we used the EXOSAT images to re-derive the source position. We also re-analyzed the data from the EXOSAT proportional counters to obtain information about the energy spectrum and the detected X-ray burst. The main focus of this paper is to search for the quiescent X-ray counterpart. For this purpose, we used the data from our 2003 Chandra observation. Finally, we obtained optical and infrared images to allow for optical or IR identifications of any detected X-ray sources. Here, we describe our analysis of the data from these observations and our results.
2.1. Source Position from EXOSAT
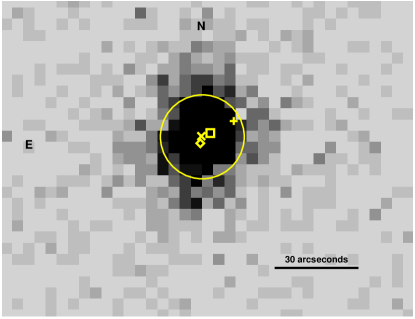
EXOSAT (Taylor et al., 1981) observations of EXO 1747–214 occurred in 1985 on April 8 and 11. The most precise position for this source comes from data obtained with the low energy imaging telescope (LE1) and the Channel Multiplier Array (CMA1) instrument, which has a bandpass of 0.05–2.5 keV. However, as the EXOSAT/CMA catalog111The EXOSAT/CMA catalog is part of the “Master X-Ray Catalog” at http://heasarc.gsfc.nasa.gov/W3Browse/all/xray.html does not give a single unique position for EXO 1747–214, we re-analyzed the CMA data to determine the position. During the short April 8 observation, the Thin Lexan filter was inserted, and EXO 1747–214 was 6′ off-axis. On April 11, the source was on-axis, and three filters were used at different times: Thin Lexan, with the highest effective area () over the full bandpass; Al/Parylene, with reduced below 0.3 keV; and Boron, with two bands of peaking at 0.15 keV and 1 keV (de Korte et al., 1981). With the highest and the longest exposure time (see Table 1), the image obtained with the Thin Lexan filter provides the best statistics, and this image is shown in Figure 1. Nearly all of the source counts are contained in a 24-by-24 pixel region centered on the source. For the image shown in Figure 1, there are 1331 counts in this region, and using number of counts per pixel from the surrounding, source-free, region, we estimate that there are 104 background counts in a 24-by-24 pixel region. For each of the four images, we calculated the centroid using the counts from a 24-by-24 pixel region centered on the source, and these centroids are shown in Figure 1. The position on April 8 is 10′′ away from the other three positions, and this is probably due to the fact that the source was off-axis on April 8 so that the position is not as reliable. We combined the data for the three on-axis images and recalculated the centroid to determine a best source position of R.A. = , decl. = (equinox J2000). The EXOSAT/CMA catalog indicates that the 90% confidence error radius is , and the corresponding error circle is shown in Figure 1. The best position that we derive is from the median of the positions given in the EXOSAT/CMA catalog, and it is from the position quoted in Gottwald et al. (1991). Thus, all these positions are well within the error circle.
2.2. Column Density and Distance Upper Limit from EXOSAT
On 1985 April 11, EXO 1747–214 was also observed with the EXOSAT medium energy (ME) instrument, which consists of eight proportional counters. The observation lasted for more than 6 hours, and, as reported in Magnier et al. (1989), included one type I X-ray burst. The original analysis by Magnier et al. (1989) reported that the 1–20 keV spectrum of the persistent emission was well-described by a power-law with interstellar absorption with a column density of cm-2. To check this, we obtained the ME spectrum from the EXOSAT archive. The details of the spectral extraction and background subtraction are provided on-line222http://heasarc.gsfc.nasa.gov/W3Browse/exosat/me.html. When the EXO 1747–214 spectrum was extracted, the data from the time of the X-ray burst was removed, leaving the spectrum of the persistent emission.
We used the spectral fitting package XSPEC version 11.3.1t to perform least-squares fits to the ME spectrum, and our results do not confirm those of Magnier et al. (1989). A power-law with (interstellar) absorption gives a very poor fit to the spectrum with . The reason for the poor fit is that the spectrum drops more rapidly at high energies than a power-law model, indicating the presence of a cutoff. Models that include a cutoff greatly improve the fit. An exponentially cutoff power-law (“cutoffpl” in XSPEC) with absorption gives and a much lower column density than cm-2. A Comptonization model (“comptt” in XSPEC) with absorption gives a statistically acceptable fit with . The spectrum fitted with a Comptonization model is shown in Figure 2. With this fit, the column density, using Anders & Grevesse (1989) abundances and Balucinska-Church & McCammon (1992) cross-sections, is cm-2 (90% confidence errors), which is consistent with the Galactic value of cm-2 (Dickey & Lockman, 1990). We fixed to the Galactic value and re-fitted the 1–20 keV spectrum. The Comptonization parameters from this fit are given in the caption of Figure 2. Below, we assume that the interstellar column density is at the Galactic value.

We use the fact that the peak X-ray burst flux must be below the Eddington luminosity to derive an upper limit on the distance to EXO 1747–214. To derive the peak flux, we use the X-ray burst spectral results from Magnier et al. (1989) and the peak 1–8 keV count rate of 2343 c/s, which we obtain from our re-analysis of the EXOSAT data. Fitting spectra around the peak of the burst with 0.5 s time resolution with a blackbody model, Magnier et al. (1989) find that the peak burst temperature is 2 keV. After fixing the temperature to 2 keV and assuming cm-2, we adjusted the blackbody normalization to give the peak 1–8 keV count rate. This leads to an unabsorbed 1–20 keV flux of erg cm-2 s-1. For radius expansion bursts from neutron stars in globular clusters (i.e., Eddington limited bursts from neutron stars at known distances), Kuulkers et al. (2003) found an average peak luminosity of erg s-1. From this luminosity and the peak flux of the EXO 1747–214 burst, we derive a distance upper limit of kpc.
2.3. A Search for the Quiescent X-Ray Counterpart with Chandra
We obtained a 24.5 ks Chandra observation of the EXO 1747–214 field on 2003 July 31 (Observation ID 3802). We used the Advanced CCD Imaging Spectrometer (ACIS, Garmire et al., 2003) with the target position placed on one of the back-illuminated ACIS chips (ACIS-S3). For our observation, the instrument was in the “VFAINT” mode, which provides the maximum information about each event and thus, the best rejection of background events. We started with the “level 1” event list produced by the standard data processing with ASCDS version 6.13.4 and performed further processing using the Chandra Interactive Analysis of Observations (CIAO) version 3.2 software and Calibration Data Base (CALDB) version 3.0.1. We used the CIAO routine acis_process_events to obtain a “level 2” event list and image, and we searched for sources using this image.
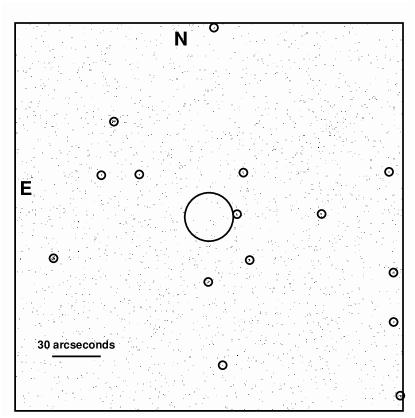
For our source search, we focused on a -by- square region of the ACIS-S3 chip centered on the EXOSAT position. We restricted the energy range to 0.3–8 keV and used the CIAO routine wavdetect (Freeman et al., 2002) to search for sources. Based on the image size of 488-by-488 pixels and our detection threshold of , we would expect to detect 1 spurious source. We detected 15 sources ranging from 3 to 24 counts. Using the background estimates generated by wavdetect and Poisson statistics, the 3 and 4 count sources are detected at significances of 3.5- and 4.1-, respectively. Figure 3 shows the Chandra image with the 15 sources circled. The 90% confidence EXOSAT error circle is also shown. None of the Chandra sources fall within the error circle, and only one of the sources lies close enough ( away) to be considered a possible quiescent counterpart to EXO 1747–214. The position of this possible counterpart, which is one of the sources with 4 counts, is R.A. = , decl. = (equinox J2000, uncertainty). Given the density of sources that we detect (15 sources in a 16 arcmin2 region), the probability of finding a source within of the best EXO 1747–214 position by chance is 19%. Thus, the possible counterpart could be an unrelated X-ray source.
Although the 3- detection threshold for the EXOSAT error region is close to 3 counts, considering the possible 4 count source just outside the EXOSAT error circle, the most concise statement of our results is that the number of 0.3–8 keV counts from the quiescent EXO 1747–214 counterpart is 4. This corresponds to a limit on the 0.3–8 keV count rate of c/s. To determine what this implies in terms of the source flux and luminosity, we used the CIAO tools to produce an ACIS response matrix for this observation. To calculate the flux upper limit, we assumed cm-2 and several different spectral models that are similar to the typical X-ray spectra of quiescent neutron star systems, including a thermal model, a non-thermal model, and a two-component model. For the thermal model, we used a neutron star atmosphere model (“nsa” in XSPEC, Zavlin, Pavlov & Shibanov, 1996) and assumed a source distance of 11 kpc (the upper limit), a neutron star mass of 1.4, and a neutron star radius of 10 km. The only other free parameter in the model is the temperature (). We adjusted to make the predicted count rate match the upper limit given above, and this occurs at 63 eV. For this model, the absorbed 0.3–8 keV flux is erg cm-2 s-1 and the unabsorbed flux is erg cm-2 s-1. Non-thermal power-law models with photon indeces of and 3 give upper limits on the unabsorbed flux of and erg cm-2 s-1, respectively. We also considered two-component, nsa plus power-law, models with eV along with the same nsa parameters as above. For photon indeces of and 2, the upper limits on the unabsorbed flux are and erg cm-2 s-1, respectively. In summary, the highest flux is obtained using the pure thermal model. Using this flux ( erg cm-2 s-1) along with the fact that kpc, we conclude that erg s-1 (0.3–8 keV).
2.4. Optical and Infrared Observations
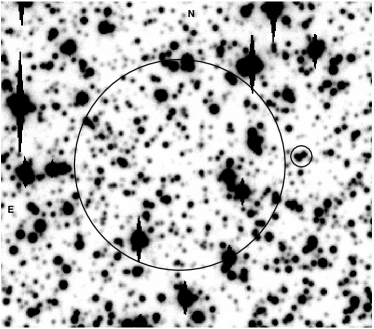
A couple of months after the Chandra observation, we obtained a deep -band image of the EXO 1747–214 field at Keck Observatory. For the single 600 s image, we performed bias subtraction and flat-fielding in the standard manner using IRAF333IRAF (Image Reduction and Analysis Facility) is distributed by the National Optical Astronomy Observatories, which are operated by the Association of Universities for Research in Astronomy, Inc., under cooperative agreement with the National Science Foundation.. To register the image, we identified six of the stars in the image with stars in the USNO-B catalog, and used IRAF routines to calculate the sky projection. For magnitude calibration, we obtained observations of Landolt (1992) standards PG 1657+078 and PG 0231+051 before and after observing the EXO 1747–214 field and performed aperture photometry for the standard stars as well as for several stars in the EXO 1747–214 field. Figure 4 shows the central part of the Keck image, including the EXO 1747–214 error circle and the possible Chandra counterpart described above. The possible counterpart is positionally coincident with three blended optical sources as shown in the figure. The three optical sources are approximately the same brightness, and all three are in the –19.8 range.
We also obtained an infrared -band image of the EXO 1747–214 field in 2002. We used the 4 meter telescope at Cerro Tololo Inter-American Observatory (CTIO) along with the Optical System for Imaging and Low-Resolution Integrated Spectroscopy (OSIRIS) instrument. We detect the three optical sources discussed above, and all three are in the –17.6 range.
While this positional coincidence certainly does not prove that this source is the EXO 1747–214 counterpart, it is notable that the properties of the optical sources are consistent with what might be expected for the EXO 1747–214 counterpart. The sources appear to be point-like as opposed to being extended as might be the case if they are galaxies. Also, the magnitude range is not unreasonable for a quiescent neutron star LMXB at a few kpc. For , , and kpc, the absolute magnitude is , which is consistent with a K3V or K4V star. In addition, a -magnitude of 17.4 and indicate a de-reddened color of 1.1, which is also consistent with main sequence K-type star. If the possible counterparts have spectra consistent with a those of main sequence stars, then they are not at a distance that is much more than a few kpc. For example, the -band measurement and a distance of 11 kpc imply and a late-F spectral type, but the colors are not consistent with an F-type star (even considering the range of measured and -magnitudes).
3. Discussion
3.1. Neutron Star/Black Hole Comparison
The upper limit on the EXO 1747–214 X-ray luminosity of erg s-1 (0.3–8 keV) places it among the faintest of the quiescent neutron star systems. One reason that faint neutron star systems are of interest is that claims for the existence of black hole event horizons rely on the faintness of black hole systems relative to neutron star systems (Narayan, Garcia & McClintock, 1997; Menou et al., 1999; Garcia et al., 2001; McClintock et al., 2003). The faintness of the black hole systems may be due to advection of accretion energy across the event horizon as occurs in Advection-Dominated Accretion Flow (ADAF) models (Narayan, Garcia & McClintock, 1997, and references therein) or to the lack of the thermal component that is often present for quiescent neutron star systems. In either case, one interpretation for the difference is that neutron stars have a solid surface while black holes do not.
To place our EXO 1747–214 luminosity upper limit in the context of this discussion, we compiled a list of 14 black hole and 20 (including EXO 1747–214) neutron star transients with constraints on the quiescent luminosity (). The black hole list is complete in the sense that it includes all confirmed black hole systems for which sensitive quiescent X-ray observations have been made. In all, there are 17 dynamically confirmed black hole systems (McClintock & Remillard, 2003; Casares et al., 2004; Orosz et al., 2004). Only GRS 1915+105, XTE J1650–500, and GS 1354–64 do not have quiescent X-ray coverage. We compiled the list of neutron star transients from the recent literature, including papers where neutron star sub-populations were studied (e.g., Jonker et al., 2004; Tomsick et al., 2004; Garcia et al., 2001). Our list is nearly complete for field systems, but we only included the best studied globular cluster systems (see Heinke et al., 2003, for additional globular cluster sources).
In previous work (e.g., Garcia et al., 2001), it has been argued that, for a black hole or neutron star system with a given orbital period (), the Eddington-scaled mass accretion rate would be expected to be the same for black hole and neutron star systems. If this is true, the Eddington-scaled X-ray luminosity is the best parameter for comparing the sources. We calculated for our list of systems, and the values are shown in Figure 5. For the black hole systems, the luminosities come from Tomsick et al. (2003) and references therein, and the black hole masses and errors on the masses come from Charles & Coe (2003). The neutron star luminosities come from the references shown in the Figure 5 caption. To determine the errors on , we assume for all systems that the unabsorbed soft X-ray fluxes are measured to an accuracy of 40% and that the distances are known to 25%. The assumed errors are not exactly correct for all sources, but they represent values that are typically quoted in the literature. While the black hole errors also include a contribution from the uncertainty in the black hole mass, we assume that all the neutron stars have masses of 1.4. The bandpasses for the luminosities are nearly the same being 0.3–8 keV, 0.3–7 keV, or 0.5–10 keV in all cases. It is important to keep in mind that we are only quoting the X-ray luminosities here and that bolometric corrections could be important. The sources in Figure 5 are ordered according to orbital period in cases for which is known.

The values shown in Figure 5 indicate that the black holes are, on average, fainter. For black holes, the median luminosity is a factor of 42 lower than for neutron stars. While part of this effect is due to the higher black hole masses, the average black hole mass is 7.7, which is only a factor of 5.5 higher than the neutron star masses assumed. Currently, the only clear overlap between the distributions is caused by the high luminosity of V404 Cyg, and as this source has the longest orbital period and has an evolved optical companion, this may be due to a higher quiescent mass accretion rate for V404 Cyg. However, several of the neutron star systems, including EXO 1747–214, have upper limits that are approaching the values seen for some of the other black hole systems. It is important to determine how faint sources like EXO 1747–214 and 3A 1905+000 (Juett & Chakrabarty, 2005) are (as well as their orbital periods) as the neutron star and black hole distributions could significantly overlap in contradiction to what is expected for accretion models that include black hole advection such as the ADAF model.
3.2. Neutron Star Cooling
One reason that EXO 1747–214 may be so faint is that, as far as we know, it has been in quiescence for 20 years. Based on the theory of deep crustal heating for transient neutron stars (Brown, Bildsten & Rutledge, 1998), the evolution of the X-ray flux in the thermal component between outbursts depends on the source’s mass accretion (and thus outburst) history. Rutledge et al. (2002) show that for a long (13 year) outburst, the temperature of the crust can rise significantly, and it can take years or decades (depending on the conductivity of the crust and the type of neutrino cooling that occurs) for the crust to reach thermal equilibrium. At that point, the source will reach its lowest luminosity at a level set by the temperature of the neutron star’s core, which depends on the mass accretion rate over a 10,000 year time scale (Colpi et al., 2001).
To some extent, the X-ray coverage in the 1980s limits our knowledge of the EXO 1747–214 outburst history. Historically, the source has only been detected by EXOSAT, and it was detected in 1984 June and 1985 April. In both cases, the persistent X-ray flux was near erg cm-2 s-1. The missions with all-sky coverage in that era were Ariel V, which lasted until 1980 and Ginga which began in 1987 (Chen, Shrader & Livio, 1997). The 90% sky coverage from Tenma during 1983–1984 make it unlikely that the EXO 1747–214 outburst started much before 1984 June. Thus, assuming that EXO 1747–214 had a single outburst, its duration was very likely between 10 months and 3 years. For the 13 year outburst from KS 1731–260, Rutledge et al. (2002) find that the neutron star cooling is dominated by the core rather than the crust 1 year after the outburst for a high-conductivity crust and 30 years after the outburst for a low-conductivity crust. Given the shorter duration of the EXO 1747–214 outburst, it is likely that EXO 1747–214 was in the core-dominated phase when the Chandra observation occurred.
We can calculate the outburst recurrence time predicted by the Brown, Bildsten & Rutledge (1998) theory for EXO 1747–214. The recurrence time is given by (Wijnands et al., 2001; Tomsick et al., 2004), where and are the outburst duration and average flux level during the outburst, respectively, and is the quiescent flux level. Assuming an outburst duration of 10 months (at the lower end of the range derived above) and an average outburst flux of erg cm-2 s-1, the upper limit on the quiescent flux of erg cm-2 s-1 implies that years. If, in the future, it is found that the recurrence time is in fact shorter than this value, then a mechanism for enhanced cooling of the core would be necessary.
4. Conclusions and Future Work
EXO 1747–214 is one of several neutron star systems with a quiescent luminosity that is lower than the typical erg s-1 range. Our Chandra observation indicates a 0.3–8 keV luminosity upper limit of erg s-1. In the Chandra image, there is only one source that is a possible EXO 1747–214 quiescent counterpart. The source is detected at a significance level of 4.1-, leaving a small chance that it is spurious, and it is just outside the 90% confidence EXOSAT error circle. Overall, we cannot rule out the possibility that the source is unrelated to EXO 1747–214. Our optical and IR images show that the position of this possible counterpart is consistent with three blended optical/IR sources with -band magnitudes between 19.4 and 19.8 and -band magnitudes between 17.2 and 17.6. If one of these is the EXO 1747–214 counterpart, it would imply a distance of a few kpc, significantly lower than the 11 kpc upper limit derived from the peak X-ray burst flux. This, in turn, would imply a significantly lower quiescent X-ray luminosity.
As EXO 1747–214 is one of the faintest (if not the faintest of the) neutron star transients in quiescence, it is important to obtain deeper X-ray observations to determine the actual quiescent flux. This is important for studies of neutron star cooling as well as the comparison between the quiescent radiative efficiency of black hole vs. neutron star sources. Another avenue for further study is to obtain optical spectra of the candidate counterparts. For example, detecting an H emission line would be a strong X-ray binary indicator. Finally, it is worth pointing out that finding the optical counterpart is likely the only way that we will be able to improve the determination of the source distance.
References
- Anders & Grevesse (1989) Anders, E., & Grevesse, N., 1989, Geochimica et Cosmochimica Acta, 53, 197
- Balucinska-Church & McCammon (1992) Balucinska-Church, M., & McCammon, D., 1992, ApJ, 400, 699
- Brown, Bildsten & Rutledge (1998) Brown, E. F., Bildsten, L., & Rutledge, R. E., 1998, ApJ, 504, L95
- Cackett et al. (2005) Cackett, E. M., et al., 2005, ApJ, 620, 922
- Campana et al. (2005) Campana, S., Ferrari, N., Stella, L., & Israel, G. L., 2005, A&A, 434, L9
- Campana et al. (2002) Campana, S., et al., 2002, ApJ, 575, L15
- Casares et al. (2004) Casares, J., Zurita, C., Shahbaz, T., Charles, P. A., & Fender, R. P., 2004, ApJ, 613, L133
- Charles & Coe (2003) Charles, P. A., & Coe, M. J., 2003, Review Article, astro-ph/03008020
- Chen, Shrader & Livio (1997) Chen, W., Shrader, C. R., & Livio, M., 1997, ApJ, 491, 312
- Colpi et al. (2001) Colpi, M., Geppert, U., Page, D., & Possenti, A., 2001, ApJ, 548, L175
- de Korte et al. (1981) de Korte, P. A. J., et al., 1981, Space Science Reviews, 30, 495
- Dickey & Lockman (1990) Dickey, J. M., & Lockman, F. J., 1990, ARA&A, 28, 215
- Freeman et al. (2002) Freeman, P. E., Kashyap, V., Rosner, R., & Lamb, D. Q., 2002, ApJS, 138, 185
- Garcia et al. (2001) Garcia, M. R., McClintock, J. E., Narayan, R., Callanan, P., Barret, D., & Murray, S. S., 2001, ApJ, 553, L47
- Garmire et al. (2003) Garmire, G. P., Bautz, M. W., Ford, P. G., Nousek, J. A., & Ricker, G. R., 2003, in X-Ray and Gamma-Ray Telescopes and Instruments for Astronomy. Edited by Joachim E. Truemper, Harvey D. Tananbaum. Proceedings of the SPIE, 4851, 28
- Gottwald et al. (1991) Gottwald, M., Steinle, H., Pietsch, W., & Graser, U., 1991, A&AS, 89, 367
- Heinke et al. (2003) Heinke, C. O., Grindlay, J. E., Lloyd, D. A., & Edmonds, P. D., 2003, ApJ, 588, 452
- Jonker et al. (2004) Jonker, P. G., Galloway, D. K., McClintock, J. E., Buxton, M., Garcia, M., & Murray, S., 2004, MNRAS, 354, 666
- Jonker, Wijnands & van der Klis (2004) Jonker, P. G., Wijnands, R., & van der Klis, M., 2004, MNRAS, 349, 94
- Juett & Chakrabarty (2005) Juett, A. M., & Chakrabarty, D., 2005, ApJ, 627, 926
- Kuulkers et al. (2003) Kuulkers, E., den Hartog, P. R., in’t Zand, J. J. M., Verbunt, F. W. M., Harris, W. E., & Cocchi, M., 2003, A&A, 399, 663
- Landolt (1992) Landolt, A. U., 1992, AJ, 104, 340
- Lattimer & Prakash (2004) Lattimer, J. M., & Prakash, M., 2004, Science, 304, 536
- Magnier et al. (1989) Magnier, E., Lewin, W. H. G., van Paradijs, J., Tan, J., Penninx, W., & Damen, E., 1989, MNRAS, 237, 729
- McClintock & Remillard (2003) McClintock, J., & Remillard, R., 2003, Review Article, astro-ph/0306213
- McClintock et al. (2003) McClintock, J. E., Narayan, R., Garcia, M. R., Orosz, J. A., Remillard, R. A., & Murray, S. S., 2003, ApJ, 593, 435
- Menou et al. (1999) Menou, K., Esin, A. A., Narayan, R., Garcia, M. R., Lasota, J., & McClintock, J. E., 1999, ApJ, 520, 276
- Narayan, Garcia & McClintock (1997) Narayan, R., Garcia, M. R., & McClintock, J. E., 1997, ApJ, 478, L79
- Orosz et al. (2004) Orosz, J. A., McClintock, J. E., Remillard, R. A., & Corbel, S., 2004, ApJ, 616, 376
- Parmar et al. (1985) Parmar, A. N., White, N. E., Giommi, P., Stella, L., Sweeney, M., & Watson, M., 1985, IAU Circular, 4058
- Rutledge et al. (2002) Rutledge, R. E., Bildsten, L., Brown, E. F., Pavlov, G. G., Zavlin, V. E., & Ushomirsky, G., 2002, ApJ, 580, 413
- Taylor et al. (1981) Taylor, B. G., Andresen, R. D., Peacock, A., & Zobl, R., 1981, Space Science Reviews, 30, 479
- Tomsick et al. (2003) Tomsick, J. A., et al., 2003, ApJ, 597, L133
- Tomsick et al. (2004) Tomsick, J. A., Gelino, D. M., Halpern, J. P., & Kaaret, P., 2004, ApJ, 610, 933
- Warwick et al. (1988) Warwick, R. S., Norton, A. J., Turner, M. J. L., Watson, M. G., & Willingale, R., 1988, MNRAS, 232, 551
- Wijnands (2004) Wijnands, R., 2004, astro-ph/0405089
- Wijnands, Heinke & Grindlay (2002) Wijnands, R., Heinke, C. O., & Grindlay, J. E., 2002, ApJ, 572, 1002
- Wijnands et al. (2005a) Wijnands, R., Heinke, C. O., Pooley, D., Edmonds, P. D., Lewin, W. H. G., Grindlay, J. E., Jonker, P. G., & Miller, J. M., 2005a, ApJ, 618, 883
- Wijnands et al. (2005b) Wijnands, R., Homan, J., Heinke, C. O., Miller, J. M., & Lewin, W. H. G., 2005b, ApJ, 619, 492
- Wijnands et al. (2004) Wijnands, R., Homan, J., Miller, J. M., & Lewin, W. H. G., 2004, ApJ, 606, L61
- Wijnands et al. (2001) Wijnands, R., Miller, J. M., Markwardt, C., Lewin, W. H. G., & van der Klis, M., 2001, ApJ, 560, L159
- Zavlin, Pavlov & Shibanov (1996) Zavlin, V. E., Pavlov, G. G., & Shibanov, Y. A., 1996, A&A, 315, 141
| Start | Observatory | Instrument | Energy | Exposure |
|---|---|---|---|---|
| Time (UT) | Band/Filter | Time (s) | ||
| 1985 April 8, 2.3 h | EXOSAT | CMA | Thin Lexan444The three filters cover the 0.05–2.5 keV energy range with the different effective area curves described in the text. | 869 |
| 1985 April 11, 10.0 h | EXOSAT | ME | 1–20 keV | 22,450 |
| 1985 April 11, 10.4 h | EXOSAT | CMA | Thin Lexana | 9,171 |
| 1985 April 11, 11.2 h | EXOSAT | CMA | Al/Parylenea | 2,266 |
| 1985 April 11, 11.9 h | EXOSAT | CMA | Borona | 2,493 |
| 2002 February 24, 9.5 h | CTIO555We used the 4 meter telescope at Cerro Tololo Inter-American Observatory with the OSIRIS (Optical System for Imaging and Low-Resolution Integrated Spectroscopy) instrument. | OSIRISb | 120 | |
| 2003 July 31, 18.2 h | Chandra | ACIS-S | 0.3–8 keV | 24,479 |
| 2003 September 21, 5.9 h | Keck | ESI | 600 |