Submillimeter observations of Distant Red Galaxies: uncovering the 1 mJy 850m-population
Abstract
We present a study of the submillimeter (submm) emission of Distant Red Galaxies (DRGs). The DRGs are selected by the criterion , and are generally massive galaxies at redshifts higher than 2, with red rest-frame optical colors. Using a deep SCUBA submm image of a field centred on the cluster MS , we obtain a statistical detection of the DRGs at redshift , with an average 850 m flux density of mJy. The detection implies an average star formation rate (SFR) of M⊙ yr-1 (lensing corrected), assuming that the far-infrared (FIR) spectral energy distribution (SED) is well-described by a modified blackbody. The SFR derived from the submm agrees well with SFRs derived from SED fitting of optical-near-infrared data and average X-ray emission. Constant Star Formation models imply ages of 2Gyr, extinction mag, which is consistent with the FIR to rest-frame optical luminosity ratio of . DRGs are older and have lower SFRs relative to optical luminosity than (ultra-)luminous infrared galaxies, although their FIR luminosities are similar. The DRGs at and the Extremely Red Objects () at , which were also investigated, contribute 5.7 and 5.9 Jy deg-2 respectively to the submm background. Simple estimates suggest that these populations contribute of the flux from sources with mJy, which is where the peak of energy is produced. We have therefore uncovered one of the most important populations of galaxies contributing to the sub-mm background.
Subject headings:
Galaxies: high-redshift — galaxies: evolution — submillimeter1. INTRODUCTION
Members of the recently defined galaxy population Distant Red Galaxies (DRGs) are identified by their red observed near-infrared colors, (Franx et al. 2003; van Dokkum et al. 2003; Förster Schreiber et al. 2004 (henceforth FS04)). Galaxies selected by this color cut are generally at , and are hence selected on their red colors in the rest-frame optical. Their stellar populations are relatively old, or are highly dust obscured. DRGs account for over half of the cosmic stellar mass at the high mass end at redshifts , somewhat more than the contribution from Lyman Break Galaxies (LBGs) (Rudnick et al. 2003; FS04). One of the most pressing questions concerning these galaxies is how high their star formation rates (SFRs) are. Based on near-infrared (near-IR) spectroscopy, high star formation rates of yr-1 and high stellar masses of (15)1011 M⊙ were determined (van Dokkum et al., 2004). Unfortunately, near-IR spectroscopy is available for only a few galaxies at this moment. Star formation rates can also be estimated using other techniques, especially using radio, X-ray or submillimeter (submm) observations. Most of the DRGs are too faint to be detected individually at these wavelengths, but it is possible to estimate their average star formation rate by “stacking” the fluxes for a large number of sources. Using this technique, Rubin et al. (2004) have detected the X-ray emission of DRGs in the field of the cluster MS and derived an average star formation rate of M⊙ yr-1 if all the X-ray flux is attributed to the SFR. However, the flux contribution from faint AGNs remains unclear.
Here we present a different SFR measurement for the DRGs, based on the average 850m flux density, which we attribute to emission from dust that has been heated by young stars. We have taken very deep SCUBA m observations of the field of the cluster MS (Knudsen 2004; Knudsen et al. in prep). These deep data provide a unique opportunity for studying the submm properties of DRGs. Throughout this Letter we will assume an , cosmology with km s-1 Mpc-1. Unless otherwise stated, we use Vega magnitudes.
2. SUBMILLIMETER DATA
Submillimeter data for MS were obtained using the Submillimetre Common-User Bolometer Array (SCUBA; Holland et al. 1999) at 850 m on the 15 m James Clerk Maxwell Telescope at Mauna Kea, Hawaii. Total integration time was 49 hours, distributed almost evenly over 3 pointing centers to cover the entire field of interest. The data were reduced using SURF (Jenness & Lightfoot, 1998), and sources were extracted using the Mexican Hat Wavelet algorithm (Barnard et al., 2004; Knudsen et al., 2005). Noise properties of the data were determined using Monte Carlo simulations of artificial datasets. Details of these reduction and analysis methods are described in Knudsen (2004) and Knudsen et al. (2005). The total area of the map is 14.4 arcmin2, though for the analysis the outer 23′′ edge has been trimmed off due to high noise leaving a useful area is 12.8 arcmin2. The image has an area-weighted r.m.s. noise of mJy beam-1, with variations between 0.9 and 1.6 mJy beam-1. The flux calibration uncertainty at 850 m is about 10%. The Full Width Half Maximum (FWHM) of a point source in the map is 15′′. The astrometric accuracy is approximately , due to the pointing uncertainty of the JCMT.
Nine submm sources are detected with flux densities of mJy with signal-to-noise ratio . Two of the nine submm sources have been securely identified, both with DRGs, namely the galaxies MS-1383 which has a spectroscopic redshift of 2.423 (van Dokkum et al., 2004) and MS-723 which has a photometric redshift of 1.88 (Förster Schreiber et al., 2005). Five of the other submm sources have likely identifications, with at least one DRG or Extremely Red Object (ERO, defined by an observed color ) nearby. The two remaining sources have no obvious counterpart. A mass model for the foreground cluster (Hoekstra et al., 2000) shows that the gravitational lensing magnification is small for the sources, on average around 20%.
3. SUBMM EMISSION FROM DISTANT RED GALAXIES
3.1. Statistical analysis
We measured the characteristic submm fluxes for DRGs as a class of galaxies by measuring the flux in the 850 m map at the position of all the galaxies in the sample. We found an average 850 m flux of mJy for 30 DRGs with , and with an uncertainty on their -band magnitude smaller than 0.1, and minimum weight in the photometry (this measure is related to the total integration time – see FS04), present within the area covered by the SCUBA map. As the sensitivity is not uniform across the field, we determine the weighted mean and standard deviation, weighted by the squared reciprocal of the 1 r.m.s. noise at the position. The weighted mean compared to the unweighted mean only changes the result by a few percent, indicating that the weighted result is not dominated by a few data points with high weights. Webb et al. (2004) discussed a possible bias in this procedure due to confusion. If two or more DRGs are separated by less than the 850 m beam, emission might be counted twice. This is corrected for by estimating the flux contribution from each of the close-by DRGs to the flux measured at the given position (for details see: Webb et al. 2004). We find that this effect influences our measurements by 210%.
As mentioned above, two DRGs are identified as the counterparts of two individual SCUBA detections. Additionally, three other DRGs are found within the identification search radius of three other SCUBA detections, though these are not secure identifications. We calculate the mean 850 m flux density, both including and excluding these five objects. Results are summarized in Table 1. If we omit the DRGs associated with discrete SCUBA sources, we obtain an average flux of mJy, demonstrating that the detection is not caused solely by these galaxies. We show the average images of both samples in Fig. 1. The emission is well-centered.
| Including all | Excluding discrete sources | ||||||||||
|---|---|---|---|---|---|---|---|---|---|---|---|
| Sample | % EBL | ||||||||||
| (1) | (2) | (3) | (4) | (5) | (6) | (7) | (8) | (9) | (10) | (11) | |
| all- | 22.5 | 30 | 21.8(30.9) | 169 | 7.3 | 23.2 | 25 | 15.1 | |||
| 2z3.5 | 22.5 | 18 | 13.0(18.4) | 159 | 7.9 | 20.2 | 15 | 13.8 | |||
| no-DRGs | 22.5 | 71 | 6.5(9.3) | 20 | 4.7 | 4.3 | 67 | 1.2 | |||
| 2z3.5 | |||||||||||
| CSF | 21.7 | 9 | 10.3(14.6) | 238 | 10.4 | 22.9 | 7 | 17.7 | |||
| SSP | 21.7 | 5 | 1.6(2.3) | 96 | 6.1 | 15.7 | |||||
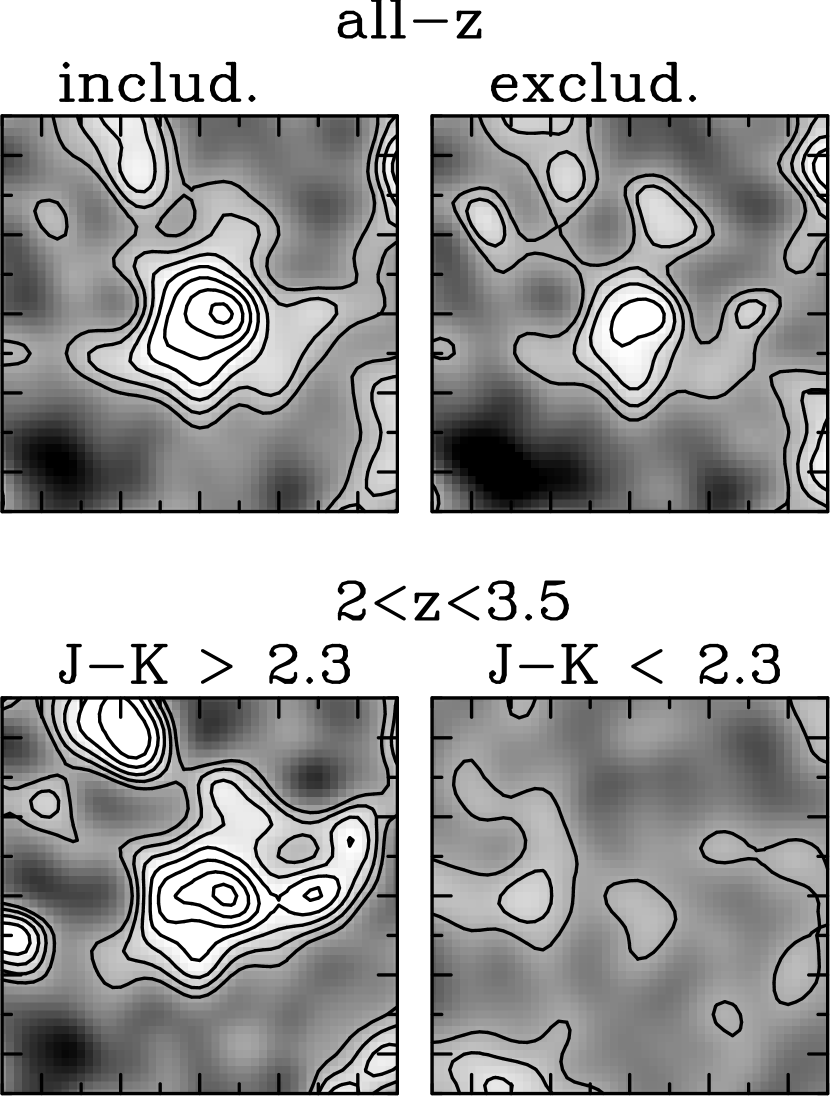
For DRGs restricted to the redshift interval 2 3.5, we obtain an average flux of mJy for the DRGs. For comparison, the average flux for galaxies at 2 3.5 which are not DRGs, i.e. (henceforth refered to as non-DRGs), is substantially lower at only .
Following FS04, we fitted the full optical/near-IR spectral energy distribution (SED) with stellar population models for DRGs with 21.7 and 2 3.5. The sample was separated into those best fit by constant star formation models (CSF) or single age stellar populations (SSP). The CSF-subsample has an average flux of mJy, while the SSP-subsample has an average flux of . Excluding the DRGs associated with discrete SCUBA sources affects only the CSF subsample and its mean flux decreased to mJy. We note that the lensing correction is less than or comparable to the uncertainty of the average fluxes.
3.2. Monte Carlo simulations
To test the reliability of the detection of the mean 850 m flux from the DRGs, Monte Carlo (MC) simulations were performed by making the statistical measurements at random positions in the field. The MC simulations were repeated 10000 times. As with the real data, the MC measurements were corrected for the confusion of two or more sources separated by less than the distance of a beam. For 45-50 random positions on the map, the weighted mean is 0.130.17 mJy. As the noise distribution deviates from Gaussian, the probability for getting a 3 detection at random positions is 2.4 %. The probabilities for a 4 detection and a 5 detection are 0.2 % and 0.02 % respectively. A similar result is seen for 20-30 and for 10-20 random positions. Thus we conclude that the detected mean 850 m flux is real.
3.3. Possible systematic uncertainties
We performed simulations to verify how reliable the average detections were. We assumed that the star formation rate is proportional to restframe luminosity, with different ratios for different classes of objects. We found that systematic errors occur at the level of 0.1-0.2 mJy for the average fluxes. For the DRGs and EROs this is not a concern, but for the fainter objects (e.g., the non-DRGs with average flux 0.14 mJy) this implies that the systematic errors are at least as large as the detections. The systematic problems are due to a combination of effects, including the negative “sidelobes” in the beam pattern, which cause the total flux of the map to be zero, and can reduce the flux for the faint, but abundant non-DRGs, and superpositions of objects. Obviously, similar observations of other fields would help to constrain the errors for the DRGs; but it is unclear whether such measurements will ever constrain the flux from the faint non-DRGs.
4. DISCUSSION
4.1. Implied star formation rates of the DRGs
The average SFR of the DRGs can be estimated from the average submm flux assuming an SED and an initial mass function (IMF). As the submm and far-infrared (FIR) SED of the DRGs is unknown, we use the SED description for dusty starburst galaxies from Yun & Carilli (2002) for calculating the FIR luminosity. Because of the large negative -correction in the submm, the observed 850 m flux density is essentially constant between redshift 1 and 8 for a given luminosity. For the DRG 2 3.5 sample, the average FIR luminosity is L⊙, which is comparable to the luminosity of the local ultraluminous infrared galaxy (ULIRG) Arp 220. Furthermore, we base the conversion between FIR luminosity and SFR on Kennicutt (1998), where a Salpeter IMF in the mass range 0.1-100 M⊙ is assumed. However, we assumed a mean age of the stellar population of 1Gyr and a constant star formation during that time, which lowers the conversion by a factor of 1.5: SFR[M⊙ yr-1] [L⊙]. We assumed this longer mean age since modeling of the optical-Near IR SEDs suggest ages of 1-2 Gyr (FS04). We obtain an average SFR of M⊙ yr-1 for , where the error reflects the accuracy of the submm detection. When correcting for gravitational lensing, this is an SFR of M⊙ yr-1. We note that the FIR luminosity and SFR have considerable uncertainties as they depend on the assumed shape of the SED and IMF.
The average SFR derived from the thermal dust emission in the far-IR ( 250 m) can be compared to the SFRs inferred from the SED fits to the optical and near-IR data (FS04). The SFRs from SED fits are rather model-dependent. One of the main uncertainties is the parametrization of the star formation history (constant, declining etc). The maximum is generally given by constant formation rates, and is on average 170 M⊙ yr-1 for the sample studied here (FS04). This compares well with the SFR derived from the submm flux.
The good agreement suggests that the majority of DRGs are well approximated by simple models with constant star formation rate, ages of 2 Gyr, and high extinction (FS04). Despite the abundant dust the overall ratio of , which is in good agreement with , is lower than that of ULIRGs in the nearby universe. This implies that DRGs are forming stars more steadily over longer periodes than nearby starbursts. We expect to find very large reservoirs of cold gas to sustain these high star formation rates.
When interpreting the average rates it should be noted that not all DRGs are likely to be forming stars. In a deep Spitzer study of DRGs in HDF-South, Labbé et al. (2005) found that 30% are best fit by old stellar populations at redshifts higher than 2, and the remaining are best fit by constant star formation models. The results suggest that at redshifts higher than 2, the majority of massive galaxies were still forming stars at rather high rates, enough to build up their stellar mass in 1-2 Gyr.
4.2. Contribution to the comoving star formation density
We derive a comoving star formation density of about 0.045 M⊙ yr-1 Mpc-3 for the DRGs with . This can be compared with the comoving star formation density derived from UV selected galaxies at of approximately 0.022 to 0.11 M⊙ yr-1 Mpc-3 (Steidel et al 1999), excluding, and including a correction for dust absorption. As the dust correction is uncertain for UV selected galaxies, especially at the faint end which contributes a large fraction of the flux, we have to conclude that the contributions of the two populations are similar, but still uncertain. The main uncertainty for the DRGs is the luminosity function at the faint end, and the main uncertainty for the LBGs is the dust correction.
We note that several authors have tried to detect the average submm flux of the LBGs (e.g., Chapman et al. 2000, Webb et al 2003), without statistically significant results. Since our simulations suggest that systematic effects can be large at the very faint end, the average 850 m flux of these sources remains an open question.
4.3. Dissecting the contribution to the sub-mm background
Each population of high redshift galaxies contributes to the submm Extragalactic Background Light (EBL). Previous studies have addressed this for the LBG and the ERO populations. There has been no significant statistical detection of the submm emission from LBGs. Through SCUBA observations, Chapman et al. (2000) placed upper limits on the LBG contribution to the submm EBL of 0.2%, while Webb et al. (2003) placed an upper limit of 20% when extrapolating to a redshift interval 1 5. Contrary to the LBG case, statistical detection of the ERO population has been successful. Wehner et al. (2002) and Webb et al. (2004) find an average submm flux of mJy and mJy respectively, and determine the contributions to the submm EBL to be about half and 10%. The discrepancy between the results can be primarily assigned to the difference in depth of the ERO selection and the strong clustering of EROs, as the fields studied by Wehner et al. (2002) appear to have a large overdensity of EROs.
Using the present study we constrain the contribution of the DRGs to the submm EBL. For the whole sample of DRGs in the MS 105403 field, the total flux density is approximately 9.6 Jy/deg2, which is 21.8% of the EBL value measured by Fixsen et al. (1998) of 44 Jy/deg2 and 30.9% of the value from Puget et al. (1996) of 31 Jy/deg2. For the DRG sample limited to the redshift range the contribution is 5.7 Jy/deg2, i.e. 12.9% [18.4%] of the result from Fixsen et al. (1998) [Puget et al. (1996)]. We can perform the same measurement for the EROs in the interval . We apply similar magnitude and uncertainty cuts as for the DRGs (see section 3). We obtain an average flux of mJy, by averaging 35 sources, which implies a comoving star formation rate density of 0.085 M⊙ yr-1 Mpc-3. The total contribution from the EROs is 5.9 Jy/deg2. Hence the total contribution to the submm EBL of the EROs at and the DRGs at is 11.6 Jy/deg2.
The surface density of the two populations combined is arcmin-2 down to mag, similar to the surface density derived from the submm number counts, where arcmin-2.
We can use our measured ratios of SFR/ to predict the fluxes of the EROs and DRGs at : we assume they all have the same ratio, i.e., SFR scales linearly with . We assume that the ratio is that of non-DRGs for the other galaxies at the same redshift interval. Using this very simple assumption, we find that the EROs+DRGs contribute 12.3 Jy deg-2. This is about 50% the background between mJy determined by Knudsen (2004), which is 26 Jy deg-2. For the non-EROs/DRGs at and we estimate 1.4 Jy deg-2.
It is interesting to speculate whether there exists an evolutionary link between the massive high redshift galaxy populations, namely the DRGs and EROs and the submm galaxies (SMGs) with mJy, which are found to have comparable masses (Greve et al., 2005). Possibly the SMGs represent a short-lived phase with a duration of Myr (Chapman et al., 2005), which is times shorter than what we find for the DRGs. The surface density of bright SMGs is about 0.2 arcmin-2. This relative to the surface density of DRGs and EROs, is comparable to the ratio of the duration of the phases.
In summary, the submm detection of the DRGs strongly supports that these high-, massive galaxies are undergoing star formation at high rates. Furthermore, the results presented here, based on simple assumptions, imply that DRGs and EROs dominate the counts around 1 mJy.
References
- Barnard et al. (2004) Barnard, V.E., Vielva, P., Pierce-Price, D.P.I., Blain, A., Barreiro, R.B., Richer, J.S., Qualtrough, C., 2004, MNRAS, 352, 961
- Chapman et al. (2000) Chapman, S.C., et al., 2000, MNRAS, 319, 318
- Chapman et al. (2005) Chapman, S.C., Blain, A.W., Smail, I., Ivison, R.J., 2005, ApJ, 622, 772
- Fixsen et al. (1998) Fixsen, D.J., Dwek, E., Mather, J.C., Bennett, C.L., Shafer, R.A., 1998, ApJ, 508, 123
- Franx et al. (2003) Franx, M., et al., 2003, ApJ, 587, L79
- Förster Schreiber et al. (2004) Förster Schreiber, N.M., et al., 2004, ApJ, 616, 40 (FS04)
- Förster Schreiber et al. (2005) Förster Schreiber, N.M., et al., 2005, AJ, in press
- Greve et al. (2005) Greve, T.R., et al., 2005, MNRAS, 359, 1165
- Hoekstra et al. (2000) Hoekstra, H., Franx, M., & Kuijken, K. 2000, ApJ, 532, 88
- Holland et al. (1999) Holland, W.S., et al., 1999, MNRAS, 303, 659
- Hughes et al. (1998) Hughes, D.H., et al., 1998, Nature, 394, 241
- Jenness & Lightfoot (1998) Jenness, T., Lightfoot, J.F., 1998, Astronomical Data Analysis Software and Systems VII, A.S.P. Conference Series, Vol. 145, eds. R. Albrecht, R.N. Hook and H.A. Bushouse, p.216
- Kennicutt (1998) Kennicutt, R.C., 1998, ARA&A, 36, 189
- Knudsen (2004) Knudsen, K.K., 2004, Ph.D. Thesis (Leiden University)
- Knudsen et al. (2005) Knudsen, K.K., et al., 2005, MNRAS, submitted
- Labbé et al. (2005) Labbé, I., et al., 2005, ApJ, 624, L81
- Madau et al. (1996) Madau, P., Ferguson, H.C., Dickinson, M.E., Giavalisco, M., Steidel, C.C., Fruchter, A., 1996, MNRAS, 283, 1388
- Puget et al. (1996) Puget, J.-L., Abergel, A., Bernard, J.-P., Boulanger, F., Burton, W.B., Desert, F.-X., Hartmann, D., 1996, A&A, 308, L5
- Rubin et al. (2004) Rubin, K.H.R., van Dokkum, P.G., Coppi, P., Johnson, O., Förster Schreiber, N.M., Franx, M., van der Werf, P., 2004, ApJ, 613, L5
- Rudnick et al. (2003) Rudnick, G., et al., 2003, ApJ, 599, 847
- Steidel et al. (1999) Steidel, C.C., Adelberger, K.L., Giavalisco, M., Dickinson, M., Pettini, M., 1999, ApJ, 519, 1
- van Dokkum et al. (2003) van Dokkum, P.G., et al., 2003, ApJ, 587, L83
- van Dokkum et al. (2004) van Dokkum, P.G., et al., 2004, ApJ, 611, 703
- Webb et al. (2003) Webb, T.M., et al., 2003, ApJ, 582, 6
- Webb et al. (2004) Webb, T.M.A., Brodwin, M., Eales, S., Lilly, S.J., ApJ, 605, 645
- Wehner et al. (2002) Wehner, E.H., Barger, A.J., Kneib, J.-P., 2002, ApJ, 577, L83
- Yun & Carilli (2002) Yun, M.S., Carilli, C.L., 2002, ApJ, 568, 88