Abstract
We determined ages for 52 star clusters with masses in the low surface brightness spiral galaxy NGC 45. Four of these candidates are old globular clusters located in the bulge. The remaining ones span a large age range. The cluster ages suggest a continuous star/cluster formation history without evidence for bursts, consistent with the galaxy being located in a relatively unperturbed environment in the outskirts of the Sculptor group.
[Continuous Star Clusters formation in the spiral NGC45]CONTINUOUS STAR CLUSTER FORMATION IN THE SPIRAL NGC 45
ESO Garching, Germany; 22affiliationmark: ESO / ST-ECF, Germany
1 Introduction
Star clusters are an ideal tool to study star formation histories in nearby galaxies. Historically, star clusters have been studied in the Milky Way, Local Group, ellipticals, mergers and starbursts. But there are only few studies in low luminosity galaxies. The closest examples with similar luminosity to NGC 45 are LMC, SMC, and M33 (e.g. Ct et al. [1997]). Star clusters in these galaxies show different star formation histories. LMC shows 3 bursts of star formation (Pietrzynski [2000]) while SMC shows a more uniform star cluster formation history. M33 also shows a continuous star cluster formation (Chandar [1999]). But beyond the Local Group, the properties of cluster populations and star formation in general are poorly known in normal galaxies. NGC 45 is an interesting galaxy: It is an outlying member of the sculptor group (m-M)=28.42 (Freedman et al. [1992]). It is located in an unperturbed environment and it has a low luminosity of =-17.13 (Bottinelli [1985]). In the presented work in progress, we study the star formation history of this spiral galaxy by looking at the NGC45 star cluster system.
2 Observations
In our study we used HST ACS and WFPC2 data. We acquired the images using the filters F435W (B), F555W (V), F814W (I) and F336W (U). The object detection was performed using SExtractor. The aperture photometry of 6 pixels radius was done using the IRAF/PHOT task. We selected our cluster candidates by looking at the physical object sizes. For this purpose we used two criteria. We selected cluster candidates as objects with extended FWHM according to SExtractor and as well as with extended FWHM according to BAOLAB ISHAPE (Larsen [1999]). 52 “round”, extended objects satisfied the criteria and were treated as star clusters.
3 Color Magnitude diagram
The color-magnitude diagram (Figure 1) shows two main cluster populations: a red one around (likely globular clusters) and another, broader distribution around which are likely young cluster candidates.
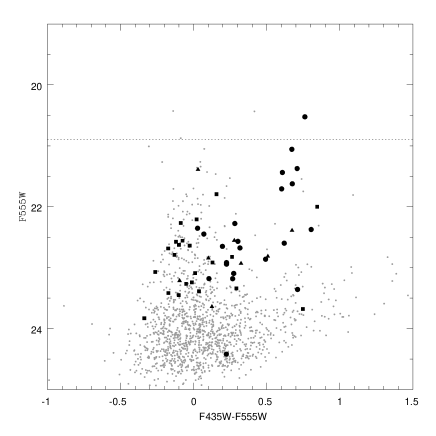
.
4 Color-Color diagram: Ages and Masses
One of the principle problems in deriving ages, metallicities and masses for star clusters in spirals, is the fact that we do not know the extinction towards the individual objects. Bik et al. ([2003]) proposed a method known as the 3D fitting method to solve this problem. It consists in minimizing the extinction, mass and age for each single cluster using a SSP model (In our case: GALEV, Ander et al. [2003]) assuming a fixed metallicity. We apply this method to our dataset assuming a solar metallicity for all clusters.
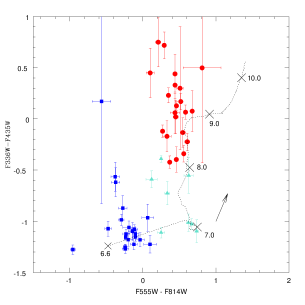
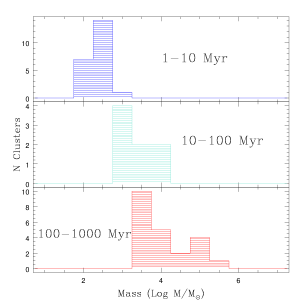
The color-color diagram in figure 2 (left plot) shows all the star clusters corrected for reddening. We use the same symbols as in Figure 1. The arrow indicates the reddening corresponding to a 1 magnitude extinction in . A theoretical SSP model track for ages between 1 Myr and 10 Gyr and a solar metallicity is also shown in dashed line. The clusters are distributed across the theoretical track and show an age distribution without signatures of discrete bursts. The estimated masses of the clusters are shown in the right part of the figure 2 for three age bins.The upper part shows 22 clusters between 1 - 10 Myr old, the middle part 8 clusters between 10-100 Myr and the lower part shows 22 clusters between 100-1000 Myr. Before drawing conclusions about the mass distributions, it is necesary to take size-of-sample effects into account ( Larsen [2002], Whitmore [2003]). Due to the small number of clusters in each age bin, the likelihood of sampling the cluster mass distributions to significantly higher masses than those observed is low. This makes it difficult to tell whether a physical upper mass limit exists. Furthermore, the ages of the clusters in the oldest bin are particularly uncertain because of the age-metallicity degeneracy in optical broad-band colors. This also translates into an uncertainty on the derived masses. Here we have used solar-metallicity SSP models, but the colors of the reddest clusters are also consistent with an old, metal-poor GC population. A more detailed discussion of these issues will be given in Mora et al. (in preparation). Considering this, we can say that younger clusters are in general less massive than older ones and there are no massive young clusters. There are more massive clusters at intermediate and old ages when compared to the youngest bin. No clusters more masive than M⊙ are observed.
5 Summary and conclusions
The color magnitude diagram shows two main cluster populations which are in concordance with an old ( 1 Gyr) globular cluster-like population and younger objects more similar to the open clusters in the Milky Way. Most of the latter have young ( 100 Myr) ages, possibly due to cluster disruption and fading.
The existence of intermediate-age clusters is deducted from the color-color diagram. This shows that NGC 45 is a galaxy with continuous star formation history.
The mass distribution as a function of age shows that more massive clusters are in general older than the less massive. This is also observed in M33 and also both galaxies shows similar masses ranges (between M⊙ up to 105M⊙) (Chandar et al. [1999]).
The role of size-of-sample effects needs to be further investigated.
Finally NGC 45 provides evidence that unperturbed low luminosity spiral galaxies can show continuous cluster formation.
¡widest bib entry¿
References
- [2003] Ander P & Fritze U - Alvensleben v.,2003, A&A 401, 1063
- [2003] Bik, A., Lamers, H. J. G. L. M., Bastian, N., Panagia, N.& Romaniello, M. 2003, A&A 397, 473
- [1985] Bottinelli, L., Gouguenheim, L., Paturel, G.& de Vaucouleurs, G.1985, ApJS 59, 293
- [1999] Chandar, R.,Bianchi, L. & Ford, H.C. 1999, ApJ 517, 668
- [1997] Ct, S., Freeman, K.C., Carignan, C., & Quinn, P. J. 1997, AJ 114, 1313
- [1992] Freedman K.c., Wendy L., Madore B.F., et al., 1992 ApJ 396,80
- [1999] Larsen S.S. 1999, A&A 354,836
- [2002] Larsen S.S. 2002, AJ 124,1393
- [2000] Pietrzynski, G. & Udalski, A. 2000, AcA 50, 337
- [2003] Whitmore, B.C. 2001 STScI Symp. 14 A Decade of Science, ed. M.Livio, K.Noll, &M. Stiavelli