Spectro-Polarimetric Observations and Non-LTE Modeling of Ellerman Bombs
Abstract
Ellerman bombs are bright emission features observed in the wings of H, usually in the vicinity of magnetic concentrations. Here we show that they can also be detected in the Ca II infrared triplet lines, which are easier to interpret and therefore allow for more detailed diagnostics. We present full Stokes observations of the 849.8 and 854.2 nm lines acquired with the new spectro-polarimeter SPINOR. The data shows no significant linear polarization at the level of 310-4. The circular polarization profiles exhibit measureable signals with a very intricate pattern of peaks. A non-LTE analysis of the spectral profiles emerging from these features reveal the presence of strong downflows (10 km/s) in a hot layer between the upper photosphere and the lower chromosphere.
keywords:
Sun: magnetic fields, Sun: photosphere, Sun: chromosphereguessConjecture
1 Introduction
One of the most intriguing discoveries made in Solar Physics early last century was the phenomenon known as Ellerman bombs. The common use of the H line to monitor the Sun allowed the discovery of features with enhanced emission peaks in the wings of this line, not affecting the central absorption core (Ellerman Ellerman (1917)). Off-band ( 1 Å) H filtergrams showed these features to be spatially point-like structures with a size of 1”, lasting for little more than 10 minutes (see Qiu et al. Qiu et al. (2000) and references therein). As they are virtually absent from line core filtergrams, they have always been associated to events taking place in the low chromosphere. This is also confirmed by their clear correlation with brightenings seen in the 1600 Å continuum images from the TRACE satellite (Qiu et al. Qiu et al. (2000)). Sometimes, an X-ray transient brightening can also be observed at the same location (Shimizu et al. Shimizu et al. (2002)). Recent reviews on Ellerman bombs are given by Rust (2001) and in the introduction of Georgoulis et al. (2002).
The physical process behind Ellerman bombs has remained elusive. The blue asymmetry observed by the H profiles (excess emission in the blue wing) has sometimes been associated to outward motions of the solar material (Koval and Severny Koval and Severny (1970)). But using two-component models separated along the line of sight, Dara et al. (1997) showed that the asymmetry could be originated from, either, hot emitting material moving upwards or cold absorbing material falling from the top of the chromosphere. The relation to the magnetic field configuration has been controversial as well. Ellerman bombs have been detected in two distinct solar magnetic scenarios, but always inside active regions. They occur in emerging regions between the opposite polarity footpoints and also surrounding isolated sunspots, beyond the penumbral boundary. For this later case, Nindos and Zirin (1998) have shown that they can be identified with the so-called Moving Magnetic Features (MMFs) that are seen in the moat region around sunspots (for a description of MMFs see Harvey and Harvey Harvey and Harvey (1973)). Whereas this points towards a magnetic origin of Ellerman bombs, a number of events observed by Nindos and Zirin (1998) (see also Dara et al. Dara et al. (1997)) were not clearly linked to magnetic structures. These authors point out that a number of cases showed a relationship with the boundaries of magnetic regions but others did not.
More recently the situation has been clarified by the analysis of the observations made by the Flare Genesis balloon experiment (Georgoulis et al. Georgoulis et al. (2002), Pariat et al. Pariat et al. (2004)). Observing an emerging flux region, these authors describe dipolar features that appear in the middle of the region, where the flux emerges at the surface (below the so-called arch filament system). With better sensitivity magnetograms than the previous works, Georgoulis et al. (2002) found that almost all Ellerman bombs studied could be identified with the neutral line above the dipolar features (or in neutral lines inside supergranular boundaries). Those cases not linked with the presence of neutral lines could be associated with interacting field lines above the photosphere, a result confirmed by the extrapolations made by Pariat et al. (2004). These authors proposed, then, as the most probably mechanism for the generation of Ellermam bombs some form of magnetic reconnection in the low chromosphere. That reconnection happens efficiently at these heights is supported by the fact that the temperature minimum is the region with the lowest electrical conductivity, and resistive processes occur there more easily than elsewhere (Litvinenko Litvinenko (1999)). While the Flare Genesis observations correspond to the central portion of an emerging active region, these conclusions offer an interesting parallelism with the Ellerman bombs observed surrounding sunspots and associated to MMFs. Pariat et al. (2004) pointed out that many of the bombs studied were spatially located at the dipped portions of undulatory field lines in the flux emerging area. This undulatory or serpentine configuration is also used for the explanation of MMFs (as first proposed by Harvey and Harvey Harvey and Harvey (1973)). In this way, a unifying scenario for the generation of these point-like energy release processes could be constructed. But a study similar to that made by Pariat et al. (2004) for the moat of sunspots is still lacking. The comparison between the Ellerman bombs seen in these two scenarios and the determination of their physical origin awaits for more solid observational tools than H line profiles.
In particular, techniques providing information of the magnetic field at the chromospheric heights where the energy release takes place, will be of great value. H linear polarization signals observed in Ellerman bombs have been reported in the past (Rust and Keil Rust and Keil (1992)), but their exact amount an origin remains controversial. In this paper, we propose the use of full Stokes spectropolarimetry in more reliable diagnostic lines such as the CaII infrared triplet lines. The most important advantage these lines offer is the availability of powerful inversion techniques that can be used to cover almost the full chromospheric region. This paper presents a first characterization of the atmosphere of two regions close to a sunspot that display the properties ascribed to the Ellerman bombs.
2 Observations
The observations used in this work are first-light data from the new instrument Spectro-Polarimeter for INfrared and Optical Regions (SPINOR, see Socas-Navarro et al. Socas-Navarro et al. (2005)), at the Dunn Solar Telescope (DST) located at the Sacramento Peak observatory. The dataset contains the two chromospheric CaII lines at 849.8 and 854.2 nm and two photospheric FeI lines at 849.7 and 853.8 nm. We observed active region NOAA 0634 on June 16 at 15:16 UT, carrying out a 350-step scan with a spatial stepping of 0.22”. By using the adaptive optics system of the DST Ren et al. (2003), we attained a spatial resolution as good as 0.6”, although this figure varies slightly along the scanning direction (the horizontal direction in the figures) due to temporal seeing variations.
In order to improve the signal-to-noise ratio in the Stokes profiles, we averaged the observations in 33 pixel boxes. The noise is thus reduced to 310-4 times the continuum intensity. At this level there is barely no signal in Stokes and , so we decided to leave them out of our analysis. The chromospheric Stokes profiles, however, reveal fascinatingly complex shapes with multiple peaks, while the photospheric lines exhibit the usual antisymmetric profiles.
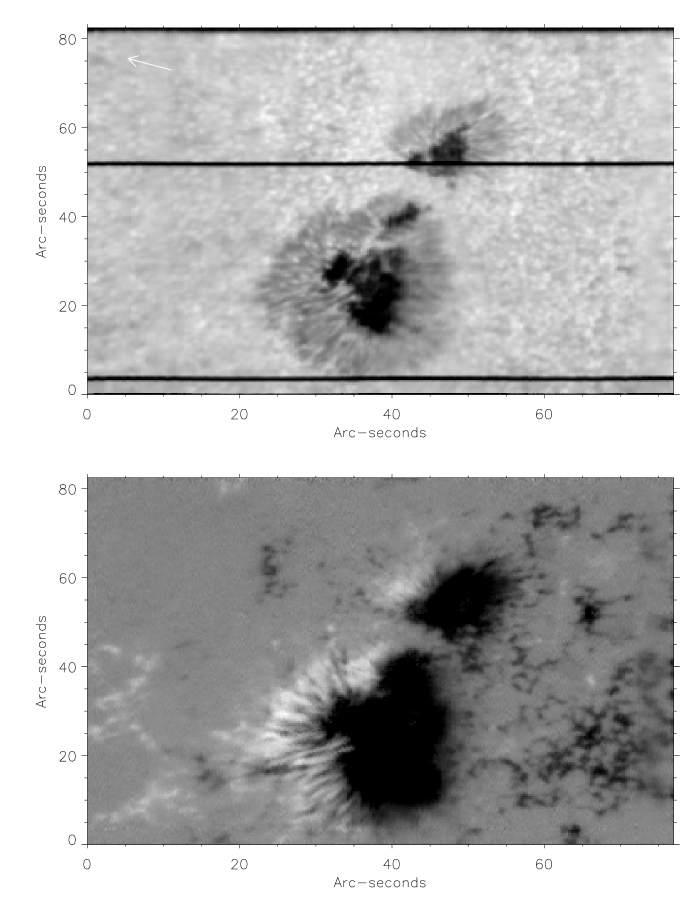
Fig 1 shows maps of the continuum intensity and a “magnetogram” taken in one of the photospheric lines. The magnetic configuration surrounding the sunspots appears very different on both sides of it. The eastern side exhibits a much more complex topology with an intricate pattern of plage fields extending from the sunspot boundary to the edge of the field of view. H images of the region (Fig 2) reveal considerable emission near the eastern penumbral boundary.
2.1 Velocities
Photospheric velocity maps of NOAA 0634 were obtained by measuring the minimum position of the Fe I line at 849.7 nm. A similar strategy is not viable for the Ca II lines, however, because of the complicated patterns of emission reversals and self-absortions found in the line cores. Instead, we measured the intensity difference between two points symmetrically located at various distances from the line core. This method is only an approximation but it works better than taking the minimum position.
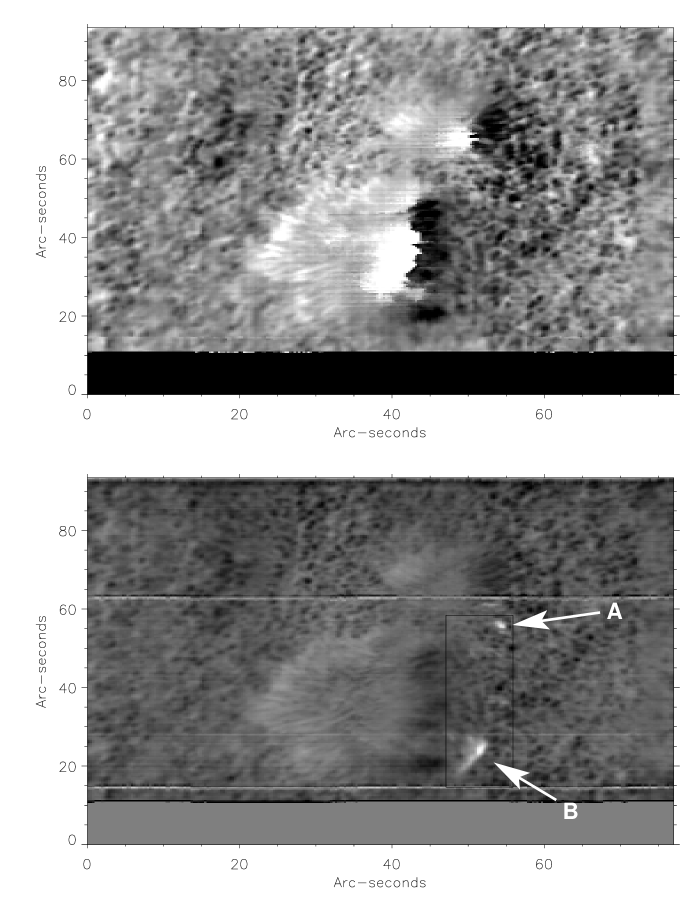
Fig 3 shows the velocity maps obtained at two heights, with the convention that positive velocities are away from the observer. The cosine of the heliocentric angle for this region is . Notice the two prominent bright features marked with arrows in the lower panel of the figure. These features are strong plasma flows directed away from the line of sight and located on the center side of the sunspot (but outside the photospheric penumbral boundary). Detailed profiles of these features are shown in Fig 4.
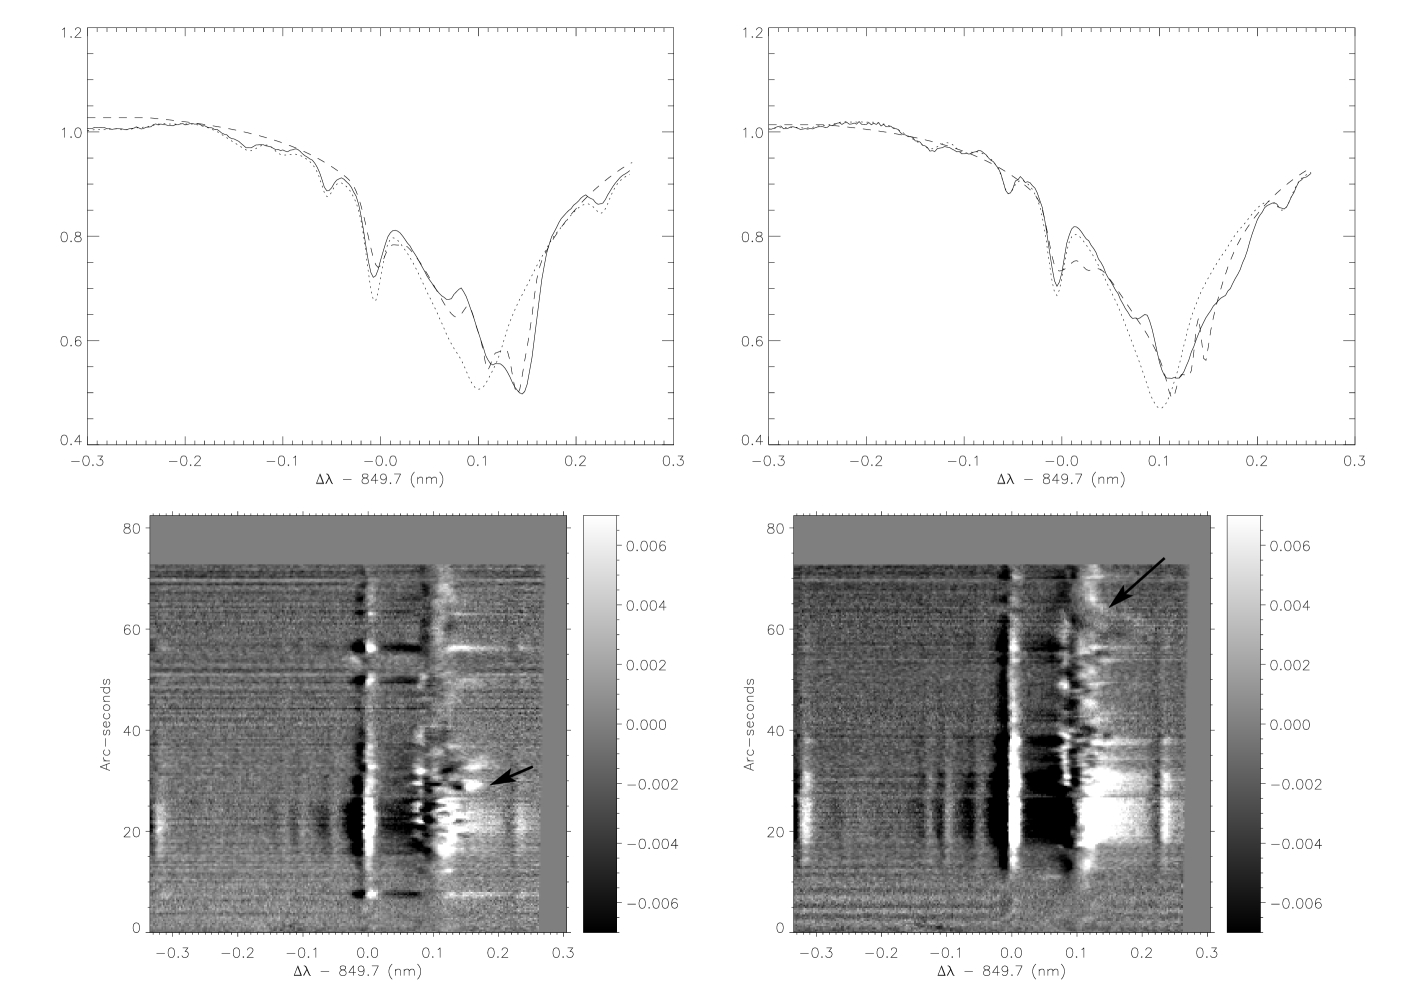
Both features exhibit very strong redshifts, visible in Stokes and . Point A shows a very prominent redshift starting near 40 pm away from line center (corresponding roughly to the high photosphere or low chromosphere) all the way to the line core (middle chromosphere). This feature is well localized (see lower panel) and the Doppler shift is 14 km s-1. Point B exhibits somewhat weaker flows (10 km s-1) that are more localized in height (upper photosphere/lower chromosphere), but has a more extended tail along the slit (see lower panel). Notice how both points A and B coincide with H emissions in Fig 2
3 Non-LTE inversions
We performed detailed non-LTE inversions of the area surrounding points A and B in Fig 3. The inversions were carried out with the code of Socas-Navarro et al. (2000b) (see also Socas-Navarro et al. Socas-Navarro et al. (1998)) by applying it systematically on each pixel independently. In order to minimize the risk of the algorithm settling on a secondary minimum, we repeated each inversion 10 times with randomized initializations. The model atmosphere that yields the best fit to the observed Stokes profiles is taken as a good representation of the solar atmosphere under study.
The inversion code treats the CaII lines in non-LTE and the FeI lines in LTE. Blends are treated consistently by adding the opacities of all the relevant transitions at each wavelength and spatial point, and then solving the radiative transfer equation with the total opacity. The non-LTE calculation is based on the preconditioning strategy of Rybicki and Hummer (1992) (see also Socas-Navarro and Trujillo Bueno Socas-Navarro and Trujillo Bueno (1997)) assuming complete angle and frequency redistribution. This last approximation is particularly good for the CaII infrared triplet lines, as shown by Uitenbroek (1989).
Let us consider in detail the models obtained for the points that we labeled as A and B. Figures 5 and 6 show the atmospheric stratification inside the downflows, as well as an average over the surrounding, non-downflowing area for reference. The most striking features in these models are the strong downwards velocities found in the upper photosphere, around . The motions along the line-of-sight approach the speed of sound in point B and exceed it in point A. The other parameters show different behaviors in points A and B. In particular, the downflowing layer in point B is considerably hotter than the reference atmosphere. However, in point A the downflowing layer is cooler (although it then becomes hotter at higher layers). In both cases there is another hot layer at . Our findings for the two regions are consistent with the results of Georgoulis et al. (2002) who found Ellermam bombs to be predominantly dominted by downflows with no indication of upflows.
The fits provided by the inversions can be seen in Fig 7. Note that the observed chromospheric profiles exhibit a very complex structure with multiple peaks in Stokes (the photospheric lines, on the other hand, produce rather normal profiles). Generally speaking, the inversion code yields a reasonably good fit to the overall features, but there is more structure in the observed profiles (particularly noticeable in Stokes with multiple peaks), than in the synthetic ones. This is an indication that the actual atmospheres are even more complex than our models, probably due to the presence of unresolved atmospheric components.


Thus far, we have not made a direct connection between the downflowing features analyzed here and EBs. To this aim, we used the model atmospheres obtained from the inversion to synthesize the H profiles that these models produce. The result is plotted in Fig 8, along with a reference quiet Sun profile calculated from model C of Vernazza et al. (1981) (VAL-C). This synthetic profile has the same appearance traditionally observed in EBs. Ellerman (1917) describes the H spectra of his bombs as having emission features (brighter than the continuum) on both sides of the line center. The red asymmetry (higher intensity peak in the red wing) shown here is not the one most commonly observed in Ellerman bombs (see the introduction), but this asymmetry is also present quite often (40% of the cases according to Rust Rust (2001)). It is the result of a hot downflowing component as seen in Fig 5. The resemblance of EBs with the synthetic profile in Fig 8 is a solid evidence that we are indeed observing the same phenomenon. Moreover, it also provides strong support for the reliability of the inversions.


4 Conclusions
The energetic phenomenon generally referred to as EBs has remained very ellusive to solar physicists for almost a century. This is probably due in no small measure to the fact that it has only been observed in H thus far, which is a very difficult line to interpret. In this paper we present the first observations of EBs in other lines, namely the CaII infrared triplet. These lines are much easier to model and have been successfully inverted in the past few years (e.g., Socas-Navarro et al. Socas-Navarro et al. (2000a); Socas-Navarro et al. Socas-Navarro et al. (2001); Socas-Navarro Socas-Navarro (2005b)) and thus our results open a new window to the observational study of EBs.
We find that the EBs analyzed in this work are associated with supersonic (or nearly so) downflows in the upper photosphere. No upflows are observed in our data. Socas-Navarro (2005a) determined the vector current densities in the large sunspot of Fig 1 and found that the east penumbra is permeated by strong currents in the upper photosphere, with a magnitude of 3105 A km-2. The fact that these EBs occur in a region with strong currents suggests that EBs may be associated with magnetic reconnection.
In order to understand the nature of EBs and the physical processes that produce them, it would be extremely valuable to have time-series observations of photospheric and chromospheric lines, ideally with full Stokes polarimetry.
5 Acknowledgments
The authors wish to acknowledge the enthusiastic support from the NSO staff at the Sacramento Peak observatory, especially D. Gilliam, M. Bradford and J. Elrod. Thanks are also due to S. Hegwer, S. Gregory, R. Dunbar, T. Spence, S. Fletcher, C. Berst and W. Jones.
References
- Dara et al. (1997) Dara, H.C., and Alissandrakis, C.E., Zachariadis, Th.G., and Georgakilas, A.A.: 1997, A&A 322, 653
- Ellerman (1917) Ellerman, F.: 1917, ‘Solar Hydrogen ”bombs”’. ApJ 46, 298
- Qiu et al. (2000) Qiu, J., Ming, D.D., Wang, H. Denker, C. and Goode, P.R.: 2000, ApJ 544, L157
- Georgoulis et al. (2002) Georgoulis, M.K., Rust, D.M., Bernasconi, P. and Schmieder, B.: 2002, ApJ 575, 506
- Harvey and Harvey (1973) Harvey, J., and Harvey, K.: 1973, Sol. Phys. 28, 61
- Koval and Severny (1970) Koval, A.N., and Severny, A.B.: 1970, Sol. Phys. 11, 276
- Litvinenko (1999) Litvinenko, A.: 1999, ApJ 515, 435
- Nindos and Zirin (1998) Nindos, A., and Zirin, H.: 1998, Sol. Phys. 182, 381
- Pariat et al. (2004) Pariat, E., Aulanier, G., Schmieder, B., Georgoulis, M.K., Rust, D.M., and Bernasconi, P.: 2004, ApJ 614, 1099
- Ren et al. (2003) Ren, D., S. L. Hegwer, T. Rimmele, L. V. Didkovsky, and P. R. Goode: 2003, ‘Optical design of high-order adaptive optics for the NSO Dunn Solar Telescope and the Big Bear Solar Observatory’. In: Innovative Telescopes and Instrumentation for Solar Astrophysics. Edited by Stephen L. Keil, Sergey V. Avakyan . Proceedings of the SPIE, Volume 4853, pp. 593-599 (2003). pp. 593–599.
- Rust and Keil (1992) Rust, D.M., and Keil, S.L.: 1992, Sol. Phys. 140, 55
- Rust (2001) Rust, D.: 2001, Encyclopedia of Astronomy and Astrophysics, E2263R
- Rybicki and Hummer (1992) Rybicki, G. B. and D. G. Hummer: 1992, ‘”An accelerated lambda iteration method for multilevel radiative transfer. II - Overlapping transitions with full continuum”’. A&A 262, 209–215.
- Shimizu et al. (2002) Shimizu, T., Shine, R.A., Title, A., Tarbell, T., and Frank, Z.: 2002, ApJ 574, 1074
- Socas-Navarro (2005a) Socas-Navarro, H.: 2005a, ‘Are Electric Currents Heating the Solar Chromosphere?’. Science submitted.
- Socas-Navarro (2005b) Socas-Navarro, H.: 2005b, ‘The Three-Dimensional Structure of a Sunspot Magnetic Field’. ApJ submitted.
- Socas-Navarro et al. (2005) Socas-Navarro, H., D. Elmore, A. Pietarila, T. Darnell, S. Tomczyk, and B. Lites: 2005, ‘SPINOR: A new visible and infrared spectro-polarimeter for the National Solar Observatory.’. Solar Physics in preparation.
- Socas-Navarro et al. (1998) Socas-Navarro, H., B. Ruiz Cobo, and J. Trujillo Bueno: 1998, ‘”Non-LTE Inversion of Line Profiles”’. ApJ 507, 470–481.
- Socas-Navarro and Trujillo Bueno (1997) Socas-Navarro, H. and J. Trujillo Bueno: 1997, ‘”Linearization versus Preconditioning: Which Approach Is Best for Solving Multilevel Transfer Problems?”’. ApJ 490, 383.
- Socas-Navarro et al. (2000a) Socas-Navarro, H., J. Trujillo Bueno, and B. Ruiz Cobo: 2000a, ‘Anomalous Polarization Profiles in Sunspots: Possible Origin of Umbral Flashes’. Science 288, 1396–1398.
- Socas-Navarro et al. (2000b) Socas-Navarro, H., J. Trujillo Bueno, and B. Ruiz Cobo: 2000b, ‘”Non-LTE Inversion of Stokes Profiles Induced by the Zeeman Effect”’. ApJ 530, 977–993.
- Socas-Navarro et al. (2001) Socas-Navarro, H., J. Trujillo Bueno, and B. Ruiz Cobo: 2001, ‘A Time-dependent Semiempirical Model of the Chromospheric Umbral Oscillation’. ApJ 550, 1102–1112.
- Uitenbroek (1989) Uitenbroek, H.: 1989, ‘Operator perturbation method for multi-level line transfer with partial redistribution’. A&A 213, 360–370.
- Vernazza et al. (1981) Vernazza, J. E., E. H. Avrett, and R. Loeser: 1981, ‘”Structure of the solar chromosphere. III - Models of the EUV brightness components of the quiet-sun”’. ApJS 45, 635–725.