Warm-Hot Gas in and around the Milky Way:
Detection and
Implications of O VII Absorption toward LMC X-3
Abstract
X-ray absorption lines of highly-ionized species such as O VII at about zero redshift have been firmly detected in the spectra of several active galactic nuclei. However, the location of the absorbing gas remains a subject of debate. To separate the Galactic and extragalactic contributions to the absorption, we have obtained Chandra LETG-HRC and Far Ultraviolet Spectroscopic Explorer observations of the black hole X-ray binary LMC X–3. We clearly detect the O VII K absorption line with an equivalent width of 20(14, 26) mÅ (90% confidence range). The Ne IX K absorption line is also detected, albeit marginally. A joint analysis of these lines, together with the non-detection of the O VII K and O VIII K lines, gives the temperature, velocity dispersion, and hot oxygen column density as K, , and 1.9(1.2, 3.2), assuming a collisional ionization equilibrium of the X-ray-absorbing gas and a Galactic interstellar Ne/O number ratio of 0.18. The X-ray data allow us to place a 95% confidence lower limit to the Ne/O ratio as 0.14, but the upper limit is not meaningfully constrained. The O VII line centroid and its relative shift from the Galactic O I K absorption line, detected in the same observations, are inconsistent with the systemic velocity of LMC X–3 (). The far-UV spectrum shows O VI absorption at Galactic velocities, but no O VI absorption is detected at the LMC velocity at significance. The measured Galactic O VI column density is higher than the value predicted from the O VII-bearing gas, indicating multi-phase absorption. Both the nonthermal broadening and the decreasing scale height with the increasing ionization state further suggest an origin of the highly-ionized gas in a supernova-driven galactic fountain. In addition, we estimate the warm and hot electron column densities from our detected O II K line in the LMC X–3 X-ray spectra and from the dispersion measure of a pulsar in the LMC vicinity. We then infer the O/H ratio of the gas to be , consistent with the chemically-enriched galactic fountain scenario. We conclude that the Galactic hot interstellar medium should in general substantially contribute to zero-redshift X-ray absorption lines in extragalactic sources.
Subject headings:
galaxies: intergalactic medium — ISM: kinematics and dynamics — stars: individual (LMC X–3) — ultraviolet: ISM — X-Rays: ISM1. Introduction
Recently, several groups have reported the detection of H- and He-like oxygen absorption lines from the local () hot gas in the X-ray spectra of active galactic nuclei (AGNs) with Chandra and XMM-Newton X-ray Observatories (Fang et al., 2002; Fang, Sembach, & Canizares, 2003; Nicastro et al., 2002; Rasmussen, Kahn, & Paerels, 2003; McKernan et al., 2004; Williams et al., 2005). The detected column densities of highly-ionized oxygen are around , which has been suggested to be an indication for the presence of large amounts of intergalactic “warm-hot” gas at temperatures around K. This suggestion, if confirmed, would have strong implications for our understanding of the so-called missing baryon problem (Fukugita, Hogan, & Peebles, 1998; Cen & Ostriker, 1999; Davé et al., 2001; Fang et al., 2002; Nicastro et al., 2005). In turn, by comparing nearby X-ray absorbers to highly UV ionized absorption systems observed at various redshifts from 0.2 out to 4 (Tripp, Savage, & Jenkins, 2000; Reimers et al., 2001; Simcoe, Sargent, & Rauch, 2002; Kirkman & Tytler, 1997), these data could shed light on the thermal and chemical evolution of the Universe. However, one critical question remains open: where are these highly-ionized X-ray absorbers — in the interstellar medium (ISM) of the Galactic disk, in an extended Galactic halo, in the Local Group, or even beyond?
We here report Chandra grating observations of LMC X–3 in its high state to discriminate between the Galactic and extragalactic scenarios of the O VII absorption. Because this bright X-ray source is in our neighboring galaxy, the Large Magellanic Cloud (LMC) at the distance of kpc, the detection of the absorption offers a direct measurement of the hot gas content along a line of sight through essentially the entire Galaxy, including its halo. The consistency between this measurement and those in the AGN sight-lines provides a direct constraint on the residual absorption on scales greater than the LMC distance. We supplement the Chandra data with a nearly simultaneous far-UV observation obtained with the Far Ultraviolet Spectroscopic Explorer (FUSE).
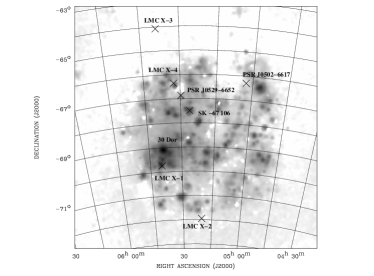
LMC X–3 is perhaps the best-suited source for this experiment. Among the several bright X-ray binaries in both the Small and Large Magellanic Clouds, LMC X–3 normally exhibits a very soft X-ray spectrum, which is dominated by the accretion disk emission, and an exceptionally high luminosity during its high state. Unlike most black hole systems, LMC X–3 spends most of its time in the high state. LMC X–3 is outside the main body of the LMC and is about 5∘ away from the active star forming 30 Doradus region, where LMC X–1 and two neutron star X-ray binaries X–2 and X–4 are located (Fig. 1). Therefore, the potential absorption contribution from hot gas local to the LMC is minimal. Finally, LMC X–3 has a systemic velocity of , comparable to the expected velocity () for the projected location in the LMC (Cowley et al. 1983). This velocity makes it relatively straight forward to distinguish a spectral line that is local to the X-ray binary or to the LMC from that associated with the Galactic disk.
We have analyzed and interpreted the Chandra and FUSE data almost independently, but the results and conclusions found are in nearly complete agreement. Therefore, we try to keep this independence in the presentation of this paper. We adopt the Galactic ISM metal abundances given by Wilms, Allen, & McCray (2000) (e.g., the oxygen and neon number fractions are and , compared to the typically assumed solar values and ; Grevesse & Sauval (1998)); both the constraint on the abundances and the effect of the relative elemental fraction change on our results are discussed in §4. Furthermore, our spectroscopic analysis assumes that the X-ray-absorbing gas is in a collisional ionization equilibrium (CIE). The parameter uncertainties in this paper are quoted at the 68% and 90% confidence levels for the far-UV and X-ray measurements, respectively, unless otherwise noted.
2. Observations and Data Reduction
2.1. Chandra Observations
Our experiment used the Chandra low energy transmission grating plus the high resolution camera (LETG-HRC) combination, chiefly for its high sensitivity to detect the O VII K line. The spectral resolution of the LETG-HRC is 0.05 Å (FWHM). LMC X–3 is a variable black hole X-ray binary and its soft X-ray flux varies quasi-periodically on a period of 99 or 199 days (Cowley et al., 1991, 1983). We thus proposed the experiment as a target-of-opportunity (TOO) program during the Chandra cycle 5. Because of the newly imposed solar pitch angle constraints on Chandra pointing duration, our proposed 100 ks exposure was split into three separate observations of 20, 40, and 40 ksec, taken on April 20, May 4, and May 8, 2004 (Fig. 2). Unfortunately, the X-ray intensity of LMC X–3 decreased unusually rapidly from the peak when the TOO was triggered; by the time of the latter two (longer) observations, the count rates had dropped by a factor of . Nevertheless, we still collected more than good events in the energy range 10-40 Å along the two high resolution grating arms.

We processed the LMC X-3 data, using the standard CIAO threads (version 3.2.1)111see http://cxc.harvard.edu/ciao. with the calibration database CALDB (version 3.0.0)222see http://cxc.harvard.edu/caldb/.. As described in the Observatory Guide (version 7.0)333see http://cxc.harvard.edu/proposer/POG/html/MPOG.html, “the LETG diffracts X-rays into a dispersed spectrum according to the grating diffraction relation, where is the integer order number, the photon wavelength, the spatial period of the grating lines, and the dispersion angle.” Therefore, events recorded at each of an observation consist of photons at multiple wavelengths in different orders. Generally, this spectral order overlapping is most serious at long wavelengths, because both the intrinsic source photon flux and the effective collecting area of the telescope/instrument decrease with photon energy. The overlapping orders cannot be sorted out locally in an observed spectrum, because the HRC itself lacks sufficient energy resolution.
We used a forward modeling approach to globally account for the spectral order overlapping (§3.1). To facilitate such modeling, we constructed a grating response matrix file (RMF) and an auxiliary response (or effective area) function (ARF) for each order (from the 1st to the 6th) of each grating arm, by running the threads mkgrmf and mkgarf. We then added the six ARF and RMF pairs together to form an order-combined response file (RSP)444see http://asc.harvard.edu/cal/Letg/Hrc_QE/ea_index.html#rsps. for each grating arm. This RSP file accounts for not only the local line response, but also the global spectral overlapping of the orders. For ease of processing and visualization, we further co-added the spectra: first the negative and positive arms, and then the individual observations. The corresponding RSP files were averaged channel by channel and weighted by the best-fit global models of individual spectra (see §3.1). As consistency check, our analysis was often repeated with the individual spectra before the co-adding.
2.2. FUSE Observations
To complement the Chandra observations, we also obtained high-resolution ultraviolet spectroscopy of LMC X-3 via a TOO observation with FUSE.555For information on the design and performance of FUSE, see (Moos et al., 2000, 2002). The FUSE data cover the O VI resonance-line doublet at 1031.93 and 1037.62 Å, which is valuable for understanding the ionization and single phase vs. multi-phase nature of highly-ionized absorbers (Tripp & Savage 2000; Tripp et al. 2001; Mathur et al. 2003; Sembach et al. 2004, Savage et al. 2005a,b; Collins, Shull, & Giroux 2005). Moreover, the spectral resolution of FUSE (FWHM 20 km s-1) is at least an order of magnitude higher than that of any current X-ray spectrograph. Consequently, the FUSE observation provides robust information about the kinematics and line broadening as well as the likely location of the gas (the Milky Way vs. the LMC) based on line velocities. In CIE, the population of O VI ions peaks sharply at K, whereas O VII and Ne IX trace gas over a broad temperature range ( K; Yao & Wang (2005)). However, in terms of column density detection, the FUSE observation is more sensitive to O VI than the Chandra observation is to O VII and can actually be used to trace gas with a temperature as high as K.
The FUSE and Chandra observations were coordinated to occur as simultaneously as possible. The requirement of simultaneous X-ray and UV observations was primarily for investigation of the accretion-disk physics and intrinsic properties of LMC X-3, which will be presented in a separate paper. The FUSE data were obtained in a single visit on 20 April 2004 for a total on-source integration time of 88.9 ks. The program employed the LWRS (30”30”) aperture and time-tag mode, but only data from the LiF1 channel were useful (other channels were not adequately co-aligned). The data were reduced with CALFUSE (v3.0.7) following standard procedures.666See http://fuse.pha.jhu.edu/analysis/analysis.html. For FUSE, LMC X-3 is a relatively faint target, and it is difficult to determine shifts between sub-exposures for alignment and co-addition. However, since all sub-exposures were obtained during a single visit, such shifts should be small or negligible in the LiF1 channel. The final, co-added spectrum was binned to km s-1 pixels (roughly 3 pixels per resolution element).
Before execution of our program, LMC X-3 had been observed with FUSE in 2002 (see Hutchings et al. 2003). While the total integration time ( ks) obtained by Hutchings et al. was significantly shorter than the exposure time of the new observation, it turns out that LMC X-3 was also substantially brighter (in the UV region near the O VI doublet) when Hutchings et al. observed it. Consequently, the signal-to-noise ratios of the old and new observations are comparable. In principle, if some absorption is circumstellar, then the absorption lines could vary between observations. However, we have acquired and re-reduced the older LMC X-3 FUSE data obtained by Hutchings et al., and we find that the absorption lines in the old and new data appear to be identical within the noise. Therefore, we have elected to coadd all of the data (LiF1a and LiF2b from Hutchings et al. and LiF1a from the new program). Because the flux varied significantly between the 2002 and 2004 observations, we fitted the continua of the three spectra independently and then coadded the continuum-normalized data, weighted inversely by their variances. The continua were fitted with low-order polynomials in the regions within km s-1 of the O VI line.
Hutchings et al. (2003) found that the velocity of the O VI emission centroid varies by 100-150 km s-1 as a function of the X-ray binary phase, and they derived an orbital semiamplitude of 130-200 km s-1 for the putative black hole in LMC X-3. Our new observations show a narrow O VI emission feature at LMC velocities that shifts position as the binary phase changes, and the shifts are in the same direction as reported by Hutchings et al. However, the shifting O VI emission feature in the new data is narrower than the emission presented by Hutchings et al. We will present a full analysis of the O VI emission in a separate paper. However, it is relevant here because the narrow O VI emission can lead to a complicated continuum shape against which absorption is measured. Misplacement of the continuum due to the emission could cause absorption features to be incorrectly measured. To avoid this problem, before coadding the data, we collected the data into five phase ranges. In each phase range, we examined the spectrum to identify the wavelength range affected by the narrow O VI emission, and we masked and excluded that wavelength range from the final, coadded spectrum. Because the O VI emission is narrow and shifts substantially in velocity, this masking procedure still allowed accumulation of adequate signal at all wavelengths, i.e., no regions of the spectrum were masked out entirely.
3. Analysis and Results
3.1. Chandra Data

| Wavelength | EW | ||
|---|---|---|---|
| Line | (Å) | (km s-1) | (mÅ) |
| O VI | 1031.926 | ||
| O VII K | 21.6020 | 56(-83, 194) | 20(14, 26) |
| O VII K | 18.6270 | (fixed) | |
| O VIII K | 18.9670 | (fixed) | |
| Ne IX K | 13.4470 | 112(-214, 347) | 6.3(3.7, 9.0) |
| O I K | 23.5140 | 128(13, 242) | 30(23, 38) |
| O II K | 23.3492 | 283(11, 349) | 19(12, 26) |
Our Chandra spectral analysis uses the software XSPEC (version 11.3.1). To properly account for the spectral order overlapping (§2.1), we model the entire observed spectrum in the 2-41 Å range. We first try an absorbed disk blackbody plus power-law model, but obtain a poor spectral fit (, corresponding to a statistical null hypothesis confidence of ). This poor fit is largely due to various local deviations from the model. These deviations are likely due to the current imperfect calibration of the instrument response (i.e., the adopted RSP), which does not accurately account for such effects as the dithered HRC-S plate gaps (Nicastro et al., 2005), and to the uncertainties in various emission and absorption models (e.g., neutral absorption edges; Juett, Schulz, & Chakrabarty 2004). Following Nicastro et al. (2005), we include eight broad Gaussian components (three positive and five negative) to account for such local spectral deviations. The inclusion of these broad components improves the continuum fit substantially () and typically has insignificant effects on narrow lines that we want to measure. We find that the O I, O II777This line has also been identified to be an O I complex by other authors (e.g., Paerels et al. 2001)., Ne IX and O VII K absorption lines are clearly visible at their expected rest-frame wavelengths (Fig. 4; the relevant atomic parameters and references are summarized in Table 3 of Yao & Wang (2005)). These lines are characterized with four negative Gaussian profiles (each reducing the degrees of freedom by three), which further improve the spectral fit (reducing consecutively by 80, 24, 16, and 35). The final best fit is reasonably acceptable () and is shown in Fig. 3. The order overlapping is considerable in the wavelength range longward of 10 Å. The contribution from orders higher than the 1st is 7, 30, 50, and 75% at wavelength 13, 21, 33, and 40 Å respectively. Accounting for the contamination from orders higher than the 1st one, we estimate the equivalent widths (EWs) and centroid velocities (relative to the rest frame) of the lines as presented in Table 1. We also obtain the one-sided 95% confidence upper bounds to the EWs of O VII K and O VIII K absorption lines (listed in Table 1), by fixing their centroids to the rest-frame energies and jointly-fitting their line widths with the O VII K line. The inclusion of these two line components in the fit does not significantly reduce the (). We further check the centroid and EW of the O VII K line in the three observations separately, and we find no evidence for any significant variation.


To estimate the physical parameters of the X-ray-absorbing gas, we jointly fit the O VII K, O VII K, O VIII K, and Ne IX K lines, using the multiplicative absorption line model, absline, as detailed in Yao & Wang (2005). Briefly, the model adopts an accurate absorption line profile (Voigt function) and accounts for the line saturation automatically. This absline fit with three free parameters less than in the above Gaussian line fit, has a similar quality (). The best-fit model is shown in Fig. 5. The fitted parameters are the absorbing gas temperature log[, the velocity dispersion , and the equivalent hydrogen column density log[ with a corresponding log[. Fig. 6 shows – confidence contours. The fitted line centroid velocities are nearly identical to those in Table 1. We can further infer the nonthermal broadening from the definition of , assuming the nonthermal motions are adequately described by a Gaussian profile. Here is the ion mass; so for oxygen, the thermal velocity dispersion is km s-1. Therefore, we infer the nonthermal broadening as . The absline model fitting also allows us to predict log[.


Because our joint fit of the absorption lines utilizes all the information available in the spectrum, the source of a particular parameter constraint cannot be isolated easily. But foundamentally, from our measurements we have both lower and upper bounds on the O VII and Ne IX K absorption lines and only upper bounds on the O VII K and O VIII K lines, i.e., a total six measurements. Thus we can, in principle, solve six limits on the parameters: , , , and , or their combinations. With the assumption of the Galactic ISM Ne/O ratio, we can then constrain all the parameters. In fact, we can do a bit better, considering that and are not totally independent and that the demand for the very existence of the solution places additional constraint on the parameters, as is demonstrated in the following.
We can better illustrate how the specific parameter constraints may be realized by using an alternative (but not independent) approach, the curve-of-growth (CoG) analysis, which is relatively simple and is particularly good for visualization (e.g., Williams et al. 2005). Fig. 7 illustrates how and can be constrained this way. For an absorption line, its EW, as measured with a negative Gaussian model, is a function of and , which is linked to the ionic column density if both element abundance and plasma temperature are assumed. Therefore, from a measured EW and its uncertainties, a region can be constrained in the – plot. With multiple absorption lines from the different transitions of the same ion (e.g., O VII K, K, etc.), one may constrain both and from the overlapping of the regions. Fig. 7 illustrates that the tight constraints on both and in our case are derived chiefly from the upper and lower bounds to the O VII K, the lower bound to Ne IX K, and the upper bound to the O VII K EW measurements. Apparently, these four EW bounds do not necessarily lead to a non-zero overlapping region, depending on the assumed and Ne/O ratio. Therefore, the four EW bounds give constraints not only on both and , but also on the combination of the temperature and abundance, though indirectly. Of course, the upper bounds to O VII K and Ne IX K provide additional constraints, especially on the upper limit to . This apparent over-constraining power of the EW measurements arises from the demand for the existence of a solution (an overlapping region in a multi-dimensional parameter space).
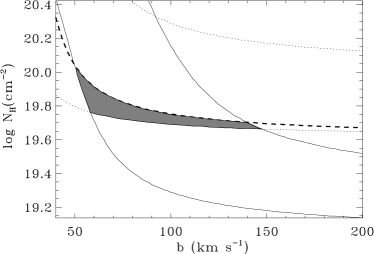
The CoG approach, however, has its drawbacks. First, it does not use all the information in the spectrum, at least not in a coherent fashion; absorption lines are measured independently (thus the improved counting statistics from a combination of multiple weak lines is not capitalized). Second, the joint-analysis of two or more lines in a CoG diagnostic plot, though informative, does not allow for a rigorous error propagation of the parameter constraints; for example, it is difficult to quantify the overlapping significance and/or to include the uncertainties in the assumed temperature (Fig. 7). Third, the EW measurement from the negative Gaussian model can be problematic, especially when the absorption line is saturated (e.g., an optical depth at the line center of the O VII K line in the spectrum of LMC X–3); the EW value can be significantly over-estimated (see Fig. 4 in Yao & Wang 2005). In fact, a plot like Fig. 7 represents only a cut in a multiple dimensional parameter space constrained by the absorption line measurements (e.g., via an absline model fit). Therefore, we use the CoG approach only for the visualization and consistency check of the absorption line measurements.
3.2. FUSE Data
We analyzed the FUSE observation entirely independently from the Chandra results, i.e., no constraints from the X-ray data were imposed on the FUSE measurements. The low UV flux level makes LMC X-3 a challenging target for FUSE, and most of the useful information in the FUSE spectrum is in the 1030-1040 Å range where the flux is elevated by a broad emission feature (Hutchings et al., 2003). The middle and lower panels in Fig. 8 show the interstellar C II 1036.34 and O VI 1031.93 lines recorded in the coadded FUSE LMC X-3 spectrum. For purposes of comparison, we also show in the upper panel in Fig. 8 the interstellar O I 1302.18 absorption observed with the Space Telescope Imaging Spectrograph (STIS) toward SK-67 106, a hot star located in the main body of the LMC (see Fig. 1).888The STIS observations of SK-67 106 were obtained with the E140M echelle mode (spectral resolution = 7 km s-1 FWHM) and reduced as described in Tripp et al. (2001). While it might ostensibly seem more sensible to present the C II absorption observed toward SK-67 106 since C II is detected toward LMC X-3, we prefer the O I line for two reasons: first, toward SK-67 106, C II is badly saturated and all of the component structure evident in Fig. 8 is hidden in the black, saturated cores of the C II lines; second, and more importantly, C II at LMC velocities is badly confused by blending with C II* at Milky Way velocities (see text).
The SK-67 106 panel in Fig. 8 shows that in the general direction of the LMC, strong and complex Milky Way absorption is detected at km s-1, and strong (saturated) absorption due to the ISM of the LMC is present at km s-1. Toward stars located in the main body of the LMC, strong O VI absorption is frequently detected within these velocity ranges as well (e.g., Howk et al. 2002; Danforth et al. 2002). Toward LMC X-3, C II and O VI absorption lines are clearly detected in the Milky Way velocity range. While a strong absorption feature is evident in the LMC X-3 spectrum at the velocity expected for C II in the LMC ISM, much of that absorption is likely due to a blend of C II* 1037.02 and O VI 1037.62 from the Milky Way, and it is difficult to reliably assess the amount of LMC C II (or even if it is present at all) in the direction of LMC X-3.
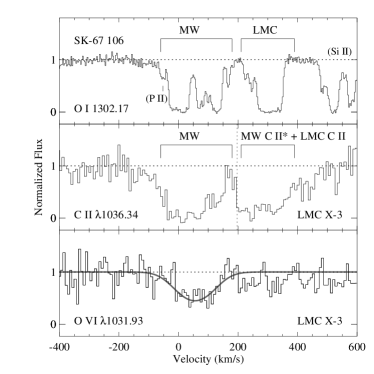
We have measured the equivalent width and column density of the O VI 1031.93 absorption by direct integration using the techniques of Sembach & Savage (1992), including assessment of the continuum placement uncertainty as well as statistical uncertainty in the overall error bars. From inspection of Fig. 8, we see that O VI absorption is clearly detected at Milky Way velocities ( km s-1). The O VI EW integrated over the Milky Way velocity range is listed in Table 1; the EW indicates that the Galactic O VI absorption is detected at 6.3 significance. The O VI absorption at LMC velocities is much weaker, and integrating over the LMC velocity range (), we obtain EW(LMC) = 96.246.4 mÅ, i.e., only a 2.1 feature. Moreover, if we compare the three individual spectra (LiF1a and LiF2b from Hutchings et al. and LiF1a from the new observation) that were coadded in Fig. 8, we find that Milky Way O VI is detected at in all three individual observations, and the EWs measured from the individual spectra agree within their 1 uncertainties. However, O VI absorption at LMC velocities is not significantly detected in any of the individual spectra. We conclude that the current data do not show compelling evidence of O VI absorption at LMC velocities. While observations of stars in the main body of the LMC almost always show O VI absorption associated with the LMC (Howk et al. 2002), LMC X-3 is outside of the main body of the LMC (see Fig. 1), and therefore it is not necessarily surprising that the O VI is weaker in this direction. If we were to include the 2 absorption in the LMC velocity range, this would increase the total column density by 40% .
Over the Milky Way velocity range, we find log[ (1 uncertainties) from direct integration. Assuming a single Gaussian component for O VI, we have also used the Voigt profile fitting software of Fitzpatrick & Spitzer (1997) to measure the O VI centroid, line width, and column density, and we obtain the fit shown in Fig. 8 with (O VI) , (O VI) , and log[. The O VI columns obtained from direct integration and profile fitting are in good agreement. The O VI column predicted from the best-fit absline model of the X-ray absorption lines (§3.1) is a factor of lower; but because of the large statistical uncertainties in the X-ray data, the discrepancy is only at the confidence level. Interestingly, the O VI and values are consistent with those of O VII (see Table 1 and §3.1).
4. Discussion
4.1. Origin of the far-UV and X-ray absorbers
The centroid positions of the observed absorption lines (Table 1) may be used to determine their origin, Galactic or the LMC. Our measured centroid position of the O VII K line (Table 1) is consistent with the rest-frame energy and is significantly inconsistent with an LMC origin. The O VI line centroid differs by from LMC velocities. Therefore, we can conclude with great confidence that the bulk of the O VI absorption detected toward LMC X-3 does not originate in the LMC. However, it remains possible that the O VI and O VII absorption occurs in separate, unrelated gas clouds, so it is important to scrutinize the disagreement between the O VII centroid and the LMC velocity. The question is whether or not any systematics may account for this disagreement. We address this question, both empirically and physically.
| O VII | O I | ||
|---|---|---|---|
| Sources (OB ID) | (Å) | (Å) | (Å) |
| X1820–303 (98) | 1.894 | ||
| MRK 421 (4149) | 21.603 | ||
| PKS 2155–304 (331) | 23.514 | ||
| Mean of the above | 21.608 | 23.514 | 1.906 |
| LMC X–3 |
Note. — The 90% confidence error bars are in units of mÅ.
Although individual lines are not resolved in the Chandra observations, we may determine the line centroids to an accuracy (depending on the counting statistics) comparable to the absolute photon energy scale uncertainty of the instrument. We adopt that the uncertainty to be mÅ (0.19 eV) for the LETG-HRC999see the Chandra calibration website for CIAO 3.2 with CALDB 3.0.1; http://asc.harvard.edu/cal/, although higher values (as high as mÅ) are also cited in documents101010see http://cxc.harvard.edu/proposer/POG/html/MPOG.html, probably resulting from evolving calibration accuracy at various stages. Table 2 compares the line centroid measurements of LMC X–3 with three other sources that have good LETG-HRC detections of both O I and O VII absorption lines. While X1820–303 is a Galactic LMXB (Futamoto et al., 2004; Yao & Wang, 2005), the other two sources are AGNs (Williams et al. 2005; Yao et al. 2005, in preparation). The O VII line centroid measurements are all consistent within (Table 2). A maximum likelihood analysis indicates no significant intrinsic (non-statistical) dispersion in these measurements, but the allowed 1 upper limit is consistent with the adopted absolute photon energy scale uncertainty. Accounting for both the statistical and systematic uncertainties, we conclude that the LMC origin of the highly-ionized X-ray absorption lines detected in the LMC X–3 observations can be ruled out kinematically at confidence.
What is the origin of the cool oxygen absorption lines? O I and O II trace the cold and warm phases of the ISM (Field & Steigman, 1971). From the EW measurements of the O I and O II K absorption lines, the CoG plots of Juett, Schulz, & Chakrabarty (2004), and the Galactic ISM oxygen abundance, we estimate the equivalent hydrogen column densities of the cold and warm phases as 3.2(1.9, 5.3) and 1.2(0.5, 2.0) , respectively (neglecting a potenital, but typically small O III contribution). These column densities, especially their lower limits, are not sensitive to the exact (assumed to be ; Reynolds (1988)) and are consistent with estimated from the oxygen absorption edge analysis of an XMM-Newton grating spectrum of LMC X–3 (Page et al., 2003). The consistent column density values are also obtained in modeling the broad band continuum observed with BeppoSAX (Yao, Wang, & Zhang, 2005) and Chandra (§ 1). The warm gas column density is in good agreement with the value expected from the so-called Reynold’s layer of our Galaxy (Reynolds, 1989). The cold gas is further traced by the 21 cm emission line (though with a poor spatial resolution), which gives a neutral hydrogen column density of in the LMC X–3 field and shows a mean velocity of (Staveley-Smith et al., 2003; Dickey & Lockman, 1990). There is little emission in the 100-430 velocity range (). These values are consistent with the C II absorption seen in the UV spectrum (Fig. 8); bearing in mind that a substantial portion of the C II feature at LMC velocities is actually due to C II* and O VI 1037.62 at km s-1, any remaining C II at 300 km s-1 could easily arise in gas with (H I) . Therefore, the cool oxygen absorption lines are also primarily Galactic.
The Galactic origin of the O I and O II absorption lines is not inconsistent with their velocity centroid listed in Table 1. There are considerable wavelength uncertainties in both the theoretical calculations and the laboratory measurements of the O I and O II lines. Laboratory measurements of the O I K transition, for example, range from 23.489 to 23.536 Å (Stolte et al., 1997), which is at least partially due to systematic uncertainties in the absolute wavelength calibration, and are probably less accurate than X-ray absorption line observations (Juett & Chakrabarty, 2005). The mean centroid of the O I K lines listed in Table 2 is between the LETG-HRC measurement of LMC X–3 and the mean value obtained by Juett, Schulz, & Chakrabarty (2004) from a similar analysis of Chandra MEG-ACIS observations of Galactic LMXBs. All these line centroid measurements agree with each other within statistical uncertainties. It is based on these considerations that we decided to use the mean O I K line centroid in Table 2 as a reference for the velocity shift in Table 1. Furthermore, LMC X–3 has the Galactic coordinates of ; the conversion of our measured line-of-sight velocities into values in the local standard of rest or in the Galactic standard of rest requires a correction of -13 or -199 , respectively (assuming a Galactic rotation speed of 220 in the solar neighborhood and neglecting the smaller barycenter correction). Therefore, the O I and O II K line centroids, though with large uncertainties, are consistent with an origin in the local ISM.
We may now further constrain the origin of the O VII absorption line from its energy separation from the O I line. This relative line separation should be independent of the absolute energy scale accuracy of the observations. Table 2 shows that the separation mÅ for the LMC X–3 is consistent with the mean value ( mÅ) for the other sources and is grossly inconsistent with the value (1882 mÅ) if O VII is redshifted to the LMC X–3 velocity. Therefore, the O VII absorption line most likley does not originate in the LMC.
Of course, the above consideration of the line positions alone cannot be conclusive about the exact origin of the O VII absorption line. The systemic redshift of LMC X–3 might be compensated by a blueshift of the O VII absorber. LMC X–3 is an X-ray binary of an unseen primary compact object, which has been interpreted as a 10-15 black hole, and a secondary star (B3 V) with an orbital period of 1.7 days (Cowley et al., 1983; Hutchings et al., 2003). The X-ray emission is apparently powered by accretion via Roche lobe overflow (Nowak et al. (2001) and references therein). An absorption line produced by a potential accretion disk and/or stellar wind should be broad and blue shifted. The expected velocity width and shift should be comparable to the escape velocity, on the order of (e.g., Yao & Wang (2005); Paerels et al. (2000)), which is not consistent with our measurement of the O VII line (Table 1). Similarly, one may expect to detect a strong O VI absorption by a wind, probably in its outer regions where the ionization parameter becomes relatively small. Clearly, such a wind scenario is inconsistent with the constancy, narrowness, and rest-frame velocity of the O VI absorption detected with FUSE. In addition, there is no sign for any proximity effect of LMC X–3, an optical nebula or significant absorption by photo-ionized species (e.g., Yao & Wang (2005)), indicating a lack of gas around the X-ray source. We thus tenatively conclude that the O VII as well as the O VI and O I absorption lines arise in the gas in and/or around the Galaxy.
4.2. Properties of the far-UV and X-ray-absorbers
Clearly, the inference of the total column density of the X-ray-absorbing gas depends on its absolute metal abundance, which is yet to be determined observationally. We may use the dispersion measures (DMs) of pulsars observed in the vicinity of LMC X-3 to estimate the total number of free electrons along the sight-line. Among the four known radio pulsars in the LMC, PSR J0502-6617 and J0529-6652 are close to the LMC X-3 sight-line (Fig. 1) and have the DMs of 68.9() and 103.2() (1 error bars; Crawford et al. (2001)). The difference in the DMs presumably reflects the different contributions of free electrons in the LMC, because both pulsars are projected in regions with significant local H emission (Fig. 1). In addition, the Galactic warm H II medium is also expected to be a main (probably dominant) source of the free electrons. Therefore, we can only get an upper limit to the total hot gas column density from the DMs. The lower DM value of J0502-6617 (), presumably least contaminated by the warm H II medium, is only slightly higher (by a factor of 1.5) than that expected from Galactic pulsar DMs, but is almost same as its highest individual value (accounting for the Galactic latitude dependence, i.e., sin ). From the comparison of our estimate (§3.1) with the J0502-6617 DM value, we obtain an oxygen abundance as of the Galactic ISM value (§1), where is the fraction of the electrons in the hot gas. If our estimate of the warm H II column density from the O II measurement is reasonable (§4.1), i.e., , the oxygen abundance can then be close to the ISM value or even substantially higher. Although various relevant systematics are difficult to quantify here, the lower limit to the oxygen abundance, 16% (or an O/H number ratio of ), should be quite firm. Therefore, the hot gas is unlikely to be accreted recently from the intergalactic medium (IGM).

We may also constrain the Ne/O abundance ratio, which is used in the inference of the hot gas parameters. Published X-ray studies are all based on measurements of absorption edges, which are produced primarily by cool gas. The neutral Ne/O ratio has been determined to be and of the assumed ISM value in the sight-lines of the X-ray binaries Cygnus X–1 (Schulz et al., 2002) and X–2 (Takei et al., 2002), respectively. Several X-ray binaries indicate unusually high Ne/O ratios in X-ray-absorbing gas (a factor of a few higher; Paerels et al. (2001); Juett & Chakrabarty (2005)). Such high Ne/O ratios, very difficult to explain in the ISM context, are believed to arise from material local to the binaries, which typically show either coronal emission lines or burst behavior. In one occasion, the Ne/O ratio apparently varies with time (Juett & Chakrabarty, 2005). With the measurements of the line absorption by the highly-ionized species, it is now also possible to measure the relative metal abundances of hot gas. While we are not aware of such a measurement in publication, a joint analysis of multiple absorption lines observed in the spectra of the X-ray source 4U1820-303 without apparent local contamination does indicate a normal Ne/O ratio of the X-ray-absorbing hot gas (Yao & Wang, in preparation). Similarly, if the ratio is allowed to freely vary in our absline fit of the LMC X-3 X-ray spectrum in §3.1, we obtain a 95% confidence lower limit of 0.8 times the ISM value, or a Ne/O elemental number ratio of 0.14; the upper limit cannot be meaningfully constrained (Fig. 9). Therefore, the Ne/O ratio of the hot gas along the LMC X-3 sight-line is consistent with a normal ISM value.
In the absline fit, the hot gas temperature decreases with the increase of the assumed Ne/O ratio value. But (O VII) (or ) hardly changes, because the ionic fraction () is insensitive to the exact value of the temperature in the range of K (e.g., Yao & Wang 2004). Similarly, , especially its most useful lower limit, is insensitive to the Ne/O ratio value (Fig. 7).
How are the absorbers as observed in the LMC X-3 sight-line related to the general hot ISM in the Galaxy? The two AGN sight-lines nearest to LMC X-3 (NGC 1705 and PKS 0558-504) do show low-velocity O VI absorption features (239 and 257 mÅ respectively, with statistical errors of about 17 mÅ, see Wakker et al. 2003), consistent with our above measurement for the LMC X-3 sight-line. The inferred physical properties of the X-ray-absorbing gas along this sight-line are also comparable to those along the sight-lines away from the diffuse soft X-ray emission enhancement in the Galactic central region (Snowden et al. 1997). Based on nine similar detections (mainly O VII K and Ne IX K absorption lines) in the spectra of Galactic X-ray binaries and AGNs, Yao & Wang (2005) show that the hot gas column density along the sight-line to LMC X–3 is consistent with a global characterization of the hot ISM in the Galaxy. Assuming a disk morphology, the vertical exponential scale height of the hot gas is kpc. Compared with the previously measured scale heights of , and kpc for O VI, N V, C IV, and Si IV, respectively (e.g., Savage et al. 1997, 2000), the hot gas appears to follow a trend from high to low ionization states away from the Galactic plane [i.e., the scale height apparently increases with the decreasing ionization potential of the species (Wang & Yao, 2005)]. Such an ionization stratification may be understood as a result of a Galactic fountain, in which hot gas heated primarily by supernova blastwaves in the Galactic disk cools off on the way to the Galactic halo (Shapiro & Field, 1976; Bregman, 1980).
A Galactic fountain scenario may also explain the nonthermal broadening of the far-UV- and X-ray-absorbing gas (§3). After the correction for the local standard of rest, the far-UV- and X-ray-absorbing hot gas along the sight-line to LMC X–3 seems to have a systemic velocity close to zero, relative to the cold gas in the solar neighborhood (Table 1). Therefore, the hot gas should nearly co-rotate with the stellar (or cool gas) disk. Because of the high Galactic latitude location of LMC X–3, the line-of-sight velocity of the hot gas should hardly change through the disk with a flat rotation curve in the solar neighborhood. The expected lagging “halo” effect, as observed in diffuse cool and warm gases around nearby edge-on disk galaxies (Collins et al. 2002 and references therein), should be small on scales of the hot gas disk. Therefore, the presence of the nonthermal broadening may suggest a significant vertical velocity gradient of the hot gas, as is expected in a Galactic fountain (Shapiro & Field, 1976; Bregman, 1980).
In this Galactic fountain scenario, and in the general ISM context, O VI and O VII are expected to co-exist globally, though probably not in the exactly same phase. As an extreme case, we may assume that the observed O VI column all arises in the X-ray-absorbing gas and may then jointly fit the X-ray absorption lines with the FUSE O VI line. This fit gives log, , log, and the Ne/O ratio of the absorbing gas as 19.5(19.3, 19.8), 74(61, 94), 5.82(5.75, 5.91), and 3.1(), respectively. The temperature obtained here represents the lowest possible limit; otherwise, the observed O VI absorption should be stronger. If only a fraction of the observed O VI absorption arises in the X-ray-absorbing gas, the temperature (Ne/O ratio) would then be greater (smaller). In general, one needs to consider the possible multi-phase nature of the hot gas. O VI traces hot gas at the peak of its cooling curve and thus typically represents a very unstable transient phase, as is expected in the cooling hot gas of the Galactic fountain and/or at interfaces between hot and cool gases. Of course, the gas could in principle be in a non-CIE state, although its effect does not seem to be important for such highly-ionized species as O VI and O VII in a typical ISM cooling flow (Sutherland & Dopita, 1993). While a comprehensive examination of these potential complications requires data of better quality, the results from the above far-UV and X-ray joint-fit should be used with extreme caution.
4.3. Implication for other O VII absorbers
The above discussion corroborates the conclusion that the bulk of the highly-ionized gas is located near the Milky Way, most likely in a thick hot gaseous disk. The presence of this disk has strong implications for the interpretation of similar O VII absorbers observed in AGN spectra. Both the temperature and the line broadening of the hot gas in the LMC X–3 sight-line are comparable to those of the absorbers in the AGN sight-lines. In the sight-line to Mkn 421 () in particular, which is also away from the Galactic central X-ray emission enhancement, the inferred vertical gas column density (Yao & Wang 2005) agrees well with our measurement of in the direction of LMC X–3. But, the allowed absorbing column density beyond the LMC distance () may still be consistent with the recent prediction of a large-scale ( kpc radius), very low density hot gaseous halo around the Milky Way, resulting from the accretion and cooling of the IGM (Maller et al., 2004). Additional contribution to O VII may also come from larger distances such as the Local Group, or even from the larger scale local filament (Williams et al. 2005; Nicastro et al. 2002). Furthermore, the hot gas properties might change from one sight-line to another; a comparison between a couple of sight-lines may not be considered to be conclusive. A systematic analysis of the existing data as well as sensitive new observations would be very helpful.
5. Summary
We have presented our TOO Chandra and FUSE spectroscopic observations of the black hole X-ray binary LMC X–3 in its high/soft state. These observations, enhanced by archival FUSE data, allow us for the first time to measure both far-UV and X-ray absorption lines along a 50 kpc sight-line with little extragalactic confusion. Our main results and conclusions are as follows:
-
•
We have detected the absorption lines produced by the O VII K and Ne IX K transitions. A joint fit of these lines, together with the upper bounds to the O VII K, and O VIII K lines, gives an O VII column density of and a velocity dispersion of . These results are insensitive to the exact Ne/O elemental number ratio, to which only a 95% confidence lower limit of 0.14 is determined. The hot gas, assumed to be in a CIE state, has a characteristic temperature in the range of K.
-
•
The X-ray-absorbing gas is likely to be primarily Galactic in origin. This conclusion is based on the consistency of both the measured absolute O VII line centroid and its relative velocity offset from the O I line, which should be predominantly Galactic. An origin of the gas in a wind from LMC X–3 may also be ruled out by the narrowness and apparent time invariance of the X-ray absorption lines.
-
•
The FUSE spectrum shows a strong ( confidence) Galactic O VI line absorption; there might be additional weak () O VI absorption features at LMC velocities (). The well-resolved Galactic absorption corresponds to an O VI column density of , which is greater than the value expected from the X-ray absorption line modeling. This discrepancy may indicate a multi-phase state of the absorbing gas.
-
•
We speculate that the highly-ionized absorbing gas represents a supernova-driven Galactic fountain, which globally resembles a thick gaseous disk with decreasing ionization away from the Galactic plane. In particular, this Galactic fountain scenario naturally explains the significant nonthermal velocity broadening inferred from the direct O VI line width measurement and from the relative strengths of the X-ray absorption lines. We further trace the warm H II gas along the LMC X–3 sight-line with our detected O II K line. From the X-ray absorption measurements and the Galactic (pulsar) dispersion measure in the LMC X–3 vicinity, we estimate the oxygen abundance of the X-ray absorbing gas to be of the Galactic ISM value. Therefore, the X-ray-absorbing gas is metally rich.
-
•
The X-ray absorption lines along the LMC X–3 sight-line have properties similar to those of other highly-ionized absorbers observed in the spectra of Galactic X-ray binaries and extragalactic AGNs (Yao & Wang 2005). While there is still room for a significant presence of very low-density diffuse hot gas on scales greater than 50 kpc (e.g., the Local Group), any such extragalactic studies of highly-ionized species at must take into account the Galactic hot ISM component.
References
- Bregman (1980) Bregman, J. N. 1980, ApJ, 236, 577
- Cen & Ostriker (1999) Cen, R. & Ostriker, J. P. 1999, ApJ, 514, 1
- Collins et al. (2002) Collins, J. A., Benjamin, R. A., & Rand, R. J. 2002, ApJ, 578, 98
- Collins, Shull, & Giroux (2005) Collins, J. A., Shull, J. M., & Giroux, M. L. 2005 ApJ, 623, 196
- Cowley et al. (1983) Cowley, A. P. et al. 1983, ApJ, 272, 118
- Cowley et al. (1991) Cowley, A. P. et al. 1991, ApJ, 381, 526
- Crawford et al. (2001) Crawford, F., et al. 2001, ApJ, 553, 367
- Danforth et al. (2002) Danforth, C. W., Howk, J. C., Fullerton, A. W., Blair, W. P., & Sembach, K. R. 2002, ApJS, 139, 81
- Davé et al. (2001) Davé, R. et al. 2001, ApJ, 552, 473
- Dickey & Lockman (1990) Dickey, J.M., & Lockman, F.J., 1990, ARA&A 28, 215
- Fang, Bryan, & Canizares (2002) Fang, T., Bryan, G. L., & Canizares, C. R. 2002, ApJ, 564, 604
- Fang et al. (2002) Fang, T., et al. 2002, ApJ, 572, 127
- Fang, Sembach, & Canizares (2003) Fang, T., Sembach, K. R., & Canizares, C. R. 2003, ApJ, 586, 49
- Field & Steigman (1971) Field, G. B., & Steigman, G. 1971, ApJ, 166, 59
- Finkbeiner (2003) Finkbeiner, D. P. 2003, ApJS, 146, 407
- Fitzpatrick & Spitzer (1997) Fitzpatrick, E. L., & Spitzer, L. 1997, ApJ, 475, 623
- Fukugita, Hogan, & Peebles (1998) Fukugita, M., Hogan, C. J. & Peebles, J. P. E. 1998, ApJ, 503, 518
- Futamoto et al. (2004) Futamoto, K., et al. 2004, ApJ, 605, 793
- Grevesse & Sauval (1998) Grevesse, N., & Sauval, A.J. 1998, Space Science Reviews 85, 161
- Howk et al. (2002) Howk, J. C., Sembach, K. R., Savage, B. D., Massa, D., Friedman, S. D., & Fullerton, A. 2002, ApJ, 569, 214
- Hutchings et al. (2003) Hutchings, J. B., Winter, K., Cowley, A. P., Schmidtke, P. C., & Crampton, D. 2003, AJ, 126, 2368
- Juett, Schulz, & Chakrabarty (2004) Juett, A. M., Schulz, N. S., & Chakrabarty, D. 2004, ApJ, 612, 308
- Juett & Chakrabarty (2005) Juett, A. M., & Chakrabarty, D. 2005, ApJ, 627, 926
- Kawatsura et al. (2002) Kawatsura, K., et al. 2002, J. Phys. B, 35, 4147
- Kirkman & Tytler (1997) Kirkman, D., & Tytler, D. 1997, ApJ, 489, 123
- Maller et al. (2004) Maller, A. H., & Bullock, J. S. 2004, MNRAS, 355, 694
- Mathur et al. (2003) Mathur, S., Weinberg, D. H., & Chen, X. 2003, ApJ, 582, 82
- McKernan et al. (2004) McKernan, B., Yaqoob, T., & Reynolds, C. S. 2004, ApJ, 617, 232
- Moos et al. (2000) Moos, H. W., et al. 2000, ApJ, 538, L1
- Moos et al. (2002) Moos, H. W., et al. 2002, ApJS, 140, 3
- Nicastro et al. (2002) Nicastro, F., et al. 2002, ApJ, 573, 157
- Nicastro et al. (2005) Nicastro, F., et al. 2005, ApJ, 629, 700
- Nowak et al. (2001) Nowak M.A., et al. 2001, MNRAS, 320, 316
- Paerels et al. (2000) Paerels, F., et al. 2000, ApJL, 533, 135
- Paerels et al. (2001) Paerels, F., et al. 2001, ApJ, 546, 338
- Page et al. (2003) Page, M. J., et al. 2003, MNRAS, 345, 639
- Rasmussen, Kahn, & Paerels (2003) Rasmussen, A., Kahn, S. M., & Paerels, F. 2003, in The IGM/Galaxy Connection: The Distribution of Baryons at z = 0, ed. J. L. Rosenberg & M. E. Putman (Dordrecht: Kluwer), 109 (astro-ph/0301183)
- Reynolds (1988) Reynolds, R. J. 1988, ApJ, 333, 341
- Reynolds (1989) Reynolds, R. J. 1989, ApJL, 339, 29
- Reimers et al. (2001) Reimers, D., Baade, R., Hagen, H.-J, & Lopez, S. 2001, A&A, 374, 871
- Savage et al. (1997) Savage, B. D., et al. , 1997, AJ, 113, 2158
- Savage et al. (2000) Savage, B. D., et al. , 2000, ApJ, 538, 27
- Savage et al. (2005a) Savage, B. D., Lehner, N., Wakker, B. P., Sembach, K. R., & Tripp, T. M. 2005a, ApJ, 626, 776
- Savage et al. (2005b) Savage, B. D., Wakker, B. P., Fox, A. J., & Sembach, K. R. 2005b, ApJ, 619, 863
- Schulz et al. (2002) Schulz, N. S., et al. 2002, ApJ, 565, 1141
- Sembach et al. (2004) Sembach, K. R., Tripp, T. M., Savage, B. D., & Richter, P. 2004, ApJS, 155, 351
- Sembach & Savage (1992) Sembach, K. R., & Savage, B. D. 1992, ApJS, 83, 147
- Shapiro & Field (1976) Shapiro, P. R., & Field, G. B. 1976, ApJ, 205, 762
- Simcoe, Sargent, & Rauch (2002) Simcoe, R. A., Sargent, W. L. W., & Rauch, M. 2002, ApJ, 578, 737
- Staveley-Smith et al. (2003) Staveley-Smith, L., Kim, S., Calabretta, M. R., Haynes, R. F. & Kesteven, M. J. 2003, MNRAS, 339, 87
- Stolte et al. (1997) Stolte, W. C., et al. 1997, J. Phys. B, 30
- Sutherland & Dopita (1993) Sutherland, R. S. & Dopita, M. A. 1993, ApJS, 88, 253
- Takei et al. (2002) Takei, Y., et al. 2002, ApJ, 581, 307 , 4489
- Tripp et al. (2001) Tripp, T. M., Giroux, M. L., Stocke, J. T., Tumlinson, J., & Oegerle, W. R. 2001, ApJ, 563, 724
- Tripp & Savage (2000) Tripp, T. M., & Savage, B. D. 2000, ApJ, 542, 42
- Tripp, Savage, & Jenkins (2000) Tripp, T. M., Savage, B. D., & Jenkins, E. B. 2000, ApJ, 534, L1
- Wakker et al. (2003) Wakker, B. P., et al. 2003, ApJS, 146, 1
- Wang & Yao (2005) Wang, Q. D., & Yao, Y. 2005, in X-ray Diagnostics for Astrophysical Plasmas, AIPC, 774, 191
- Williams et al. (2005) Williams, R. J., et al. 2005, ApJ, in press (astro-ph/0504558)
- Wilms, Allen, & McCray (2000) Wilms, J., Allen, A., & McCray, R. 2000, ApJ, 542, 914
- Yao & Wang (2005) Yao, Y., & Wang, Q. D. 2005, ApJ, 624, 751
- Yao, Wang, & Zhang (2005) Yao, Y., Wang, Q. D., & Zhang, S. N. 2005, MNRAS, 362, 229