On the X-ray Emission from Massive Star Clusters and their Evolving Superbubbles
Abstract
Here we discuss the X-ray emission properties from the hot thermalized plasma that results from the collisions of individual stellar winds and supernovae ejecta within rich and compact star clusters. We propose a simple analytical way of estimating the X-ray emission generated by super star clusters and derive an expression that indicates how this X-ray emission depends on the main cluster parameters. Our model predicts that the X-ray luminosity from the star cluster region is highly dependent on the star cluster wind terminal speed, a quantity related to the temperature of the thermalized ejecta. We have also compared the X-ray luminosity from the SSC plasma with the luminosity of the interstellar bubbles generated from the mechanical interaction of the high velocity star cluster winds with the ISM. We found that the hard (2.0 keV - 8.0 keV) X-ray emission is usually dominated by the hotter SSC plasma whereas the soft (0.3 keV - 2.0 keV) component is dominated by the bubble plasma. This implies that compact and massive star clusters should be detected as point-like hard X-ray sources embedded into extended regions of soft diffuse X-ray emission. We also compared our results with predictions from the population synthesis models that take into consideration binary systems and found that in the case of young, massive and compact super star clusters the X-ray emission from the thermalized star cluster plasma may be comparable or even larger than that expected from the HMXB population.
1 Introduction
In many starburst and in interacting and merging galaxies a substantial fraction of the star formation is concentrated in a number of compact, young and massive stellar clusters or super stellar clusters (SSCs; see, for example, Holtzman et al. 1992; Ho, 1997; O’Connell, 2004 and references therein). The high stellar densities, the large energy and mass deposition rates, provided by stellar winds and supernovae explosions (SNe), suggest that SSCs are potentially strong X-ray emitters (Chevalier, 1992).
Indeed the X-ray emission from NGC 3603, Arches cluster in our Galaxy and R136 in the LMC, the local analogies to low mass SSCs, has been detected (Moffat et al, 2002; Yusef-Zadeh et al. 2002; Stevens & Hartwell 2003). The X-ray emission from Arches cluster has a diffuse component and five discrete sources. Overall, 40% of the observed emission is diffuse and 60% comes from the discrete sources. The absorption-corrected X-ray luminosity (between 0.5 - 8 keV) is erg s-1 and the best spectral fit requires the metallicity of the X-ray plasma to be 4 - 5 times solar (Law & Yusef-Zadeh, 2004). Similarly, the X-ray luminosity from R136 in 30 Doradus is erg s-1 (Stevens & Hartwell 2003). On the other hand, an examination of the XMM-Newton observations led Smith & Wang (2004) to the discovery of the diffuse X-ray emission from a 100 pc superbubble, 30 Doradus C, associated with a rich OB-association LH 90, located south-west of the center of 30 Doradus. The examination of the X-ray spectrum indicates also an overabundance of -elements in the bubble plasma by a factor , compared to the metallicity of the LMC.
X-ray emission detected in distant galaxies presents overall two components: an extended diffuse component that seems to be related to a collection of superbubbles associated to individual star clusters, and a number of unresolved point-like sources (Summers et al. 2004; Metz et al. 2004; Smith et al. 2005). In some cases, the X-ray emission shows good coincidence with the young stellar clusters (Metz et al. 2004). However, there are also many examples of X-ray regions that do not present any evidence of active star formation. In other cases the X-ray sources seem to be shifted relative to the nearby star clusters and some massive clusters seem to emit no X-rays at all (Kaaret et al. 2004). Thus the origin of the X-ray emission in distant galaxies and the dependence of the detected X-ray emission on the parameters of the embedded star clusters remain controversial.
Here we discuss how the mechanical energy deposited by stellar clusters restructures the host galaxy ISM while producing a hot plasma which should be detected in the X-ray regime (see section 2). In sections 3 and 4 we demonstrate that the mechanical energy from SSCs leads to a two-component plasma model: a high temperature, overabundant in elements plasma, ejected from the star cluster, and a lower temperature, extended, interstellar bubble component. Here we discuss how the luminosity of the hot component depends on the star cluster parameters and in section 5 we compare the contributions from both components when evolving in different interstellar environments and as a function of time.
2 Super Star Cluster Winds and their Impact on the ISM
The interaction of the high velocity outflow that results from the energy injected by multiple stellar winds and supernovae (SNe) explosions within a star cluster volume, leads to a major re-structuring of the ISM. The evolution under the assumption of a uniform density case, causes, as in the case of a stellar wind (Weaver et al. 1977), several physically distinct regions (see Figure 1), promoted by the shock waves (inner and outer shocks) that result from the wind-ISM interaction. The X-ray emission from such structure, must take first into account the central star cluster (zone A), filled with the thermalized, high temperature plasma, injected by winds and SNe. There the large central overpressure that results from thermalization, accelerates the injected gas and eventually blows it out of the star cluster volume while generating a stationary wind (Chevalier & Clegg, 1985). The central zone A, a powerful X-ray emitter, is surrounded by the free-wind region (zone B in Figure 1) where the high metallicity matter emanating from the SSC volume rapidly acquires its terminal velocity (), while its density and temperature begin to steadily drop as and . Zone B is also, in the case of SSCs, a source of X-ray emission. Its main contribution, as shown below, arises from regions in the immediate neighborhood of the SSC, although formally X-rays are emitted throughout the whole zone down to its outer boundary: the reverse inner shock. An exception to this latter issue is for massive and compact SSCs whose winds become strongly radiative, bringing the temperature well below the lower limit for X-ray emission ( K), long before reaching the inner shock (Silich et al. 2003, 2004). Whether the SSC wind undergoes cooling or not, it eventually crosses the inner shock to be once again thermalized. This generates and maintains the hot superbubble (zone C), the reservoir of thermal energy that drives the outer shock into the ISM. The hot superbubble spans from the location of the inner shock to the contact discontinuity that separates the hot wind from the expanding outer shell of interstellar swept up matter, accelerated by the leading shock (zone D). Given the strength of the shocks, at first the two outer zones are strong X-ray emitters. Soon however, particularly for large ISM densitites ( cm-3), radiative cooling brings the temperature down in zone D, causing its condensation into a thin, dense and cool expanding outer shell. In cases in which magnetic fields are not considered the internal structure of zone C, its chemical composition and its X-ray emissivity, depend strongly on the evolution time, , and on the rate at which mass is evaporated from the cold outer shell into the hot superbubble interior (see Bisnovatyi-Kogan & Silich, 1995 and references therein).

3 The Inner Structure of the X-ray region
In the adiabatic solution the temperature and density of the gas at the star cluster surface, , may be inferred from the mass and energy conservation laws (see equations 4 and 6 in Silich et al. 2004). They are:
| (1) | |||
| (2) |
where and are the mechanical energy and mass deposition rates, is the Boltzmann constant, is the ratio of specific heats, is the mean mass per particle for a fully ionized plasma, , is the sound velocity at the star cluster edge, and , is the resultant wind adiabatic terminal speed, is the mechanical luminosity of the SSC measured in units of erg s-1, is the star cluster radius measured in units of 1 pc, and is the wind adiabatic terminal speed in units of 1000 km s-1. The temperature and density of the gas inside the star cluster are always close to the adiabatic values if the stationary wind regime is possible.
On the other hand, from the work of Chevalier & Clegg (1985), Cantó et al. (2000), who considered the adiabatic solution for SSC winds, and from the recent semi-analytical radiative solution of Silich et al. (2004) we know that density and temperature inside of the star cluster volume remain almost constant (in the adiabatic case the ratio of the temperature at the star cluster surface to the central temperature is ) and are completely defined by the star cluster parameters (, and ). This is also the case in the radiative solution, although one has to take also the chemical composition of the ejected material into account. Thus the density and the temperature distributions in zone A may be approximated as
| (3) |
where the fiducial coefficient takes into consideration the deviation of density in zone A from the homogeneous distribution (the small deviation of temperature from the surface value leads to negligible changes of the X-ray emissivity).
In zone B all variables rapidly approach their asymptotic values, . In the strongly radiative regime the temperature may drop faster and reach values K at smaller radii. However the contribution of this zone to the total X-ray luminosity is small and it arises mainly from a region close to the SSC surface (see section 4).
The expansion of the outer shock is supported by the thermal pressure of the thermalized wind (zone C in Figure 1). In the case of a homogeneous ISM and a constant rate of mechanical energy deposited by the central cluster, the time evolution of the outer shock radius, , the reverse shock radius, , and of the expansion velocity, , of the outer shell are given by (Koo & McKee, 1992)
| (4) |
where is the bubble age and is the density of the ISM.
The shocked ISM in zone D remains adiabatic until the evolution time becomes larger than its characteristic cooling time scale, , (Mac Low & McCray, 1988), when
| (5) |
where is the ISM gas metallicity measured in the Solar units and is the ISM gas number density. When exceeds , the gas in zone D becomes thermally unstable and collapses into a thin cold expanding outer shell. After this stage the density and the temperature distributions inside the bubble (zone C) are dominated by thermal evaporation of matter from the cold shell into the superbubble. If thermal evaporation is not blocked by magnetic fields, the density and the temperature distributions in zone C are (Weaver et al. 1977; Mac Low & McCray, 1988)
| (6) |
where is the fractional radius, is the radius of the contact discontinuity, and are functions of the evolutionary time: cm-3, K, and here is measured in year units.
4 The X-ray model
Once the distributions of density and temperature in the various zones above described (zones A, B, C, including at earlier times also zone D) are known, one can calculate the X-ray luminosity from the whole remnant. This is given by
| (7) |
where is the atomic number density, marks the location of the outer shock and is the X-ray emissivity derived by Raymond & Smith (1977) in their hot-plasma code (see Strickland & Stevens 2000). Clearly, regions in which the gas temperature is below the X-ray cut-off temperature (K), would not contribute to the global X-ray emission.
4.1 The X-ray luminosity from the star cluster and its free wind
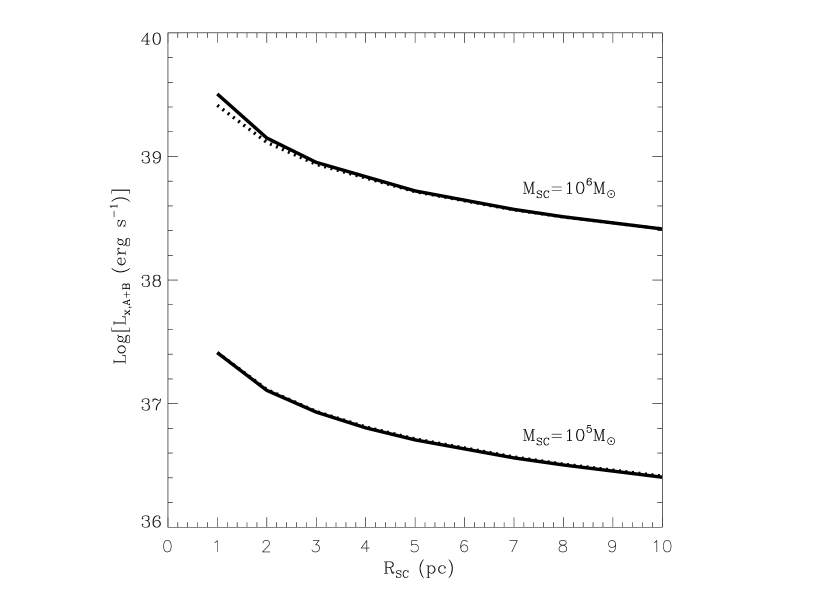
The temperature and density distributions within zones A and B, obtained from the numerical models (see Silich et al. 2004), lead to the corresponding X-ray luminosity. The results of the calculations for a clusters of 1 pc and 10 pc radii are presented in Figure 2. The figure shows the contribution, , arising from concentric shells with inner radius, , and outer radius equal to the X-ray cutoff radius, to the total X-ray luminosity, , from zones A and B. Figure 2 shows that the contribution from the free-wind region (zone B) is negligible. The value of for shells with radius never exceeds of the cumulative emission from zones A and B. This is mainly due to the rapid decline in density () in the free wind region.
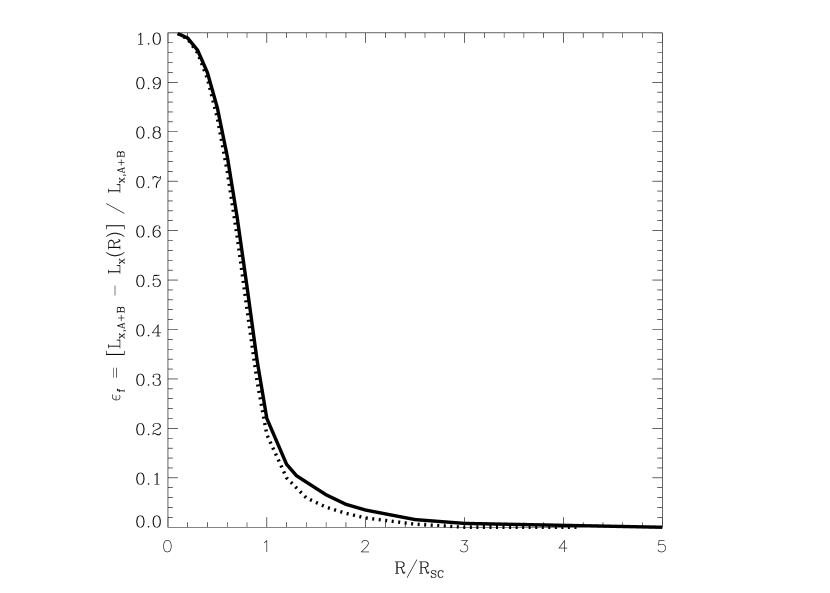
A good estimate of can be obtained if one approximates the density and temperature distributions within zone A by constant values (see equations 3). The evaluation of integral (7) then yields
| (8) |
where is the mean mass per atom. This simple analytic formula also accounts for the contribution from zone B, and is in excellent agreement with the results of our semi-analytical calculations (see Figure 3) if the fiducial coefficient, .
One can also obtain from the equation (3) and re-write equation (8) in the form
| (9) |
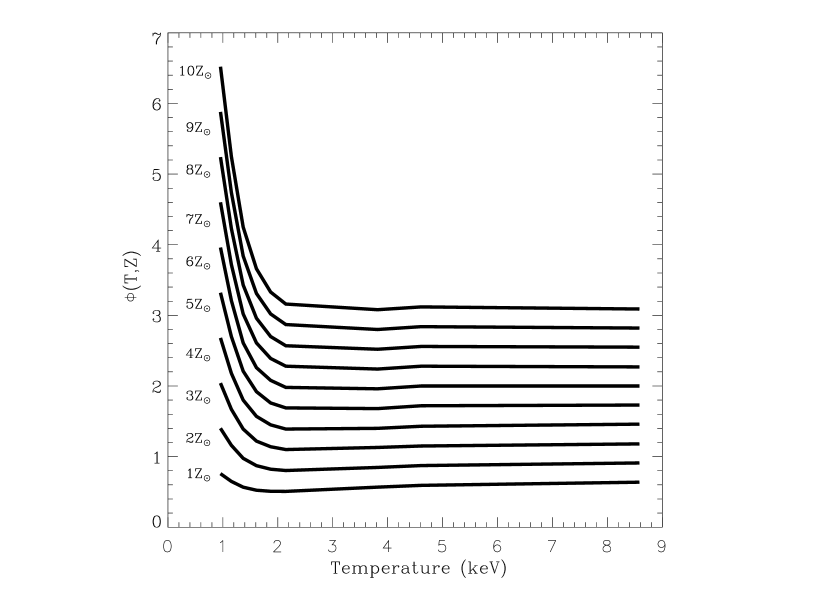
where is the temperature of the X-ray plasma measured in keV units. Equation (9) is normalized to erg cm3 s-1 and the normalization function, , depends on the plasma temperature, , and its metallicity, (see Figure 4). It predicts a quadratic dependence of the X-ray luminosity (zones A and B) on the star cluster mass ( scales linearly with the mass of the cluster) and is similar to the scaling relation from Stevens & Hartwell (2003; note a misprint in their equation 10 where a star cluster wind scaling parameter should be proportional to , see also Oskinova, 2005).
Equation (9) shows how the X-ray emission from the central zones A and B depends on the main star cluster parameters. The strong dependence on comes from the fact that close to the star cluster surface . This last relationship leads to equation (9) as the X-ray luminosity (along with radiative cooling) is in direct proportion to the square of the gas number density. This implies that the wind adiabatic terminal velocity (or the ratio of the energy to the mass deposition rates) is the key parameter that defines the X-ray emission from the central zones. Note that equation (9) cannot be applied to very compact and massive star clusters above the threshold line (see Silich et al. 2004; Tenorio-Tagle et al. 2005), clusters for which the stationary wind solution is inhibited by radiative cooling.
4.2 X-ray luminosity from the bubble
4.2.1 Adiabatic stage.
During the early stages, when , the distributions of density and temperature in zones C and D are close to homogeneous and one can evaluate integral (7) analytically:
| (10) | |||
| (11) |
where and are the shocked wind (zone C) number density and metallicity, and are plasma temperatures in zones C and D, and is the evolutionary time measured in units of yr. Thus, at the adiabatic stage the luminosity from the outer shell highly exceeds that from the hot bubble interior and dominates the total X-ray output. This is due to the much smaller plasma density in zone C (). However, if the metallicity of the ISM is not well below the Solar value, this stage is so short (less than yr; see equation 5), that we omit it in our further consideration.
4.2.2 Hot bubble with a cold outer shell.
At later times the swept up interstellar gas cools down to values well below the X-ray cut-off temperature and forms a dense outer shell separated from the hot bubble interior by the contact discontinuity (see Figure 1). After this stage, the X-ray luminosity of zone C has been calculated by Chu et al. (1993). It is
| (12) |
where is the metallicity of the X-ray plasma in zone C, I is a dimensionless integral with a value close to 2. In the models of Chu et al. (1993) the main contribution to the bubble X-ray luminosity comes from the outer, densest layers of zone C, where the density and temperature are determined by thermal evaporation of the cold outer shell. For this reason the metallicity of the X-ray gas in this zone may be different from that in zones A and B and hardly ever exceeds a few times the solar value (see Silich et al. 2001). Hereafter we assume that the chemical composition of the plasma in zone C is solar, . On the other hand the temperature decreases towards the outer layers (see equation 6) and therefore the X-ray emission from zone C should be much softer than that from zones A and B.
5 Integrated properties of the model predicted X-ray emission and comparison with observations
5.1 Wind vs bubble luminosity
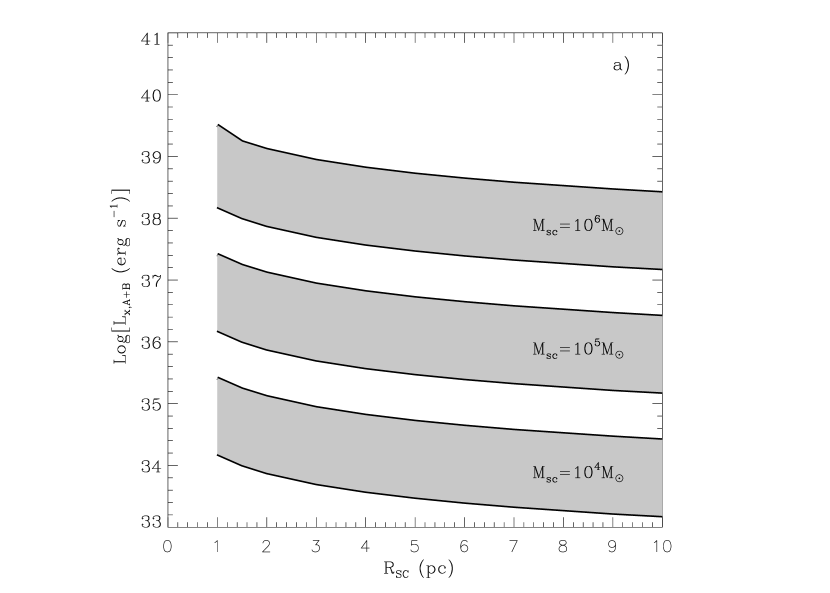
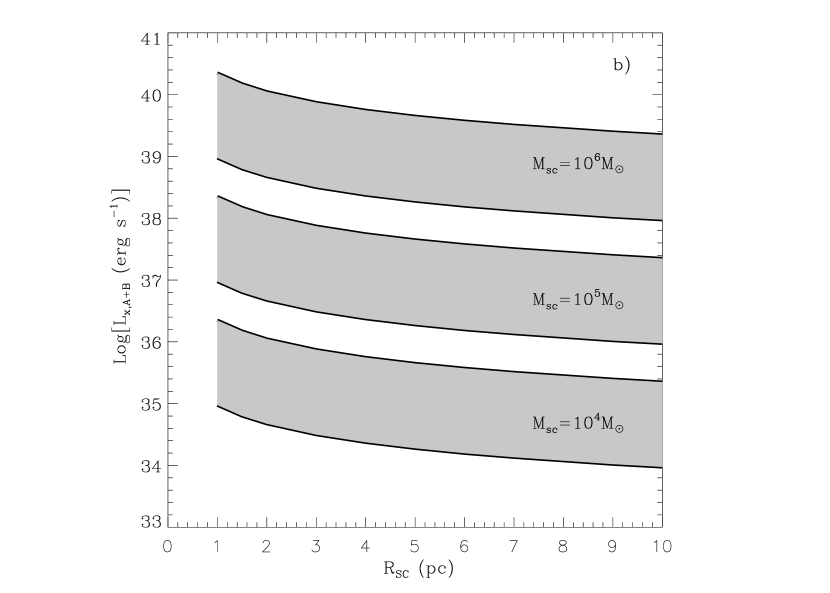
We first used our analytic results (equation 9) to derive the expected X-ray luminosity from clusters of different masses and different radii. The calculated X-ray luminosities from zones A and B for a range of the star cluster wind terminal speeds (1000 km s km s-1) are presented in Figure 5. The expected temperatures of the plasma are K and K for km s-1 and km s-1, respectively (see equation 1). The normalization functions are and for K plasma and and for K for a plasma with and , respectively (see Figure 4). Figure 5 shows that the X-ray luminosity from the cluster (zones A and B) is strongly dependent on the star cluster parameters and may easily vary within several orders of magnitude (the low luminosity limits move towards smaller values if exceeds 1500 km s-1) even for a sample of clusters with a given mass. The crucial parameter, and unfortunately not a well known parameter, is the star cluster wind terminal speed, . Perhaps the only reasonable way to have observational restrictions for this parameter for distant clusters is to measure the temperature of the X-ray plasma to then derive from equation (1). This possibility may provide reasonable estimates for the most massive and compact clusters despite the presence of X-ray binaries (see below).
The luminosities are also dependent on the metallicity of the X-ray plasma (compare panels a and b in Figure 5). For more metallic plasmas the calculated luminosities are shifted to higher values and the difference between the low and the high velocity (temperature) outflows becomes even more significant as the enhanced metallicity affects less the emissivity of the higher temperature plasma (see Figure 4).
We have also compared the X-ray emission from zones A and B with the X-ray emission from the hot bubble interior (zone C) predicted by the Chu et al. (1993) standard model.
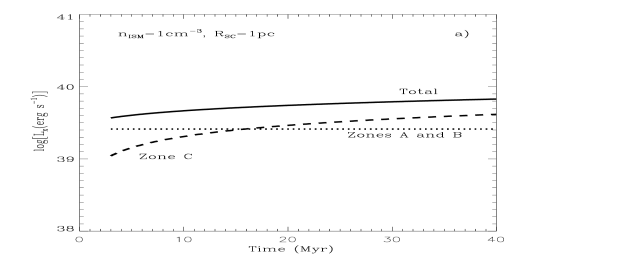
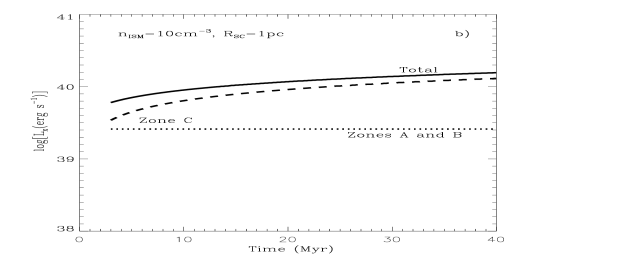
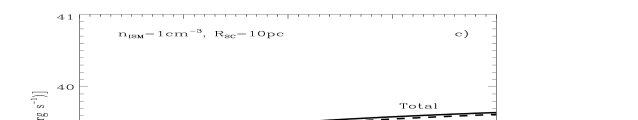
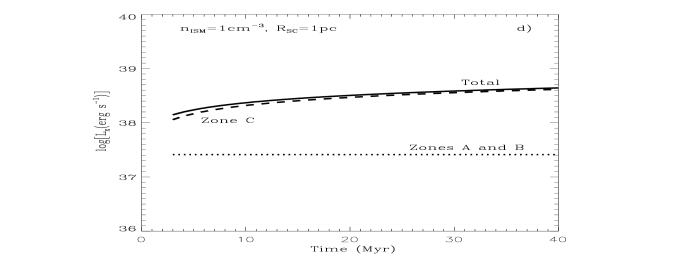
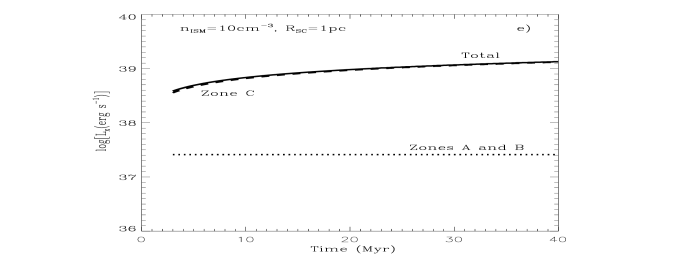

Figure 6 shows the contributions from the star cluster (zones A and B) and from the expanding superbubble (zone C) to the total 0.3 keV - 8.0 keV emission, for clusters of different masses and radii evolving into an ISM with different densities. The X-ray emission from the high temperature zones A and B may dominate only in the case of very massive ( ) and compact (few parsecs) star clusters evolving into a low density ISM (panel a in Figure 6). Otherwise the total luminosity is dominated by the hot superbubble interior. The contribution from the bubble plasma progressively increases with time and becomes dominant after a short while even for compact and massive clusters, if they evolve into a dense ISM (see panel b, Figure 6). The X-ray luminosity from star clusters decreases for larger clusters (see equation 9) shifting the luminosity from zones A and B well below the bubble luminosity even for massive clusters evolving into a low density ISM (see panel c in Figure 6). Clearly, this tendency becomes even stronger for less massive clusters (panels d, e, f in Figure 6). However, even in the case of the rather dense ISM ( cm-3), the radius of the bubble exceeds 90 pc after 1 Myr, in the case of a cluster and 150 pc in the case of a cluster. This implies that compact and massive star clusters are to be detected as point-like X-ray sources embedded into extended regions of diffuse X-ray emission.
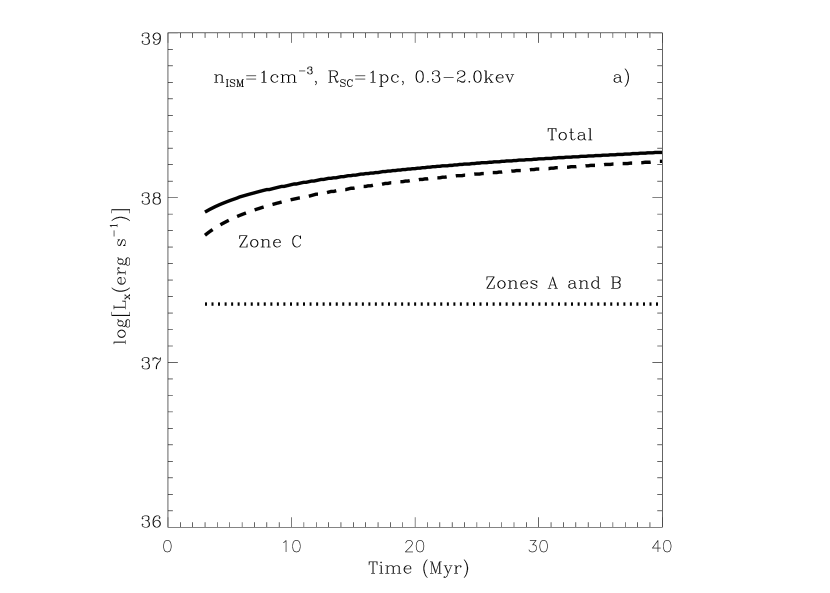
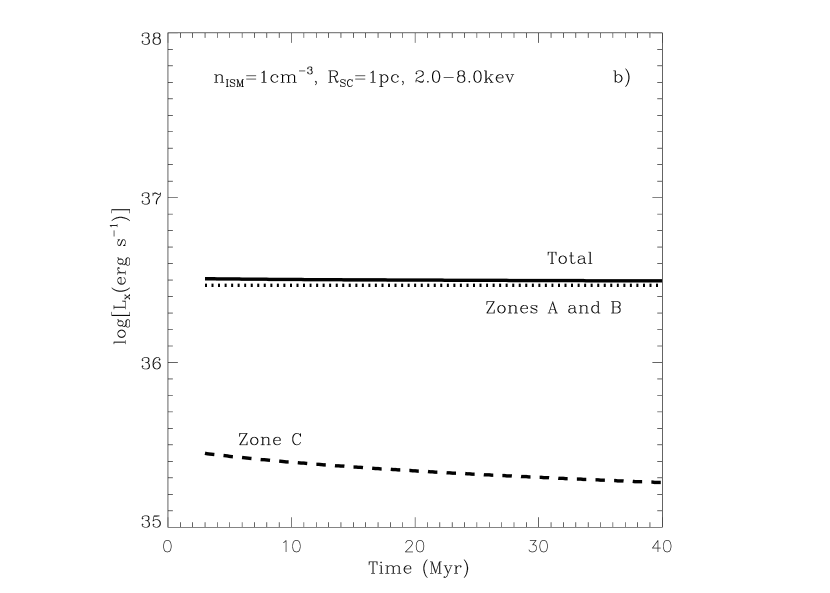
One can also distinguish between zones A and B and zone C from their contributions to the hard and soft energy bands. Indeed, the temperature of the hot plasma ejected from the star cluster region (zone A) is defined by the ratio of the mechanical energy and mass deposition rates (or by the terminal speed of the star cluster wind) and, for reasonable values of , falls in the range 1 keV - 10 keV (see equation 1). At the same time the temperature of the plasma which dominates the bubble X-ray emission is much lower due to dilution with the cold material evaporated from the outer shell. This suggests that the soft component to the X-ray emission is dominated by the bubble plasma whereas the hard component is defined by the hot thermalized ejecta (zone A and B). This conclusion is illustrated by Figure 7 which presents the results of the numerical calculations for a cluster of 1 pc radius evolving into a 1 cm-3 ISM (shown also in Figure 6d). Figure 7 clearly demonstrates that the star cluster ejecta dominates the hard X-ray emission even if the total luminosity is completely defined by the bubble plasma. Note that because of the assumed constant emissivity of the X-ray plasma, formula (12) overestimates the X-ray emission from the bubble interior by a factor .
From equation (9) one can derive the fraction, , of the injected mechanical energy, , that is transformed into the X-rays. The X-ray production efficiency, , for the hard component associated with the star cluster plasma is
| (13) |
For clusters with it hardly exceeds 10% even for most compact clusters and decreases progressively for star clusters with smaller masses.
One can obtain the X-ray production efficiency, , for the soft bubble plasma from equation (12):
| (14) |
It is weakly dependent on the star cluster parameters, but is dependent on the density of the ISM and becomes larger as the evolutionary time grows. was discussed by Cerviño et al. (2002) who finally chose an arbitrary value of , and by Smith et al. (2005) who collected published data for well-studied HII regions and superbubbles and concluded that for young objects , while for older clusters falls into the range 0.2% - 7%.
5.2 Comparison with nearby clusters
A comparison of the model predictions with observed X-ray luminosities requires that parameters of the embedded star cluster (half-light radius, , mass, and age, ) will be obtained from the optical or infrared observations and then be compared with the observed X-ray luminosity, temperature (which is proportional to the star cluster wind terminal speed, ) and metallicity of the X-ray plasma. The full set of required parameters are available only for a restricted sample of nearby clusters. Below we confront our model (equation 9) with several nearby young stellar clusters. In contrast with Stevens & Hartwell (2003), we will use for the comparison an observed temperature of the X-ray plasma which is an appropriate parameter for distant clusters, and will avoid to use the mean weighted terminal speed derived from the analysis of the individual massive stars, embedded members of the cluster.
5.2.1 The sample of clusters
A) NGC 3603. This cluster appears to be one of the densest and more massive cluster known in our Galaxy. Within a 1 pc radius NGC 3603 reveals a remarkable similarity in the central density and stellar density distribution of R136, the dense core of 30 Dor in the Large Magellanic Cloud (Moffat et al. 1994). However outside pc, the stellar density in NGC 3603 decreases sharply whereas the stellar density in 30 Dor remains to decrease with a similar slope to larger radii. Malumuth & Heap (1994) measured the ionizing flux from 30 Dor as a function of distance from the cluster center. They found that the number of ionizing photons from the inner 1 pc () region is N s-1 (see their figure 16). This corresponds to a cluster if compared with Leitherer & Heckman (1995) evolutionary synthesis model and approximately two times smaller than the value obtained by Brandl et al. (1996) for the inner region of 30 Dor. Because of the identical mass distribution in R136 and NGC 3603 inside the inner 1 pc radius, we adopt value as a total mass of the NGC 3603 cluster. Sung & Bessel (2004) used optical color-magnitude diagrams for massive members of NGC 3603 and concluded that the age of the cluster is Myr. The X-ray emission from the cluster has been studied by Moffat et al. (2002) who detected around 40 point-like X-ray sources definitely associated with the star cluster and a local diffuse emission most probably associated with the hot plasma inside the star cluster and with the free wind region. Moffat et al. (2002) concluded that approximately 20% ( erg s-1) of the total erg s-1 X-ray luminosity in the keV band is associated with the local diffuse component of solar abundance and the best fitted temperature of keV at the core and keV (which is close to the temperature at the star cluster edge that is expected from the star cluster wind model) in the outer region.
B) Arches cluster. The Arches cluster is another young ( Myr; Figer et al. 1999a) and very compact ( pc; Figer et al. 1999b) Galactic cluster. The mass of the cluster has been estimated by Figer et al. (1999a) who extrapolated the observed number of massive stars down to the low cutoff mass limit. If a 1 low mass cutoff is adopted, the star cluster mass would be . The X-ray luminosity from the cluster was first detected by Yusef-Zadeh et al. (2002) who revealed within the volume occupied by the star cluster two point-like sources embedded into a more extended (down to a 1.2-1.8 pc radius) X-ray halo. Law & Yusef-Zadeh (2004) found that the observed X-ray emission may be equally well fitted with an overabundant, , one or two temperature thermal model, or with the one temperature plus power-law model with of the flux attributed to the power-law component. The required temperature of the thermal plasma is around keV. The models give erg s-1 for the 0.5 - 8.0 keV energy band. Overall, the point-like sources inside the cluster contribute % to the total emission and the rest is distributed throughout the region with dimensions of approximately pc. This leads to the X-ray luminosity from the cluster plasma, erg s-1, that is slightly larger than that from the earlier estimates of Yusef-Zadeh et al. (2002; erg s-1). However the interpretation of the observed X-ray emission is ambiguous. The observed spectrum may also be fitted by the combined power law plus a 6.4 keV Gaussian component that models a fluorescent Fe Kα emission from a nearby molecular cloud. If this is the case, the contribution of the fluorescent component may confuse the estimated X-ray emission from the cluster plasma.
C) Quintuplet cluster. The Quintuplet cluster is the smallest and the oldest ( Myr, Figer et al. 1999b) one. The mass of the cluster is if a 1 low mass cutoff is used (Figer et al., 1999a), and the radius is about of 1 pc (Figer et al. 1999b). The X-ray emission from the cluster was detected by Chandra. After subtraction of the four point-like sources, the X-ray spectrum of the Quintuplet cluster is perfectly fitted by the thermal plasma model with the plasma temperature 2.4 keV at the star cluster center and a solar metallicity (Law & Yusef-Zadeh, 2004). The absorption-corrected halo emission in the keV energy band is erg s-1 (Law & Yusef-Zadeh, 2004). From the observed central temperature we derive a plasma temperature at the star cluster surface (see section 3), keV, and then use it as an input parameter for our model.
5.2.2 The comparison with model predictions
In order to compare the observed X-ray luminosities with that predicted by the star cluster wind model, we take an advantage of our equation (9) and combine it with input parameters obtained from the optical examination of the host clusters. To calculate the energy deposition rate, , provided by multiple stellar winds and supernovae explosions inside the cluster, we used a starburst synthetic model of Leitherer & Heckman (1995) and scale it with the star cluster mass. For a standard, , cluster we adopt a erg s-1 energy deposition rate before the first supernova explosion ( Myr), and approximately three times larger average value after the beginning of the supernovae era. The star clusters parameters, the observed and the calculated X-ray luminosities are collected in Table 1.
| Cluster | Age | Tobs | Z | |||||
|---|---|---|---|---|---|---|---|---|
| ( ) | (pc) | (Myr) | (erg s-1) | keV | (Z⊙) | (erg s-1) | (erg s-1) | |
| NGC 3603 | 1 | 1 | 1 | |||||
| Arches | 0.2 | 4 | ||||||
| Quintuplet | 1 | 1 |
The calculated X-ray luminosities are listed in the last column of Table 1. They agree with the observed values within a factor of 4 and do not show a systematic shift to the smaller of larger values relative to the observed luminosities. Clearly, the analysis of a larger sample of clusters that includes more massive objects is required to avoid uncertainties related with estimates of masses, ages and errors that result from the deviation of star distributions from the idealized initial mass function. For example, according to Leitherer & Heckman (1995) the energy input rate from a coeval star cluster changes sharply in a short time interval between Myr and Myr. A small mistake in the age estimate then may change the predicted X-ray luminosity within a factor of 10 or more. A smaller upper mass cutoff leads to the same uncertainty. For a cluster the relative dispersion of the observed X-ray luminosity due to the discreteness of the stellar population, , may reach (see Figure 2 from Cerviño et al. 2002), and thus the detected from a particular cluster may deviate from the mean value within a factor of . It seems therefore that more massive and more evolved star clusters are better candidates to compare with our model predictions.
Several more complications should be taken into consideration when comparing the results from equation (9) to the observed X-ray emission. In all young stellar clusters we have considered, the observed X-ray emission presents two components: a number of unresolved point-like sources, probably associated with the most luminous individual stars and local density enhancements resulting from the collisions of nearby stellar winds (see Ozernoy et al. 1997, and the results from Raga et al. 2001 and Rockefeller et al. 2004). The contribution from the point-like sources varies from in the Quintuplet cluster to in NGC 3603 and cannot be distinguished from the star cluster diffuse component in distant clusters.
After Myr the most massive stars leave the main sequence and explode as supernova. This results in the formation of X-ray binary systems. The high mass X-ray binaries (HMXBs) contain a relativistic remnant of the supernova explosion (a neutron star or a black hole) which captures and accretes a wind from the secondary (O or B type), massive star. To transform a gravitational energy into the X-ray emission effectively, it is essential that an accretion disc is formed or a very strong magnetic field is present (see, for example, van Bever & Vanbeveren, 2000, and references therein). Thus, it takes 4-5 Myr for the HMXBs to become active, depending on the upper mass limit occurring in the cluster. The HMXBs phase is restricted by the life-time of the massive secondaries and is typically few times yr. In the low mass X-ray binaries (LMXB) the optical component is a low mass post-main-sequence star that fills its Roche lobe. In the instantaneous star formation LMXBs become active at later times and certainly dominate the X-ray emission from older clusters for which the SNe activity has terminated and the X-ray emission from zones A and B has vanished. LMXBs are often detected in globular clusters (see, for example, Maccarone et al. 2003, who found that in the NGC 4472, approximately 40% of the LMXBs are associated with the globular clusters and approximately 4% of the globular clusters contain LMXBs). In the Milky Way around 10% of the LMXBs are associated with globular clusters which contain less than 1% of the stellar mass of the Galaxy (Liu et al., 2001). NGC 3603, Arches and Quituplet clusters are too young and do not contain active binaries.
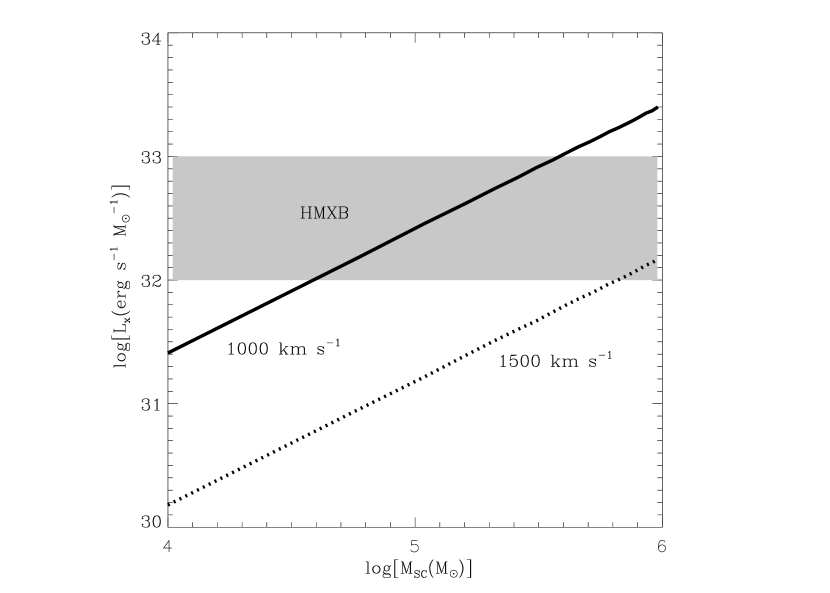
The population synthesis models for massive star clusters which take into consideration binary systems have been developed by a number of groups (see, for example, Iben et al. 1995; Mas-Hesse & Cerviño, 1999; Dalton et al. 1995). Van Bever & Vanbeveren (2000) have used such a model to calculate the X-ray luminosity from the binary population of instantaneous starbursts with different fractions of binaries at the birth of the cluster. The HMXB component begins to contribute to the X-ray emission after Myr. The normalized per one solar mass X-ray emission does not depend on the initial mass of the cluster and soon reaches a value that varies between erg s-1 M and erg s-1 M (see figures 1 and 2 from their paper).
In contrast to HMXBs, the normalized per unit solar mass X-ray luminosity from the thermalized star cluster plasma scales linearly with the star cluster mass:
| (15) |
where is the star cluster mass measured in units of . Figure 8 shows that for the most massive and compact young stellar clusters the X-ray luminosity of the thermalized star cluster plasma (zones A and B) may be comparable or even exceed that from the HMXBs.
6 Conclusions
We have developed a simple way of estimating the X-ray emission generated by super star clusters. The derived expression (equation 9) takes into consideration the intrinsic parameters of SSCs and their winds (). In particular, we have found that the expected X-ray luminosity from SSC is highly dependent on the star cluster wind terminal speed (), a quantity, related to the temperature of the hot thermalized plasma within the SSC volume, and scales quadratically with the star cluster mass. The proposed relation seems to be in reasonable agreement with parameters of nearby clusters and their detected X-ray emissions.
We have also compared the X-ray luminosity from the SSCs with the luminosity of the interstellar bubbles generated from the mechanical interaction of the star cluster winds with the ISM. We found that the soft component and the total X-ray emission are usually dominated by the superbubble plasma. The contribution from the SSC plasma may dominate only in the case of very massive ( ) and compact (few parsecs) star clusters evolving into a low density ISM. However the hard (2.0 keV - 8.0 keV) component of the X-ray emission is usually dominated by the hot compact regions associated with the SSCs. This implies that compact and massive star clusters should be detected as hard compact X-ray sources embedded into extended regions of soft diffuse X-ray emission.
On the other hand the comparison with the population synthesis models which take into consideration binary systems shows that the X-ray emission from the thermalized star cluster plasma normalized per unit stellar mass increases linearly with the mass of the cluster and may be comparable or even exceed that from the population of the HMXBs for the most compact and massive star clusters. Thus the thermalization of stellar winds and SNe ejecta, particularly in massive, young and compact super star clusters, may present an X-ray production that is comparable or even larger than that expected from the HMXB population.
References
- (1) Bisnovatyi-Kogan, G.S. & Silich, S.A. 1995, Rev. Mod. Phys. 67, 661
- (2) Cantó, J., Raga, A.C. & Rodríguez, L.F. 2000, ApJ, 536, 896
- (3) Cerviño, M., Mas-Hesse, J.M., Kunth, D. 2002, A&A, 342, 19
- (4) Chevalier, R.A. & Clegg, A.W. 1985, Nature, 317, 44
- (5) Chevalier, R.A.1992, ApJ, 397, L39
- (6) Chu, Y.-H., Chang, H.-W., Su, Y.-L. & Mac Low, M.-M. 1993, ApJ, 450, 157
- (7) Dalton, W.W. & Sarazin, C.L. 1995, ApJ, 440, 280
- (8) Figer, D.F., McLean, I.S. & Morris, M. 1999a, ApJ, 514, 202
- (9) Figer, D.F., Kim, S.S., Morris, M., Serabyn, E., Rich, M.R. & McLean, I.S. 1999b, ApJ, 525, 750
- (10) Ho, L. C. 1997, Rev.MexAA, Conf. Ser. 6, 5
- (11) Holtzman, J. A., Faber, S. M., Shaya, E. J. et al. 1992, AJ, 103, 691
- (12) Iben, J.I., Tutukov, A.V. & Yungelson, L.R. 1995, ApJS, 100, 217
- (13) Kaaret P., Alonso-Herrero, A., Gallagher, J.S., Fabbiano, G., Zezas, A. & Rieke, M.J. 2004, MNRAS, 348, L28
- (14) Koo, B.-C. & McKee, C.F. 1992, ApJ, 388, 93
- (15) Law, C., Yusef-Zadeh, F. 2004, ApJ, 611, 858
- (16) Leitherer, C. & Heckman, T.M., 1995, ApJS, 96, 9
- (17) Liu, Q.Z., van Paradijs, J. & van den Heuvel, E.P.J. 2001, A&A, 368, 1021
- (18) Maccarone, T.J., Kundu, A. & Zeff, S.E., 2003, ApJ, 586, 814
- (19) Mac Low, M.-M. & McCray, R. 1988, ApJ, 324, 776
- (20) Mas-Hesse, J.M. & Cerviño, M. 1999, in “Wolf-Rayet Phenomena in Massive Stars and Starburst Galaxies”, IAU Symp. 193, ASP, p. 550
- (21) Metz, J.M., Cooper, R.L., Guerrero, M.A., Chu, Y.-H., Chen, C.-H.R. & Gruendl, R.A. 2004, ApJ, 605, 725
- (22) Moffat, A.F.J., Corcoran, M.F., Stevens, I.R. et al. 2002, ApJ, 573, 191
- (23) O’Connell, R.W. 2004, in ASP Conf. Ser. 322, The formation and evolution of massive young star clusters, eds. H.J.G.L.M. Lamers, L.J. Smith & A. Nota (San Francisco: ASP), p.551
- (24) Oskinova, L.M. 2005, MNRAS, 361, 679
- (25) Raymond, J.C. & Smith, B.W. 1977, ApJS, 35, 419
- (26) Rockefeller, G., Fryer, C.L., Melia, F. & Wang, D. 2005, ApJ, 623, 171
- (27) Silich, S., Tenorio-Tagle G. & Muñoz-Tuñón, C. 2003, ApJ, 590, 796 Paper I.
- (28) Silich, S., Tenorio-Tagle G. & Rodríguez González, A. 2004, ApJ, 610, 226, Paper II.
- (29) Silich, S., Tenorio-Tagle G., Terlevich, R., Terlevich, E. & Netzer, H. 2001, MNRAS, 324, 191
- (30) Smith, B.J., Struck, C. & Novak, M.A. 2005, AJ, 129, 1350
- (31) Smith, D.A. & Wang, Q.D. 2004, ApJ, 611, 881
- (32) Stevens, I.R. & Hartwell, J.M. 2003, MNRAS, 339, 280
- (33) Strickland, D.K. & Stevens, I.R. 2000, MNRAS, 314, 511
- (34) Summers, L.K., Stevens, I.R., Strickland, D.K. & Heckman, T.M. 2004, MNRAS, 351, 1
- (35) Tenorio-Tagle, G., Silich, S., Rodríguez-González, A. & Muñoz-Tuñón, C. 2005, ApJL, 628, L13
- (36) Van Bever, J. & Vanbeveren, D. 2000, A&A, 358, 462
- (37) Weaver, R., McCray, R., Castor, J., Shapiro, P. & Moore, R. 1977, ApJ, 218, 377
- (38) Yusef-Zadeh, F., Law, C., Wardle, M., Wang, Q.D., Fruscione, A., Lang, C.C. & Cotera, A. 2002, ApJ, 570, 665