11email: tohru@arcetri.astro.it, maiolino@arcetri.astro.it, marconi@arcetri.astro.it 22institutetext: National Astronomical Observatory of Japan, 2-21-1 Osawa, Mitaka, Tokyo 151-8588, Japan
Gas Metallicity in the Narrow-Line Regions of
High-Redshift Active Galactic Nuclei
We analyze optical (UV rest-frame) spectra of X-ray selected narrow-line QSOs at redshift found in the Chandra Deep Field South and of narrow-line radio galaxies at redshift to investigate the gas metallicity of the narrow-line regions and their evolution in this redshift range. Such spectra are also compared with UV spectra of local Seyfert 2 galaxies. The observational data are inconsistent with the predictions of shock models, suggesting that the narrow-line regions are mainly photoionized. The photoionization models with dust grains predict line flux ratios which are also in disagreement with most of the observed values, suggesting that the high-ionization part of the narrow-line regions (which is sampled by the available spectra) is dust-free. The photoionization dust-free models provide two possible scenarios which are consistent with the observed data: low-density gas clouds ( cm-3) with a sub-solar metallicity (), or high-density gas clouds ( cm-3) with a wide range of gas metallicity (). Regardless of the specific interpretation, the observational data do not show any evidence for a significant evolution of the gas metallicity in the narrow-line regions within the redshift range . Instead, we find a trend for more luminous active galactic nuclei to have more metal-rich gas clouds (luminosity-metallicity relation), which is in agreement with the same finding in the studies of the broad-line regions. The lack of evolution for the gas metallicity of the narrow-line regions implies that the major epoch of star formation in the host galaxies of these active galactic nuclei is at .
Key Words.:
galaxies: active – galaxies: evolution – galaxies: nuclei – quasars: emission lines – quasars: general1 Introduction
Understanding galaxy formation and evolution is one of the key astrophysical issues which is being pursued in this decade. The chemical composition of gas and stars in galaxies provides important information on this issue because it is a tracer of the star formation history in galaxies. A promising way to study the chemical evolution of galaxies is to measure their metallicity as a function of redshift. Since it is extremely hard and time-consuming to measure stellar metallicity of faint high- galaxies, because high quality spectra of shallow absorption features are required (but see, e.g., Pettini et al. 2000; Mehlert et al. 2002), investigating the gas metallicity through emission lines is a promising strategy. However, most of the available diagnostic emission lines associated with massive star formation (e.g., [Oii]3727, [Oiii]4959,5007, [Nii]6548,6583) are in rest-frame optical wavelength and thus are shifted into near infrared in high- galaxies. Accordingly, observations of these emission lines in high- galaxies are feasible only for relatively bright targets (e.g., Teplitz et al. 2000; Pettini et al. 2001; Tecza et al. 2004; Shapley et al. 2004). Instead, active galactic nuclei (AGNs) exhibit bright emission lines at rest-frame UV wavelengths, which can be used to investigate the gas metallicity even in high- objects. Spectroscopic observations of high- QSOs suggest that gas metallicity in the broad-line region (BLR) tends to be much higher than solar (e.g., Hamann & Ferland 1992; Dietrich et al. 2003; Nagao et al. 2005) reaching as much as (Baldwin et al. 2003). However it is not clear how the gas metallicity inferred from the broad lines is related to the chemical properties of the host galaxies, since the broad lines of AGNs sample only a very small region of galactic nuclei ( 1 pc; e.g., Kaspi et al. 2000), which may have evolved more rapidly than the host galaxy.
An alternative possibility is to use narrow line AGNs. In this paper we focus on narrow-line AGNs at high redshift, in particular on high- radio galaxies (HzRGs) and type-2 QSOs (QSO2s). The nuclei of narrow-line AGNs are thought to be obscured by edge-on optically thick tori (e.g., Antonucci & Miller 1985; Antonucci 1993; Cohen et al. 1999). Since the broad emission lines and the strong ionizing continuum are blocked by this “natural coronagraph”, we can investigate narrow UV emission lines whose spatial extension is roughly comparable to that of the host galaxies ( pc), without any complex deblending of broad and narrow components for the emission lines. Although narrow emission lines of HzRGs are often strongly influenced by a radio jet in terms of kinematics and morphological properties (e.g., McCarthy et al. 1991; Baum & McCarthy 2000), the ionization mechanism is mostly dominated by photoionization, not by shock ionization (e.g., Villar-Martin et al. 1997; Allen et al. 1998; Iwamuro et al. 2003). Therefore, we can obtain information on the gas metallicity of the narrow-line regions (NLRs) by comparing the observed emission-line flux ratios with the predictions of photoionization models. By comparing the NLRs of HzRGs and QSO2s with low- type 2 AGNs (Seyfert 2 galaxies; Sy2s), we can investigate whether the gas metallicity evolves on a cosmological timescale or not.
By focusing on the flux ratio of Nv1240/Civ1549 that is one of the most frequently used metallicity diagnostics for AGNs (generally for the BLR; e.g., Hamann & Ferland 1992, 1999; Dietrich et al. 2003), De Breuck et al. (2000) reported gas metallicity of HzRGs in the range or possibly even much higher (see also van Ojik et al. 1994; Vernet et al. 2001). They also claimed a metallicity evolution within their sample from to : the gas metallicity of all HzRGs at in their sample is , at variance with their sample at . Norman et al. (2002) reported that the strong Nv1240 emission of a X-ray selected high- QSO2 found in Chandra Deep Field South (CDFS; Giacconi et al. 2002; Rosati et al. 2002), CDFS-202 (), is consistent with a super-solar metallicity of its NLR, and more specifically . However, since the Nv1240 emission becomes very weak for metal-poor gas (i.e., ), only upper-limit fluxes on Nv1240 are available for the majority of the HzRG sample in De Breuck et al. (2000), which makes the investigation of the metallicity evolution difficult. An additional issue is that Iwamuro et al. (2003), based on rest-frame optical spectra obtained by sensitive near-infrared spectroscopy, recently reported that HzRGs at tend to show sub-solar metallicities (), significantly lower than values reported by De Breuck et al. (2000). Although it is clear that improved and additional observational data for a larger sample of HzRGs are required to reconcile this disagreement, both more sensitive measurements of Nv1240 and deeper near-infrared spectroscopic data are very tough to obtain for HzRGs and QSO2s.

To tackle these issues, it is useful to find alternative metallicity diagnostics that consists only of strong UV emission lines. In this paper, we investigate strong UV emission lines for HzRGs, QSO2s, and Sy2s. By comparing the compiled data with photoionization model calculations, we discuss the evolution of the gas metallicity of the NLRs in AGNs, from high- to the local universe, using only strong UV emission lines. The compiled data and our photoionization model calculations are presented in §2 and §3, respectively. We compare the observational data with the model results, discuss the properties of NLR gas clouds and the implications for the chemical evolution of AGNs in §4. A brief summary is given in §5.
| Object | Redshift | Ly1216a | Nv1240a | Civ1549a | Heii1640a | Ciii]1909a |
|---|---|---|---|---|---|---|
| CDFS–027 | 3.064 | 12.60.7 | 2.50.7 | 6.40.5 | 2.30.9 | 2.9d |
| CDFS–031 | 1.603 | — | — | 24.11.4 | 13.31.2 | 10.31.3 |
| CDFS–057 | 2.562 | 112.21.3 | 8.41.4 | 17.80.8 | 7.60.8 | 13.30.9 |
| CDFS–112ab | 2.940 | 1756 | 226 | 306 | 196 | 156 |
| CDFS–153 | 1.536 | — | — | 25.51.4 | 6.21.1 | 13.71.6 |
| CDFS–202 | 3.700 | 78.11.0 | 26.81.1 | 38.91.2 | 19.71.5 | 12.9d |
| CDFS–263b | 3.660 | 70.90.7 | 4.60.7 | 15.50.8 | 4.0d | 7.6d |
| CDFS–531 | 1.544 | — | — | 22.01.4 | 17.41.5 | 14.41.5 |
| CDFS–901 | 2.578 | 37.10.6 | 6.50.8 | 19.71.0 | 2.8d | 3.30.9 |
| CXO 52c | 3.288 | 1894 | 61.2e | 352 | 172 | 212 |
-
a
Fluxes are in units of 10-18 ergs s-1 cm-2.
-
b
FITS file not available for this source at the CDFS web site at the time of writing of this paper; the fluxes and their errors were estimated from GIF file on the web site.
-
c
Data taken from Stern et al. (2002).
-
d
3 upper-limit flux.
-
e
The error was assigned by us; see text.
2 Data
2.1 Data compilation
To investigate the possible chemical evolution of the NLRs in AGNs, we compiled the fluxes of some strong UV emission lines, Nv1240, Civ1549, Heii1640 and Ciii]1909. We focus only on these emission lines since fainter lines were measured only in a few type 2 AGNs. The details of the data compilation for each population of objects are given below.
(1) HzRGs: We used emission-line fluxes of HzRGs given by De Breuck et al. (2000), who compiled emission-line flux data of 165 radio galaxies from the literature. This sample contains 114 HzRGs at for which we can investigate the rest-frame UV spectra. We assigned the error on each line flux by checking the original references. For objects whose emission-line flux errors are not given in the original reference, we assigned a 20% error for each emission line. For emission-line fluxes measured with a statistical significance lower than 3, we adopted 3 upper-limit values instead of the measured fluxes. We also referred to the measurements of emission-line flux data of 9 HzRGs presented by Vernet et al. (2001). Although these HzRGs are included in the sample of De Breuck et al. (2000), we adopted the data of Vernet et al. (2001) of these 9 HzRGs because of the higher signal-to-noise ratios of the Vernet et al. (2001) data. Accordingly, the number of HzRGs whose fluxes of Civ1549, Heii1640 and Ciii]1909 are measured is 51 in total, of which two objects are lower- or upper-limit data.
(2) QSO2s: We used the spectra of X-ray selected QSO2s in CDFS recently obtained by Szokoly et al. (2004). Among 288 objects whose spectra were obtained with VLT/FORS by Szokoly et al. (2004), 51 objects are at . From these 51 objects, we selected 9 objects with a high quality spectrum that shows only narrow emission lines. All of these 9 objects (distributed at ; see Table 1) show strong Civ1549 emission which indicates, along with their X-ray emission, that these objects harbor an AGN (i.e., not starburst galaxies). We obtained spectral data of these 9 objects from the CDFS web site111http://www.mpe.mpg.de/CDFS/data/, and measured their emission-line fluxes and errors by means of a simple Gaussian fitting. The measured fluxes are given in Table 1. In this table fluxes of Ly are also given for the reader’s convenience, although we do not use the Ly flux in the analysis and discussion in this paper. The reported errors do not take any possible systematic errors into account. In addition to the nine QSO2s in the CDFS, we also used the emission-line flux data of CXO J084837.9+445352 (CXO 52), a QSO2 at found by Stern et al. (2002). Since the flux error for Nv1240 is not given by Stern et al. (2002), we assigned a 20% error for this line as for the HzRGs mentioned above. Therefore the number of QSO2s is 10 in total.
(3) Sy2s: We compiled the flux data of 9 Sy2s observed by IUE from the literature. The object name, the compiled flux data and their errors, and the reference are given in Table 2. For what concerns the data obtained by Thuan (1984), note that they reported UV emission-line fluxes also for IC 5135, not only for NCG 5135; however, we do not include the data of IC 5135 because the signal-to-noise ratio of the IC 5135 data is too low (see Thuan 1984 for details). For fluxes with no information on their errors in the reference, we assigned a 20% error as for the HzRGs and QSO2s (except for low-accuracy measurements explicitly mentioned in the reference for which we assigned a 30% error). All of the targets are at and thus we regard this sample as representative of the NLRs in the local universe.
| Object | Redshift | Ly1216a | Nv1240a | Civ1549a | Heii1640a | Ciii]1909a | Ref.b |
|---|---|---|---|---|---|---|---|
| NGC 1068 | 0.004 | 713100 | 22441 | 52080 | 18729 | 24035 | 1 |
| NGC 4507c | 0.012 | 75.615.1 | 5.21.0 | 13.52.7 | 5.61.1 | 5.81.2 | 2 |
| NGC 5135c | 0.014 | 59.011.8 | 1.10.2 | 4.10.8 | 10.02.0 | — | 3 |
| NGC 5506c | 0.006 | — | — | 4.51.4d | 2.00.6d | 3.60.7 | 2 |
| NGC 7674 | 0.029 | 47.020.3 | — | 11.43.3 | 5.11.5 | 7.92.7 | 4 |
| Mrk 3 | 0.014 | 6419d | 31d | 212 | 91 | 91 | 5 |
| Mrk 573 | 0.017 | 151.222.7 | 6.30.9 | 29.04.3 | 12.61.9 | 8.81.3 | 6 |
| Mrk 1388 | 0.021 | — | — | 8.31.2 | 3.80.6 | 3.60.5 | 6 |
| MCG –3–34–64c | 0.017 | 5611 | 51 | 143 | 102 | 71 | 7 |
-
a
Fluxes are in units of 10-14 ergs s-1 cm-2.
-
b
References. — (1) Snijders et al. 1986, (2) Bergeron et al. 1981, (3) Thuan 1984, (4) Kraemer et al. 1994, (5) Malkan & Oke 1983, (6) McAlpine 1988, (7) De Robertis et al. 1988.
-
c
20% of the line flux is assigned as the flux error.
-
d
30% of the line flux is assigned as the flux error.
The redshift distributions of the HzRG and the QSO2 samples are shown in Figure 1. The compiled data are not corrected for Galactic and intrinsic dust reddening. Possible effects of the reddening on our analysis are discussed later (§§2.2). Since most of these data were obtained in low-dispersion spectroscopy, the measured Ciii] flux may be contaminated by the Siiii]1883,1892 flux. However, the contribution of Siiii] is thought to be small and we will discuss this issue further in §§3.2.
2.2 Compilation results
In Figure 2a the compiled line flux ratios are plotted on the Civ1549/Heii1640 versus Ciii]1909/Civ1549 diagram. The Civ1549/Heii1640 flux ratio is expected to be sensitive to the gas metallicity. This is because the gas temperature decreases when the metallicity increase in low-density ( cm-3) gas clouds (e.g., Ferland et al. 1984) and thus the collisional excitation of Civ is gradually suppressed, while the Heii1640 luminosity is basically proportional to the volume of the doubly-ionized helium region and thus rather insensitive to the gas metallicity. The Ciii]1909/Civ1549 ratio is instead expected to be sensitive to the ionization degree of gas clouds. Therefore, Ciii]1909/Civ1549 can be used to check any dependence of Civ1549/Heii1640 on the ionization state of the gas. Summarizing, a diagnostic diagram that consists of these two flux ratios is expected to be useful to estimate the properties of NLRs only with strong UV emission lines, as discussed more extensively in §3 and §4 (see also Groves et al. 2004).
In Figure 2 we also show the effect of the dust extinction on the line ratios, for the case of mag. An extinction curve described by Cardelli et al. (1989) is adopted. Since the dust extinction in typical type 2 AGNs is generally mag (see, e.g., Figure 5 of Nagao et al. 2001b), we conclude that the effect of dust extinction on our analysis and discussion is not important.
As clearly shown in Figure 2a, there is no significant difference in these two flux ratios between the high- QSO2 sample and the local Sy2 sample. Some HzRGs show similar flux ratios to QSO2s and Sy2s, although other HzRGs show lower Civ1549/Heii1640 and higher Ciii]1909/Civ1549 than QSO2s and Sy2s. The logarithmically averaged ratios for these three populations (excluding upper-limits and lower-limits) are summarized in Table 3. These averaged flux ratios are also plotted in Figure 2b. The average flux ratios of HzRGs appears systematically different from those of QSO2s and Sy2s. To see the statistical significance of the differences in the line flux ratios between HzRGs and QSO2s – Sy2s, the Kolmogorov-Smirnov (K-S) statistical test is applied to the data, discarding upper-limits and lower-limits. The null hypothesis is that the flux ratios (Civ1549/Heii1640 and Ciii]1909/Civ1549) of HzRGs () and QSO2s – Sy2s () come from the same underlying population. The derived K-S probabilities are for Civ1549/Heii1640 and for Ciii]1909/Civ1549. These results suggest that the difference in the Civ1549/Heii1640 ratio is statistically significant while the difference in the Ciii]1909/Civ1549 ratio is statistically marginal.

When focusing only on HzRGs, an anti-correlation between the emission-line flux ratios of Civ1549/Heii1640 and Ciii]1909/Civ1549 is apparent in Figure 2a. To examine the statistical significance of this correlation, the Spearman rank-order test is applied to the HzRG data, discarding upper-limits and lower-limits. The derived Spearman rank-order correlation coefficient () and its statistical significance , which is the probability of the data being consistent with the null hypothesis that the flux ratios are not correlated, are and (). This indicates that the apparent anti-correlation between Civ1549/Heii1640 and Ciii]1909/Civ1549 of HzRGs is statistically significant. This significance does not disappear by including QSO2s and Sy2s: the corresponding Spearman rank-order correlation coefficient and its statistical significance become and (). This anti-correlation has also been shown by Allen et al. (1998) for a smaller HzRG sample. We will discuss the interpretation of this trend in §§4.1.

| Sample | Numbera | C IV / He II | C III] / C IV |
|---|---|---|---|
| HzRG | 49 | 1.42 | 0.67 |
| QSO2 | 6 | 2.04 | 0.57 |
| Sy2 | 8 | 2.20 | 0.49 |
-
a
Number of objects for which both of the flux ratios of Civ1549/Heii1640 and Ciii]1909/Civ1549 were measured. Objects with a lower-limit or upper-limit data are not included.
3 Photoionization models
To provide a quantitative interpretation of Figure 2, we carried out photoionization model calculations. The method and the results are given below.
3.1 Model method

We performed model runs by using the public photoionization code Cloudy version 94222 We confirmed for some models that the results of the calculations do not change significantly if using Cloudy version 96 instead of version 94; the difference is % at maximum. (Ferland 1997; Ferland et al. 1998). For simplicity, we assumed uniform gas density clouds with a plane-parallel geometry, and we examined both dust-free and dusty cases. For the models with dust, Orion-type graphite and silicate grains (Baldwin et al. 1991; Ferland 1997) were included. Note that the calculations are not sensitive to the assumption on the grain composition (§§4.1.2). Effects of dust grains on the depletion of heavy elements and on the radiative transfer were consistently treated by Cloudy. The parameters for the calculations are (1) the spectral energy distribution (SED) of the photoionizing continuum radiation; (2) the hydrogen density of a cloud (); (3) the ionization parameter (), i.e., the ratio of the ionizing photon density to the hydrogen density at the irradiated surface of a cloud; (4) the column density of a cloud (); and (5) the elemental composition of the gas.
As for the SED of the ionizing photons, two extreme cases of SED were investigated. The first one is a SED with a weak UV thermal bump, which matches the HST QSO templates (Zheng et al. 1998; Telfer et al. 2002; see Marconi et al. 2004 for more details). The second one has a strong UV thermal bump to match the QSO template by Scott et al. (2004). Both SEDs have the same optical to X-ray ratio (Zamorani et al. 1981), i.e., (see Elvis et al. 2002), but different slopes in the energy range of ; for the SED with a strong UV bump and for the SED with a weaker UV bump, where . See Figure 3 for a graphical representation of the two SEDs. Just for the readers’ convenience, in Figure 3 we also show the SED deduced by Mathews & Ferland (1983) that has been sometimes used for photoionization model calculations (see Ferland 1997), although we do not use this SED in this work.

We investigated gas clouds with gas densities cm-3, cm-3, cm-3 and cm-3, and ionization parameters , as presented in §§3.2. The column density was determined by the criterion that the calculations for dust-free gas clouds were stopped when the temperature falls to 100K, below which the gas does not contribute significantly to the observed optical emission line spectra. Although this lower-limit temperature is much lower than other calculations for ionization-bounded clouds in the literature, this criterion is necessary to calculate low-density dust-free gas clouds with a high metallicity because the equilibrium temperature of such gas clouds is sometimes lower than 1000K, as it will be shown later (see also Ferland et al. 1984). For models with dust grains, the stopping temperature was set to 2000K. This is because the gas temperature does not decrease efficiently in partially-ionized regions when clouds contain dust, due mainly to the depletion of heavy elements (i.e., coolants) and to the heating by photoelectrons emitted from grains (see, e.g., Shields & Kennicutt 1995 for details). Note that the results of our calculations are not sensitive to the lower-limit temperature because we are concerned only in relatively high-ionization emission lines, which arise in fully-ionized regions, and not within partially-ionized regions. For the chemical composition of dust-free gas clouds, we assumed that the all metals scale by keeping solar proportions except for nitrogen, that scales as the square power of other metal abundances, because nitrogen is a secondary element (see, e.g., Hamann et al. 2002). Here the solar elemental abundances are taken from Grevesse & Anders (1989) with extensions by Grevesse & Noels (1993). For dusty gas clouds, we assumed the depleted gas-phase elemental abundance ratios by adopting the depletion factors given by Ferland (1997).
3.2 Model results
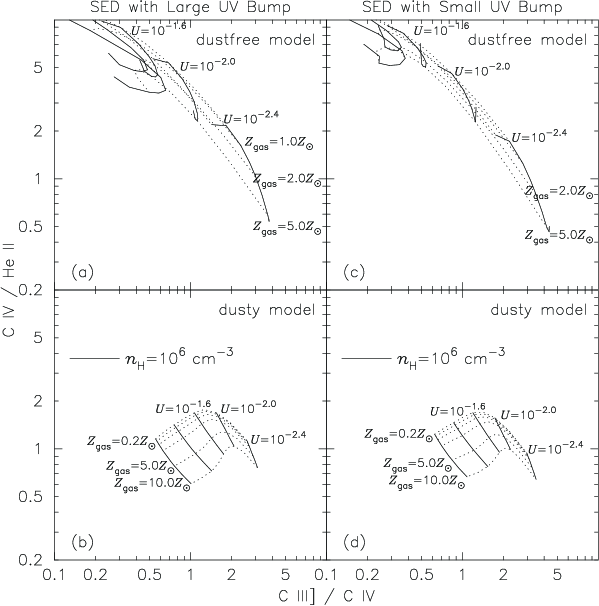
In Figures 4, 5 and 6, the results of the model calculations are plotted on a diagram with Civ1549/Heii1640 and Ciii]1909/Civ1549, for both dust-free and dusty cases. Models for low-density gas clouds ( cm-3 and cm-3) are presented in Figure 4, those for high-density gas clouds ( cm-3) are presented in Figure 5, and those for very high-density gas clouds ( cm-3) are presented in Figure 6. For low-density cases, the difference of the model results between those with cm-3 and those with cm-3 is very small.
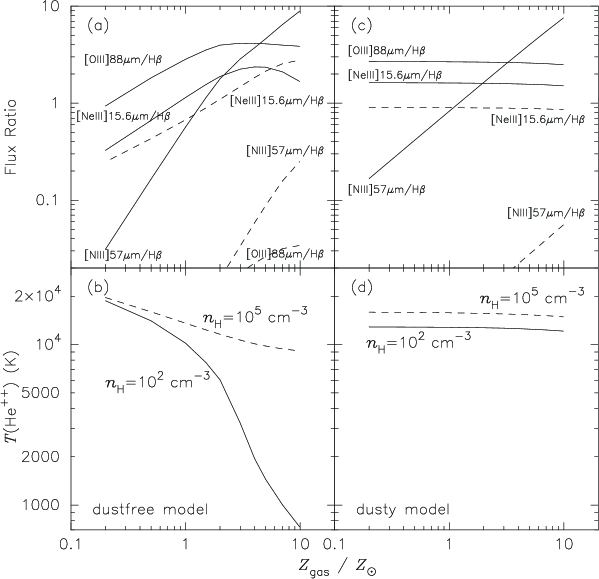
For low-density gas clouds without dust grains, the flux ratio of Civ1549/Heii1640 strongly depends on the gas metallicity while Ciii]1909/Civ1549 allows to remove the degeneracy with , and thus the diagram with Civ1549/Heii1640 and Ciii]1909/Civ1549 is a good metallicity diagnostics (Figures 4a and 4c). The strong variation of Civ1549/Heii1640 with metallicity is due to the strong dependence of Civ1549 emissivity on the gas temperature, which decreases rapidly with metallicity (in dust-free clouds) due to an efficient cooling by infrared fine-structure lines (e.g., Ferland et al. 1984). The metallicity dependences of some infrared fine-structure lines ([Oiii]88m, [Niii]57m and [Neiii]15.6m) and gas temperature for gas clouds with cm-3 are shown in Figure 7. Here we adopt the averaged temperature over doubly-ionized helium regions as a representative temperature in photoionization equilibrium. The fluxes of the fine-structure lines plotted in Figure 7 are normalized to the H flux, because the H flux scales with the ionization photon flux.
The metallicity dependence of Civ1549/Heii1640 in dust-free gas clouds becomes smaller at higher gas densities (Figures 5a, 5c, 6a, and 6c). This is mainly due to the decreased cooling efficiency of infrared fine-structure lines, which are suppressed in high-density gas clouds owing to collisional de-excitation (Figure 7). However, even when gas clouds with cm-3 are concerned, the diagram with Civ1549/Heii1640 and Ciii]1909/Civ1549 maybe useful to constrain the gas metallicity, because the Civ1549/Heii1640 ratio depends on metallicity even at cm-3, although the inferred metallicity is different depending on the specific gas density (Figures 5a and 5c). The Civ1549/Heii1640 versus Ciii]1909/Civ1549 diagram is no more useful when the gas density is very high, cm-3 (Figures 6a and 6c). The metallicity dependence of the Civ1549/Heii1640 has almost disappeared at this gas density. However, as shown later, the very high-density models ( cm-3) do not provide a good description of the observed data.
Gas clouds with dust grains show only a very small dependence of Civ1549/Heii1640 on metallicity (Figures 4b, 4d, 5b, 5d, 6b, and 6d). This is mainly because the equilibrium temperature of gas clouds does not drop off significantly when gas metallicity is high, thanks to the presence of dust grains (Figure 7d; see Shields & Kennicutt 1995 for more details). This result is almost independent of the adopted SED, gas density, and ionization parameter.
Figures 4, 5 and 6 indicate that the results with a large UV bump SED and with a small UV bump SED are similar. We thus conclude that SED effects on our analysis and discussion are negligible. In the following discussion, we only refer to the models with a small UV bump SED.
Note that the diagnostic diagram on which we are focusing has been investigated for various purposes in the past, since all the three lines (Heii1640, Civ1549 and Ciii]1909) are very strong and the wavelength separation is small (i.e., their ratios are little sensitive to dust extinction). Allen et al. (1998) investigated photoionization models and fast-shock models showing that the data of HzRGs on the Civ1549/Heii1640 versus Ciii]1909/Civ1549 diagram are consistent with photoionization, but are hard to be accounted for by fast-shock models. Groves et al. (2004) showed that this diagram is useful to examine the gas metallicity of NLRs and mentioned that HzRGs may have gas clouds with sub-solar metallicity. We use this diagram to analyze the gas metallicity of NLRs for a larger sample of high- narrow-line AGNs and to investigate the possible metallicity evolution of NLRs.
Finally we tackle the issue of whether the flux of Ciii]1909 is contaminated by the Siiii]1883,1892 emission significantly. The predicted ratio of Siiii]1883,1892/Ciii]1909 is plotted as a function of ionization parameter in Figure 8. Here we investigate gas clouds with (, ) = ( cm-3, 0.5 ), ( cm-3, 2.0 ), ( cm-3, 0.5 ), and ( cm-3, 2.0 ). For clouds with dust grains, the predicted ratio is 0.01 regardless of density, metallicity, and ionization parameter. The contribution of Siiii]1883,1892 is thus negligible when dusty clouds are concerned. For dust-free clouds, the predicted ratios are higher, i.e., 0.1. However, this is still significantly smaller than the measurement errors on Ciii]1909 fluxes. Therefore, we conclude that the contribution of Siiii]1883,1892 does not affect our results and discussion significantly.

4 Discussion
4.1 Comparison of the data with models
4.1.1 Shock models

Before comparing the data presented in §2 with the photoionization models presented in §3, we examine whether shock models can explain the observed flux ratios. In Figure 9, we compare the data of the HzRG, QSO2 and Sy2 samples with the shock models presented by Dopita & Sutherland (1996). Both pure shock-only models and shock plus precursor models are examined here: shock-only models with a shock velocity of 150 km s-1 500 km s-1 and with a magnetic parameter of 0 G cm-3/2 4 G cm-3/2, and shock plus precursor models with a shock velocity of 200 km s-1 500 km s-1. As shown in Figure 9, both pure shock-only models and shock plus precursor models underpredict the flux ratio of Ciii]1909/Civ1549 and thus cannot explain the observed data. This suggests that the main ionization mechanism of NLRs (or at least the Civ1549, Heii1640 and Ciii]1909 emitting regions in NLRs) is not associated with shocks, but is photoionization. Figure 9 also suggests that the difference in the flux ratios between HzRGs and QSO2s – Sy2s cannot be ascribed to shocks. Instead, a preferential contribution of shocks to QSO2s (not to HzRGs) is required if shocks are at the origin of the difference in the flux ratios. This requirement is in the opposite direction of the natural expectation (HzRGs should be more affected by shocks because of jets and expanding radio lobes). Therefore, the systematic difference in the flux ratios between HzRGs and QSO2s – Sy2s must be ascribed to causes other than shocks. This issue will be discussed further in §§4.1.3.
4.1.2 Dust grains
In Figure 10, we compare the observational data with the results of our photoionization model calculations, both with and without dust grains. Contrary to the dust-free models, the dusty models predict too narrow ranges of the Civ1549/Heii1640 flux ratio, regardless of the gas density (Figures 10b, 10d, and 10f). The Civ1549/Heii1640 flux ratio varies only in a factor of 3 at maximum even when the metallicity varies in the range . More importantly, the dusty models cannot explain values of Civ1549/Heii1640 larger than , which are instead observed in most sources. These results suggest that the Civ1549, Heii1640 and Ciii]1909 emitting regions in NLRs are dust-free. This is consistent with previous works that gas clouds in the high-ionization part of NLRs are dust-free (e.g., Marconi et al. 1994; Ferguson et al. 1997; Nagao et al. 2003). We verified that the effects of changing the grain composition (see Ferland 1997 for details) are less than 30% on the line flux ratios. We thus conclude that the models with dust grains are not appropriate to interpret the ratios of Civ1549/Heii1640 and Ciii]1909/Civ1549.
4.1.3 Ionization parameter
In the case of dust-free models, the models with low density ( cm-3 and cm-3) and high density ( cm-3) can successfully explain the observed range of flux ratios Civ1549/Heii1640 and Ciii]1909/Civ1549 (Figures 10a and 10c), while the very high-density models ( cm-3) cannot explain most of the observational data (Figure 10e). And we can deduce that cm-3 is an upper bound to the average NLR density. Both high-density models and low-density models suggest that the observational data are consistent with clouds with an ionization parameter for HzRGs and for QSO2s and Sy2s (Figures 10a and 10c). The model sequences with a constant ionization parameter have negative slope in the diagram of Civ1549/Heii1640 versus Ciii]1909/Civ1549, which is consistent with the observational trend described in §§2.2. Therefore the anti-correlation between Civ1549/Heii1640 and Ciii]1909/Civ1549 seen in HzRGs can be naturally explained by the wide range of the ionization parameter for HzRGs. Although the inferred range of ionization parameter is higher than the range estimated through rest-frame optical diagnostics (which use lower ionization emission lines) reported by some previous works (e.g., Ferland & Netzer 1983; Ho et al. 1993), it is consistent with previous estimates of the ionization parameter for the high-ionization parts in NLRs (e.g., Oliva et al. 1994; Murayama & Taniguchi 1998; Nagao et al. 2001a, 2001b).
4.1.4 Gas density and metallicity

As mentioned in the last subsection, photoionization models with cm-3 predict too narrow ranges of the flux ratios of Civ1549/Heii1640 and Ciii]1909/Civ1549 with respect to the observed ranges. This suggests that the typical density of the Civ1549, Heii1640 and Ciii]1909-emitting region in the NLR should be less than cm-3. Therefore, in the following discussion, we consider only the two models, i.e., the low-density models with cm-3 (note that the results are very similar if adopting cm-3) and the high-density models with cm-3.
As shown in Figures 10a and 10c, the estimated metallicity is different when different gas densities are adopted. Models with cm-3 suggest sub-solar metallicities (; Figure 10a) while models with cm-3 suggest a wide metallicity range (; Figure 10c). The “low-density and sub-solar metallicity” scenario appears to be consistent with the results reported by Iwamuro et al. (2003), while the “high-density with wide metallicity distribution” scenario appears in agreement with the results reported by De Breuck et al. (2000). Although some observational data with lower Civ1549/Heii1640 and Ciii]1909/Civ1549 ratios appear to deviate from the model predictions with cm-3 (Figure 10c), these deviations can be reconciled by introducing a moderate amount of extinction. Although the above two scenarios are hard to be discriminated only by means of the Civ1549/Heii1640 versus Ciii]1909/Civ1549 diagram, the actual situation may be intermediate between the two possible scenarios (§§4.2). Note that the absolute values of the inferred gas metallicity are not very accurate due to a density dependence of the flux ratio Civ1549/Heii1640 at high-densities ( cm-3). Nevertheless the diagnostic diagram in Figure 10 is useful if we are interested in the relative metallicity trends of NLR clouds, or in the evolution of gas metallicity, adopting the assumption that there are no strong correlations between gas density and redshift. Finally, we note that the density affects the inferred metallicity mostly at . At low metallicities () the models are less sensitive to the gas density (Figures 10a and 10c). This result is important, since it allows to use this diagnostic diagram to identify low metallicity NLRs, regardless of the gas density.
4.2 Comparison with the Nv1240 diagnostics
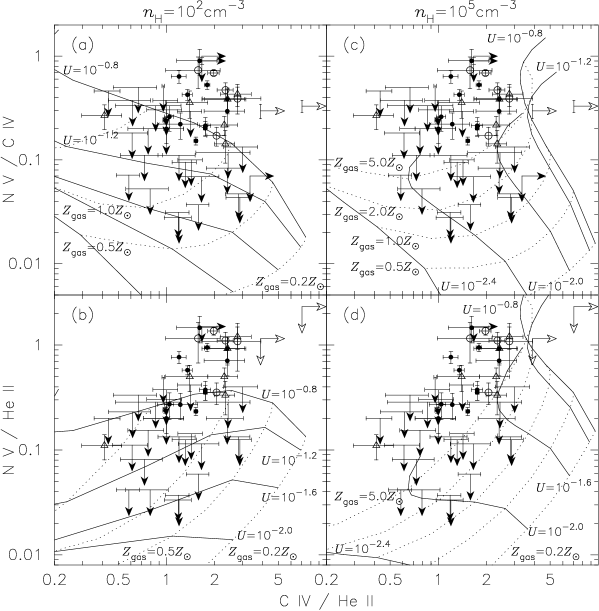
The gas metallicity of the BLR clouds in QSOs has been often investigated by using the diagnostic flux ratios of Nv1240/Civ1549 and Nv1240/Heii1640 (e.g., Hamann & Ferland 1992, 1999; Dietrich et al. 2003; Nagao et al. 2005). This method has been sometimes applied also to the NLR clouds (e.g., van Ojik et al. 1994; Villar-Martin et al. 1999; De Breuck et al. 2000; Vernet et al. 2001). Therefore it is interesting to compare our diagnostics with the Nv1240 diagnostics. In Figure 11, the observational data are compared with the photoionization models for cm-3 and cm-3 on the diagram of Nv1240/Civ1549 versus Civ1549/Heii1640, and Nv1240/Heii1640 versus Civ1549/Heii1640. Although high ratios of Nv1240/Civ1549 and Nv1240/Heii1640 are sometimes interpreted simply as a result of high metallicities, the low-density models ( cm-3) with a high metallicity predict not only high Nv1240/Civ1549 ratios but also very low Civ1549/Heii1640 ratios, in disagreement with the observed data (Figure 11a). This is mainly attributed to the decreased equilibrium gas temperature due to the efficient cooling by infrared fine-structure lines as investigated in §§3.2 (Figure 7). Moreover the low-density models predict Nv1240/Heii1640 0.4 when is concerned, which is also in disagreement with the observed data (Figure 11b). The high-density models ( cm-3), on the other hand, predict higher Civ1549/Heii1640 ratios than the low-density models owing to the suppressed cooling. Since the high-density models predict higher Civ1549/Heii1640 ratios than the observed values (Figures 11c and 11d), the typical gas density of (the high-ionization part of) the NLRs may be lower than cm-3.
Although the Nv1240-detected objects appear to have super-solar metallicity, the Nv1240 fluxes of more than half of the objects in the sample are upper-limits and they might be consistent with sub-solar metallicities. Summarizing, since Nv1240 becomes very weak (generally undetected) for NLRs, it is very difficult to investigate the metallicity evolution of the NLR based on the Nv1240 diagnostics.
| Sample | Numbera | C IV / He II | C III] / C IV |
|---|---|---|---|
| HzRG | 17 | 1.65 | 0.66 |
| HzRG | 20 | 1.27 | 0.69 |
| HzRG | 12 | 1.39 | 0.64 |
| HzRG 41.5 log (Heii)b 42.5 | 13 | 1.72 | 0.89 |
| HzRG 42.5 log (Heii)b 43.0 | 21 | 1.39 | 0.62 |
| HzRG 43.0 log (Heii)b 45.0 | 15 | 1.26 | 0.58 |
| HzRG total | 49 | 1.42 | 0.67 |
-
a
Number of objects for which both of the flux ratios of Civ1549/Heii1640 and Ciii]1909/Civ1549 were measured. Objects with a lower-limit or upper-limit data are not included.
-
b
Line luminosity of Heii1640 in units of ergs s-1, calculated from the line flux given by De Breuck et al. (2000).
4.3 Metallicity evolution of the NLRs in AGNs
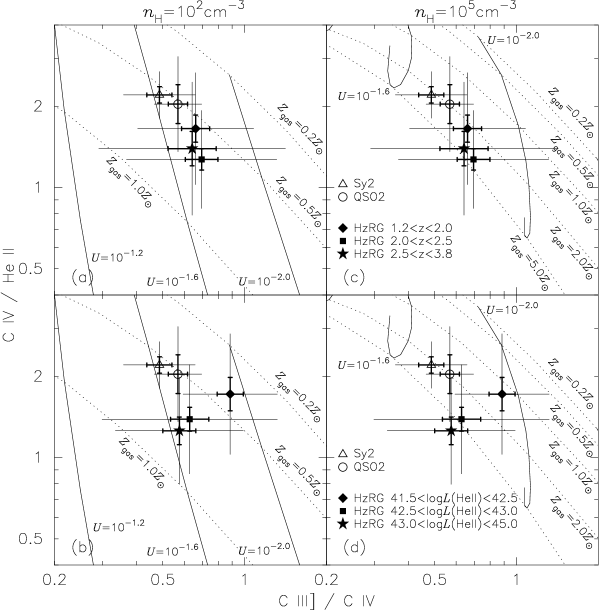
Now we discuss whether the gas metallicity of the NLRs in high- AGNs evolves as a function of redshift. We first focus only on the HzRG data, because HzRGs and QSO2s may have a different NLR properties, as discussed above. To investigate this issue, we divide the sample of objects having a measurement of both Civ1549/Heii1640 and Ciii]1909/Civ1549 (49 objects, discarding the objects with upper-limits or lower-limits) into three groups: (17 objects), (20 objects), and (12 objects). Note that most of the highest- sample are at and only two objects are at (Figure 1a). We calculate the logarithmically averaged flux ratios of Civ1549/Heii1640 and Ciii]1909/Civ1549 for these three groups. The results are given in Table 4 and plotted on the diagnostic diagram in Figures 12a and 12c. The thick errorbars give the estimated errors on the means. As clearly seen, no evolutionary tendency in the flux ratios within our HzRG sample is found. The higher- objects do not show significant metallicity decrease with respect to the lower- objects, at variance with the result reported by De Breuck et al. (2000). Although the absolute value of the gas metallicity derived from Figure 10 is subject to non-negligible uncertainties, as discussed in §§4.1.4, our conclusion is not affected by this issue in terms of relative gas metallicities, i.e., the gas metallicity in NLRs of HzRGs does not change significantly in the redshift range , or more conservatively, in the range (owing to the lack of objects at ).
Recently Nagao et al. (2005) reported that the gas metallicity of the BLR in QSOs with a given luminosity is independent of redshift in the range . The latter result is consistent with that obtained for the NLR metallicity of HzRGs presented in this paper. Nagao et al. (2005) also reported that the BLR metallicity is tightly correlated with the QSO luminosity (see also, e.g., Hamann & Ferland 1993, 1999). Motivated by this correlation between BLR metallicity and QSO luminosity, we have investigated whether the NLR metallicity is correlated with the AGN luminosity or not. However, it is very difficult to measure the luminosity of both AGNs and their host galaxies when type-2 AGNs are concerned. This is because the central engine is hidden by the dusty torus and because the broad-band photometric flux is largely attributed to the nebular emission, not only to the stellar continuum emission. We thus adopt the Heii1640 emission-line luminosity [(Heii)], as an indicator of the AGN luminosity. This assumption is based on the fact that the Heii1640 luminosity is simply proportional to the volume of the doubly-ionized helium region, which scales to the AGN luminosity. We calculate (Heii) from the Heii1640 flux by adopting a cosmology with (, , ) = (1.0, 0.3, 0.7) and = 70 km s-1 cm-1 Mpc-1. (Heii) is not corrected for the slit loss, which may be non-negligible for some cases. To investigate the dependence of the line flux ratios on (Heii), we divide HzRGs into three groups: 41.5 log (Heii) 42.5 (13 objects), 42.5 log (Heii) 43.0 (21 objects), and 43.0 log (Heii) 45.0 (15 objects), where (Heii) is in units of erg s-1. The logarithmically averaged flux ratios and the RMS’s of Civ1549/Heii1640 and Ciii]1909/Civ1549 for these three groups are given in Table 4, and are plotted on the diagnostic diagram in Figure 12b and 12d. The thick errorbars give the errors on the means. As a result, we find a systematic trend in our HzRG sample that the HzRGs with larger (Heii) (i.e., more luminous AGNs) tend to have lower Civ1549/Heii1640 and Ciii]1909/Civ1549 flux ratios. This result is consistent to the interpretation that the NLR in more luminous HzRGs have higher metallicity gas clouds. This “luminosity-metallicity relation” for the NLR in HzRGs is in agreement with the same relation seen for the BLRs in high- QSOs.
The similarity of the flux ratios between the QSO2 sample and the Sy2 sample may suggest that the gas metallicity of non-radio-selected AGNs does not evolve significantly from to the local universe. However it should be kept in mind that there is a large difference in the absolute luminosity between the Sy2 sample and the QSO2 sample. This result should be interpreted in the sense that the NLR metallicity is not significantly different between faint local AGNs and bright high- () AGNs. If the luminosity-metallicity relation discussed above is taken into account, this result might imply a metallicity evolution of the NLR with a given luminosity from high- to . Surveys and spectroscopic studies on type-2 faint AGNs at high- are required to investigate this issue further.
It has been observationally confirmed that QSOs including ratio galaxies tend to reside in massive elliptical galaxies at least in the local universe (e.g., McLure et al. 1999; Dunlop et al. 2003; Floyd et al. 2004) and probably also in the high- universe (e.g., Falomo et al. 2005; Kuhlbrodt et al. 2005). Our results suggest that the main star-formation event in such massive host galaxies is completed. This picture is consistent with the recent findings of massive evolved galaxies at (e.g., Cimatti et al. 2004; McCarthy et al. 2004; Labbé et al. 2005; Saracco et al. 2005). The non-evolution of the gas metallicity of the NLR in our sample suggests that the epoch of major chemical enrichment in the host galaxies of QSO2s and HzRGs must have occurred at . If the minimum timescale for significant enrichment of carbon (0.5 Gyr) is taken into account, the major epoch of star formation may be at .
Finally we briefly discuss a specific, interesting QSO2, CDFS-901 (Figure 2a). Although the emission-line spectrum of this object is hard to be explained by photoionization models as seen in Figure 10, it appears to be consistent with pure shock-only models as shown in Figure 9. This may suggest that the NLR of CDFS-901 is dominated by shocks. However, there is another possibility, that is CDFS-901 may be a narrow-line type-1 QSO, i.e., a brighter analogue of narrow-line Seyfert 1 galaxies (NLS1s). If the emission-line spectrum of CDFS-901 is not from its NLR but from its BLR, its very large Civ1549/Heii1640 ratio () is naturally explained, since this flux ratio is expected to be for BLRs (although its Ciii]1909/Civ1549 ratio 0.2 is very small for a BLR, e.g., Nagao et al. 2005). Since the X-ray spectral slope (hardness ratio) of this object was not measured due to the lack of photon statistics, its nature remains ambiguous based on the currently available data. This object is interesting because NLS1s are sometimes thought to be AGNs with super-massive black holes in their growing-up phase (e.g., Mathur 2000). If this object is a really high- analogue of NLS1s, it may be a very interesting target to investigate the evolution of AGN activities and supermassive black holes.
5 Summary
In order to investigate the possible metallicity evolution of NLR gas clouds in AGNs, we compiled the fluxes of Civ1549, Heii1640 and Ciii]1909 for a large sample of narrow-line AGNs, including HzRGs, high- QSO2s, and local Sy2s. Since all of these three emission lines are moderately strong even in the faint HzRGs and QSO2s, this approach enables us to investigate a large number of such objects. By comparing the compiled flux ratios with the results of our photoionization model calculations, we found the following results.
-
•
The observational data are inconsistent with the predictions of shock models, suggesting that the NLRs are mainly photoionized.
-
•
The photoionization models with dust grains predict too narrow ranges of flux ratios and in disagreement with the observed ranges, suggesting that the high-ionization part of NLRs (on which we focused in this work) is dust-free.
-
•
The ionization parameter of (the high-ionization parts of) NLRs is estimated to be for HzRGs and for QSO2s and Sy2s.
-
•
The photoionization models with cm-3 cannot explain the observational data, suggesting that the typical gas density is lower than cm-3.
-
•
There are two possible interpretations for the observed data: low-density gas clouds ( cm-3) with a sub-solar metallicity (), or high-density gas clouds ( cm-3) with a wide range of gas metallicity ().
-
•
Our method using only the flux ratios of Civ1549/Heii1640 and Ciii]1909/Civ1549 is particularly useful to examine relative difference in gas metallicity of NLR clouds, or to investigate possible metallicity evolution of NLRs, although the inferred absolute values of metallicity contain non-negligible uncertainties.
-
•
Regardless of the density, the proposed diagnostic diagram is useful to identify low metallicity NLRs ().
-
•
We find no evidence suggesting a significant evolution of the gas metallicity in the NLRs of HzRGs in the redshift range .
-
•
We find a systematic trend for more luminous AGNs to have more metal-rich NLRs (luminosity-metallicity relation), which is in agreement with the results from the studies on the BLRs.
-
•
The non-evolution of the gas metallicity of the NLRs implies that the major epoch of star formation in the host galaxies is at .
Acknowledgements.
We thank T. Murayama for useful comments and G. Ferland for providing the excellent photoionization code Cloudy to the public. TN acknowledges financial support from the Japan Society for the Promotion of Science (JSPS) through JSPS Research Fellowship for Young Scientists. RM acknowledges financial support from MIUR under grant PRIN-03-02-23.References
- (1) Allen, M. G., Dopita, M. A., & Tsvetanov, Z. I. 1998, ApJ, 493, 571
- (2) Antonucci, R. R. J. 1993, ARA&A, 31, 473
- (3) Antonucci, R. R. J., & Miller, J. S. 1985, ApJ, 297, 621
- (4) Baldwin, J. A., Ferland, G. J., Martin, P. G., et al. 1991, ApJ, 374, 580
- (5) Baldwin, J. A., Hamann, F., Korista, K. T., et al. 2003, ApJ, 583, 649
- (6) Baum, S. A., & McCarthy, P. J. 2000, AJ, 119, 2634
- (7) Bergeron, J., Maccacaro, T., & Perola, C. 1981, A&A, 97, 94
- (8) Cardelli, J. A., Clayton, G. C., & Mathis, J. S. 1989, ApJ, 345, 245
- (9) Cimatti, A., Daddi, E., Renzini, A., et al. 2004, Nature, 430, 184
- (10) Cohen, M. H., Ogle, P. M., Tran, H. D., Goodrich, R. W., & Miller, J. S. 1999, AJ, 118, 1963
- (11) De Breuck, C., Röttgering, H., Miley, G., van Breugel, W., & Best, P. 2000, A&A, 362, 519
- (12) De Robertis, M. M., Hutchings, J. B., & Pitts, R. E. 1988, AJ, 95, 1371
- (13) Dietrich, M., Hamann, F., Shields, J. C., et al. 2003, ApJ, 589, 722
- (14) Dunlop, J. S., McLure, R. J., Kukula, M. J., et al. MNRAS, 340, 1095
- (15) Dopita, M. A., & Sutherland, R. S. 1996, ApJS, 102, 161
- (16) Elvis, M., Risaliti, G., & Zamorani, G. 2002, ApJ, 565, L75
- (17) Falomo, R., Kotilainen, J. K., Scarpa, R., & Treves, A. 2005, A&A, 434, 469
- (18) Ferguson, J. W., Korista, K. T., & Ferland, G. J. 1997, ApJS, 110, 287
- (19) Ferland, G. J. 1997, Hazy: A Brief Introduction to Cloudy 94.00 (Lexington: Univ. Kentucky Dept. Phys. Astron.)
- (20) Ferland, G. J., Korista, K. T., Verner, D. A., et al. 1998, PASP, 110, 761
- (21) Ferland, G. J., & Netzer, H. 1983, ApJ, 264, 105
- (22) Ferland, G. J., Williams, R. E., Lambert, D. L., et al. 1984, ApJ, 281, 194
- (23) Floyd, D. J. E., Kukula, M. J., Dunlop, J. S., et al. 2004, MNRAS, 355, 196
- (24) Giacconi, R., Zirm, A., Wang, J., et al. 2002, ApJS, 139, 369
- (25) Grevesse, N., & Anders, E. 1989, in AIP Conf. Proc. 183, Cosmic Abundance of Matter, ed. C. J. Waddington (New York: AIP), 1
- (26) Grevesse, N., & Noels, A. 1993, in Origin and Evolution of the Elements, eds. N. Prantzos, E. Vangioni-Flam, & M. Casse (Cambridge Univ. Press), 15
- (27) Groves, B. A., Dopita, M. A., & Sutherland, R. S. 2004, ApJS, 153, 75
- (28) Hamann, F., & Ferland, G. J. 1992, ApJ, 391, L53
- (29) Hamann, F., & Ferland, G. J. 1993, ApJ, 418, 11
- (30) Hamann, F., & Ferland, G. J. 1999, ARA&A, 37, 487
- (31) Hamann, F., Korista, K. T., Ferland, G. J., Warner, C., & Baldwin, J. A. 2002, ApJ, 564, 592
- (32) Ho, L. C., Shields, J. C., & Filippenko, A. V. 1993, ApJ, 410, 567
- (33) Iwamuro, F., Motohara, K., Maihara, T., et al. 2003, ApJ, 598, 178
- (34) Kaspi, S., Smith, P. S., Netzer, H., et al. 2000, ApJ, 533, 631
- (35) Kraemer, S. B., Wu, C. -C., Crenshaw, D. M., & Harrington, J. P. 1994, ApJ, 435, 171
- (36) Kuhlbrodt, B., Örndahl, E., Wisotzki, L., & Jahnke, K. 2005, A&A, 439, 497
- (37) Labbé, I., Huang, J., Franx, M., et al. 2005, ApJ, 624, L81
- (38) Malkan, M. A., & Oke, J. B. 1983, ApJ, 265, 92
- (39) Marconi, A., Moorwood, A. F. M., Salvati, M., & Oliva, E. 1994, A&A, 291, 18
- (40) Marconi, A., Risaliti, G., Gilli, R., et al. 2004, MNRAS, 351, 169
- (41) Mathews, W. G., & Ferland, G. J. 1987, ApJ, 323, 456
- (42) Mathur, S. 2000, MNRAS, 314, L17
- (43) McAlpine, G. M. 1988, PASP, 100, 65
- (44) McCarthy, P. J., Le Borgne, D., Crampton, D., et al. 2004, ApJ, 614, L9
- (45) McCarthy, P. J., van Breugel, W., & Kapahi, V. K. 1991, ApJ, 371, 478
- (46) McLure, R. J., Kukula, M. J., Dunlop, J. S., et al. 1999, MNRAS, 308, 377
- (47) Mehlert, D., Noll, S., Appenzeller, I., et al. 2002, A&A, 393, 809
- (48) Murayama, T., & Taniguchi, Y. 1998, ApJ, 503, L115
- (49) Nagao, T., Marconi, A., & Maiolino, R. 2005, A&A, submitted
- (50) Nagao, T., Murayama, T., & Taniguchi, Y. 2001a, ApJ, 549, 155
- (51) Nagao, T., Murayama, T., & Taniguchi, Y. 2001b, PASJ, 53, 629
- (52) Nagao, T., Murayama, T., Taniguchi, Y., and Shioya, Y. 2003, AJ, 125, 1729
- (53) Oliva, E., Salvati, M., Moorwood, A. F. M., & Marconi, A. 1994, A&A, 288, 457
- (54) Pettini, M., Shapley, A. E., Steidel, C. C., et al. 2001, ApJ, 554, 981
- (55) Pettini, M., Steidel, C. C., Adelberger, K. L., Dickinson, M., & Giavalisco, M. 2000, ApJ, 528, 96
- (56) Rodríguez-Ardila, A., Pastoriza, M. G., & Donzelli, C. J. 2000, ApJS, 126, 63
- (57) Rosati, P., Tozzi, P., Giacconi, R., et al. 2002, ApJ, 566, 667
- (58) Saracco, P., Longhetti, M., Severgini, P., et al. 2005, MNRAS, 357, L40
- (59) Scott, J. E., Kriss, G. A., Brotherton, M., et al. 2004, ApJ, 615, 135
- (60) Shapley, A. E., Erb, D. K., Pettini, M., Steidel, C. C., & Adelberger, K. L. 2004, ApJ, 612, 108
- (61) Shields, J. C., & Kennicutt, R. C., Jr. 1995, ApJ, 454, 807
- (62) Snijders, M. A. J., Netzer, H., & Boksenberg, A. 1986, MNRAS, 222, 549
- (63) Stern, D., Moran, E. C., Coil, A. L., et al. 2002, ApJ, 568, 71
- (64) Szokoly, G. P., Bergeron, J., Hasinger, G., et al. 2004, ApJS, 155, 271
- (65) Tecza, M., Baker, A. J., Davies, R. I., et al. 2004, ApJ, 605, L109
- (66) Telfer, R. C., Zheng, W., Kriss, G. A., & Davidsen, A. F. 2002, ApJ, 565, 773
- (67) Teplitz, H. I., McLean, I. S., Becklin, E. E., et al. 2000, ApJ, 533, L65
- (68) Thuan, T. X. 1984, ApJ, 281, 126
- (69) van Ojik, R., Röttgering, H. J. A., Miley, G. K., et al. 1994, A&A, 289, 54
- (70) Vernet, J., Fosbury, R. A. E., Villar-Martin, M., et al. 2001, A&A, 366, 7
- (71) Villar-Martin, M., Tadhunter, C., & Clark, N. 1997, A&A, 323, 21
- (72) Zamorani, G., Henry, J. P., Maccacaro, T., et al. 1981, ApJ, 245, 357
- (73) Zheng, W., Kriss, G. A., Telfer, R. C., Grimes, J. P., & Davidsen, A. F. 1998, ApJ, 492, 855