Homogeneous Photometry V: The Globular Cluster NGC 4147111Based in part on archival observations made with ESO Telescopes at the La Silla and Paranal Observatory under programme ID 60.A-9050(A).,222This publication makes use of data products from the Two Micron All Sky Survey, which is a joint project of the University of Massachusetts and the Infrared Processing and Analysis Center/California Institute of Technology, funded by the National Aeronautics and Space Administration and the National Science Foundation.
Abstract
New BVRI broad-band photometry and astrometry are presented for the globular cluster NGC 4147, based upon measurements derived from 524 ground-based CCD images mostly either donated by colleagues or retrieved from public archives. We have also reanalysed five exposures of the cluster obtained with WFPC2 on the Hubble Space Telescope in the F439W and F555W ( and ) filters. We present calibrated color-magnitude and color-color diagrams. Analysis of the color-magnitude diagram reveals morphogical properties generally consistent with published metal-abundance estimates for the cluster, and an age typical of other Galactic globular clusters of similar metallicity. We have also redetermined the periods and mean magnitudes for the RR Lyrae variables, including a new c-type variable reported here for the first time. Our data do not show clear evidence for photometric variability in candidate V18, recently reported by Arellano Ferro et al. (2004 RMxAA 40, 209). These observations also support the non-variable status of candidates V5, V9, and V15.
The union of our light-curve data with those of Newburn (1957 AJ 62, 197), Mannino (1957 MmSAI 28, 285) and Arellano Ferro et al. (op. cit.) permits the derivation of significantly improved periods. The mean periods and the Bailey period-amplitude diagrams support the classification of the cluster as Oosterhoff I despite its predominantly blue horizontal branch. The number ratio of c- to ab-type RR Lyrae stars, on the other hand, is unusually high for an Oosterhoff I cluster.
The calibrated results have been made available through the first author’s web site.
Subject headings:
Astronomical databases: catalogs; Globular clusters: individual; Stars: variables1. INTRODUCTION
Many images of the globular cluster NGC 4147 = C1207+188 exist in public astronomical data archives around the world, primarily because it is included among the six photometric calibration fields defined by the “KPNO Video Camera/CCD Standards Consortium” (Christian et al. 1985). Yet, surprisingly few detailed studies of its color-magnitude diagram and variable-star properties are available in the literature.
According to the summary of cluster properties compiled by Harris (1996)111 http://physwww.physics.mcmaster.ca/%7Eharris/mwgc.dat (Revision: February 2003), the cluster lies at the position 1006s.2, 3231′′(J2000), 253, , thus near the boundary between the third and fourth Galactic quadrants and not far from the north Galactic Pole. Its foreground reddening is accordingly quite small, . NGC 4147 lies some 19 kpc from the Sun and 21 kpc from the Galactic center, making it clearly a member of the halo rather than the disk subpopulation of globular clusters. In fact, it lies pretty much within the transition zone between the inner and outer components of the Galactic halo (e.g., Carney et al. 1990, 1991). The cluster metallicity is listed as [Fe/H]–1.8; apparently nothing is known about its [/Fe] ratio.
NGC 4147 is intrinsically rather small: among the 146 Galactic globular clusters with estimated absolute visual magnitudes in Harris’s compilation, with NGC 4147 ranks 112th in total intrinsic luminosity, comparable to notoriously sparse clusters like Palomar 4. However, the cluster’s half-light radius is estimated at 2.4 pc (van den Bergh & Mackey 2004), which is more typical of inner-halo clusters than outer-halo ones. Djorgovski & King (1986) list NGC 4147 as possibly being among the 20% of Galactic globular clusters with central density cusps believed to be the result of gravothermal core collapse, although Aurière & Lauzeral (1991) suggest that the central brightness cusp might be explained by the presence of a mere three bright giants in the inner 4′′ of the cluster. NGC 4147 does not seem to be a candidate post-core-collapse cluster either in the surface photometry of Trager et al. (1993) or in the velocity-dispersion data of Pryor & Meylan (1993).
An early photometric study of NGC 4147 was published by Sandage & Walker (1955), based upon both photoelectric and photographic measurements from Mount Wilson Observatory and Palomar Observatory. They regarded the cluster as an important test of the modern theory of stellar evolution, which has since become universally accepted but was then quite new. They also reported the discovery of ten new variable stars, presumably of the RR Lyrae type, which were assigned the designations V5–V14; one variable star had previously been discovered by Davis (1917), and three more had been reported by Baade (1930).
More recent work on NGC 4147 has been rather sparse, perhaps in part because of its relatively great distance and isolation in a direction well apart from most other globular clusters. Aurière & Lauzeral (1991) published CCD photometry of a 100′′160′′ region around the center of the cluster, based upon a night of observations in 1′′.0–1′′.2 seeing conditions at the Observatoire du Pic du Midi. They found a fairly steep red giant branch (RGB) typical of metal-poor globular clusters, along with a prominent blue horizontal branch (HB) not unlike that of NGC 288 (except for the clear presence of a more substantial RR Lyrae component). However, their photometry did not go deep enough to reach the main-sequence turnoff of the cluster. Since then, Wang et al. (2000) have also presented color-magnitude diagrams for this cluster, although they barely reached the HB level. Piotto et al. (2002) reported on HST photometry for the innermost regions of the cluster, which although revealing the main-sequence turnoff point for the first time, appeared to extend mag below it. This, along with the fact that the HB of the cluster was not particularly well defined in the HST study, especially at its “horizontal” level (i.e., around the RR Lyrae region), have led to few attempts to utilize these data for reliable age dating of the cluster.
The first detailed study of the variable-star population in NGC 4147 was carried out by Newburn (1957), who added three more entries to the catalog of variable-star candidates in the cluster. In this paper, Newburn also retracted his earlier claim that candidate V9 was a variable, which he had made in a private communication to A. R. Sandage. Another study of six of the best cluster RR Lyrae candidates was carried out at about the same time by Mannino (1957). As of May 2005 Christine Clement’s web site222 http://www.astro.utoronto.ca/cclement/read.html (Clement et al. 2001) still lists those 17 objects as the only known or suspected photometric variables in the field of NGC 4147; among them, the periods listed for seven are flagged as dubious and V9 is indicated as “probably not var.”
On the basis of these data, NGC 4147 has stood out from other Galactic globular clusters due to its reportedly unusual RR Lyrae star properties. In particular, Castellani & Quarta (1987) classified this cluster as belonging to Oosterhoff (1939) Type I (Oo I) despite the fact that it possesses a low metal abundance and a blue HB. Such a classification seems inconsistent with the scenario—which gained significant impetus in the late-1980’s/early-1990’s with the work by Lee et al. (1990), and later on by Clement & Shelton (1999)—whereby RR Lyrae stars in Oo I globular clusters (predominantly red or intermediate HBs) are relatively unevolved objects, whereas those in Oo II globulars (predominantly blue HBs) are evolved from a position on the blue zero-age HB (ZAHB). However, when this potential conflict with the evolutionary interpretation was identified, the possibility was soon raised that at least some of the RR Lyrae periods reported in the literature were in fact incorrect. For this reason, Clement (2000) stressed the need for additional work on the variable stars in this cluster.
Arellano Ferro et al. (2004; hereinafter AF04) have recently provided new periods and light curves in the and photometric bandpasses for the 17 previously known NGC 4147 variable candidates, and for an eighteenth candidate variable that they identified in the cluster field. The work is derived from 23 nights of observations from three observatories sampling a total range of 171.6 days in 2003. The number of individual magnitudes reported by AF04 for any given star ranged from a minimum of 68 (V18) to a maximum of 551 (V9). This work confirmed that some of the older periods for the variable stars were incorrect, but nevertheless the cluster’s Oo I classification was also confirmed. AF04 did not provide a color-magnitude diagram for NGC 4147.
In the remainder of this paper we present the results of our analysis of 524 ground-based images of NGC 4147 as well as five exposures obtained with the WFPC2 camera on the Hubble Space Telescope. These data span the period 1983–2003, and are independent of those employed by AF04. Section 2 below describes the nature and the provenance of our CCD images. Section 3 presents some details of the methodology by which we determined fundamental positions and magnitudes for stars in the cluster field. Section 4 discusses new color-magnitude and color-color diagrams for the cluster. In Section 5 we present new period determinations and inferred physical properties for the known variables in the cluster field based upon a combination of our own data with the independent data of Newburn, Mannino, and AF04. Here we also include results for a new c-type RR Lyrae star that is identified here for the first time. Finally, we present a brief discussion of the significance of the present results.
| Observing run | Telescope | Detector | Year/Month | Clr | Cld | ||||
|---|---|---|---|---|---|---|---|---|---|
| nbs | CTIO 4m | RCA1 | 1983 Jan | 4 | – | 5 | 6 | 3 | 2 |
| jvw | INT 2.5m | RCA | 1986 Mar/Apr | – | 1 | 4 | 4 | 4 | 3 |
| igs | INT 2.5m | GEC4 | 1989 Mar/Apr | – | 1 | 3 | 6 | 7 | 6 |
| c90ic17 | CFHT 3.6m | RCA4 | 1990 May | – | 1 | – | 3 | – | 3 |
| c90ic02 | CFHT 3.6m | RCA4 | 1990 May | – | 1 | 2 | 2 | – | 2 |
| rdj | JKT 1.0m | GEC3 | 1991 Apr | – | 1 | 5 | 5 | 5 | 4 |
| rld | JKT 1.0m | GEC6 | 1991 May | – | 1 | 3 | – | 6 | – |
| rdj2 | JKT 1.0m | GEC3 | 1992 Mar | – | 1 | 5 | 3 | 5 | 5 |
| psb | INT 2.5m | EEV5 | 1992 Mar | 3 | 1 | 5 | 5 | 5 | – |
| c92ic34 | CFHT 3.6m | Lick2 | 1992 Mar | – | 1 | – | – | 1 | 1 |
| dhpj | INT 2.5m | GEC6 | 1992 Apr | – | 1 | – | – | 57 | 16 |
| rjt | INT 2.5m | EEV5 | 1992 Apr/May | – | 1 | 4 | 4 | 5 | 4 |
| saic | CFHT 3.6m | HRCam/saic1 | 1992 May/Jun | – | 1 | – | 4 | 8 | – |
| c92ic05 | CFHT 3.6m | Lick2 | 1992 Jun | – | 1 | – | 1 | 1 | 2 |
| h92iic22 | CFHT 3.6m | HRCam/saic1 | 1992 Jul | – | 1 | – | 2 | 4 | 1 |
| bolte | KPNO 2.1m | t1ka | 1994 Apr | 1 | – | – | 2 | – | 2 |
| pwm | JKT 1.0m | EEV7 | 1994 Apr | – | 1 | – | 1 | – | 1 |
| siv | INT 2.5m | EEV5 | 1994 Apr/May | 1 | 1 | – | 18 | – | 17 |
| itp | JKT 1.0m | EEV7 | 1994 May | – | 1 | 4 | 3 | 4 | 2 |
| smh2 | INT 2.5m | TEK3 | 1995 Jan | – | 1 | 1 | 2 | 1 | 2 |
| mxt | INT 2.5m | TEK3 | 1995 Apr | 4 | 1 | 20 | 17 | 17 | 16 |
| rr | INT 2.5m | TEK1 | 1996 May | – | 1 | – | 43 | – | – |
| bond9 | KPNO 0.9m | t2ka | 1997 May | 1 | 1 | 3 | 3 | – | 3 |
| n4147 | hst | WFPC2 | 1999 Jun | 1 | 1 | 3 | 2 | – | – |
| jun00 | CFHT 3.6m | CFH12k | 2000 Jun | 1 | – | – | 2 | – | – |
| bono | MPG-ESO 2.2m | WFI | 2002 Feb | 1 | – | 5 | – | – | – |
| hannah | JKT 1.0m | SIT2 | 2002 Mar | – | 1 | 3 | 3 | 3 | – |
| arg02 | JKT 1.0m | SITe2 | 2002 May | 1 | – | 2 | 2 | 2 | – |
| vimos1 | VLT Melipal 8m | VIMOS | 2003 Apr | 1 | – | 1 | 1 | 1 | 1 |
| alf03 | JKT 1.0m | SITe1 | 2003 May | 1 | – | 1 | 1 | 1 | 1 |
2. DATA
Table 1 details the CCD images that are available in the , , , and filters for the globular cluster NGC 4147. All observing runs but one have been taken from public archives or have been donated to the cause from private collections. The first four columns of the table list, respectively, the arbitrary name that we have assigned to a given observing run, the telescope, the camera system, and the approximate dates of the observations. The columns labeled “Clr” and “Cld” represent the number of data sets per CCD that were analysed under the assumption that they had been obtained under, respectively, photometric and non-photometric conditions. (See Stetson 2005 for the sense in which we use the terms “observing run,” “data set,” “photometric,” and “non-photometric.”) Each number in the column “Clr” represents the number of photometric nights during the observing run upon which images of NGC 4147 were obtained. A “1” under the heading “Cld” indicates that one or more nights of non-photometric data were bundled into a single photometric reduction. Finally, the columns labeled “,” “,” “,” and “” represent the number of individual exposures that were obtained in those filters during each observing run. Note that the VIMOS, WFI, and CFH12k cameras contain, respectively, four, eight, and twelve CCDs. A single exposure with one of these cameras therefore contributes that number of independent CCD images to the total set of data. However, since in each case the separate images are non-overlapping, the number of exposures represents the maximum number of CCD images in which any given star can appear. The CFHT+CFH12k run labeled “jun00” is the one set of observations that we obtained ourselves.
The WFPC2 images of NGC 4147 were obtained with the Hubble Space Telescope in the course of observing program 7470, “A Snapshot Survey of Galactic Globular Clusters,” I. R. King, PI. We obtained the on-the-fly recalibrated copies of these images through the services of the Canadian Astronomy Data Centre.
In addition to the 452 ground-based exposures and five WFPC2 exposures listed in Table 1, which produced a total of 534 distinct CCD images, we also had seven ground-based exposures (ten images) in one or another flavor of the bandpass. These were included in the ALLFRAME reductions in order to extract whatever information they might contribute to the completeness of the star list and the precision of the astrometry, but no attempt was made to calibrate or employ them photometrically. Among the 524 ground-based images of NGC 4147, the best seeing achieved was 0′′.37, 25th percentile 0′′.97, median 1′′.24, 75th percentile 1′′.6, and worst 5′′.
For each observing run obtained from the archives, we requested all the CCD images obtained during the course of the run, including such bias frames and flat-field frames as were available, as well as any images of other astronomical targets in case they might be—or might someday become—secondary standard fields (see Stetson 2000). Mean bias, flat-field, and, when necessary, fringe frames were constructed in accordance with procedures that have by now become well established, and the images of science targets were corrected for these instrumental signatures in the usual way. Those data sets that were contributed from private collections (“nbs,” “bolte,” “bond9,” “arg02,” and “alf03”) had been corrected for bias and flat-field structure before the images were passed on to us and, again, we tried to make sure that we had copies of all images of science targets from those observing runs.
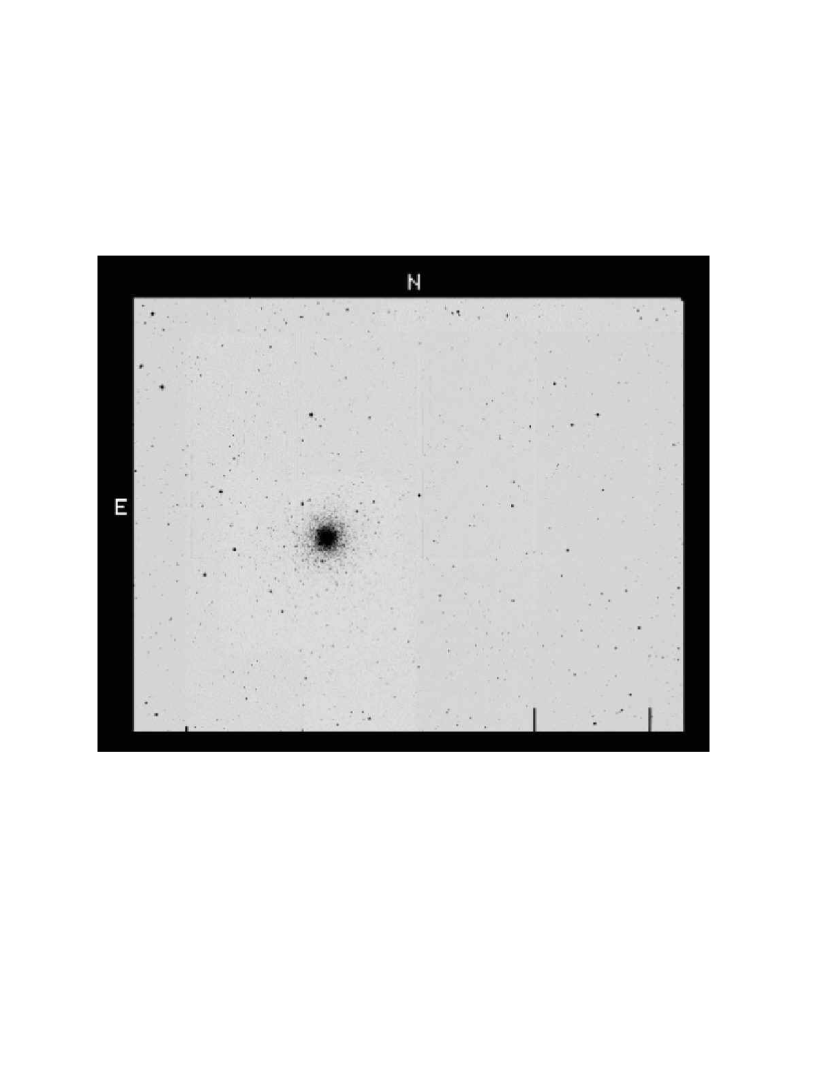
The total body of imagery for NGC 4147 spans an area of roughly 71 east-west versus 39 north-south, centered on 1012s.4, 3638′′ (J2000). However, the outer limits of this field are defined by the CFH12k data, which exist only for the filter. Those stars for which , , and photometry (at least) are available are contained within the bounds 120834s.4121055s.8, +182047′′+184707′′(J2000). A congeries of images representing this 3426 area of sky is presented here as Fig. 1.
3. ANALYSIS
The ground-based and HST observations of NGC 4147 were analysed separately, as experimental reductions of ground-based and HST data together have so far proven disappointing. One would think that we could use the HST imagery to establish an ironclad star list and set of centroid positions, which could then be imposed as prior conditions on the analysis of ground-based images in a solution for photometric parameters alone within the area of overlap. We have not yet stumbled upon an effective way to make this work. It is often the case that a bright star is seen to have numerous fainter companions in the HST images. However, when this information is used in the analysis of the ground-based data, only the stars’ relative positions are carried along from the HST to the ground-based reductions, not their relative magnitudes; otherwise, it would be impossible to fairly treat stars of differing colors, or stars whose brightnesses vary with time. It seems that under these circumstances—when a given blob of light in the ground-based data encompasses several distinct but unequal detections in the HST imagery—the software at present has too much freedom to distribute the ground-based photons among the various HST detections as it attempts to optimally model the detailed distribution of light in the observed blob. The net result is a compact clump of objects that individually appear to brighten and dim spasmodically in response to the varying distribution of noise in the object’s profile as recorded in the different ground-based images. In most cases it seems preferable, at least with the current generation of software, to ignore the fact that brighter stars may have fainter companions visible in the HST images. Instead, we reduce the ground-based data independently of the HST star lists, and cross-identify the stars ex post facto. It will generally be obvious from the WFPC2 data which stars sufficiently dominate their companions that such a comparison will be meaningful, and which stars will be so badly blended in the ground-based data that no reasonable comparison is possible.
3.1. Astrometry
Employing the services of the Canadian Astronomy Data Centre, we extracted from the U. S. Naval Observatory “USNO-A2.0” Guide-Star Catalog (Monet et al. 1998) all 7,941 sources within a square box 120′.0 on a side centered on coordinates 1013s.79, 3122′′.4 (J2000). These coordinates represent the origin of the differential coordinate system that we will henceforth employ for identifying detected objects. Also through the Data Centre, we extracted images 80 on a side, centered on the same coordinates, from the STScI Digitized Sky Survey 1 “O” plate, and the Digitized Sky Survey 2 “B,” “R,” and “I” plates. These were analyzed with a modernized version of the Stetson (1979) software. The program DAOMASTER (Stetson 1993) was then used to transform the data from these star lists and from our own ALLFRAME (Stetson 1994) analysis of the ground-based CCD images to a common reference system based upon the USNO2 coordinates. Ten-parameter cubic fits in and were used to effect the transformations. The coordinates in our composite star list should now be accurately aligned with the cardinal directions, with increasing east and increasing north. Positions are expressed in units of arcseconds with the origin of the coordinate system at the celestial coordinates given above. Measurements from the WFPC2 images were subsequently transformed to the same system by comparing the coordinates of detected objects to positions derived from the ground-based CCD images, again employing a 10-parameter cubic transformation for each of the two spatial dimensions.
The precision at the present epoch of the USNO2 positions is generally in the range 0′′.2–0′′.4 per detection, and appears to be dominated by the proper motions of nearby stars and the difficulty of unambiguously centroiding extended objects like stellar blends and galaxies. Our positional system as a whole should therefore be the same as the USNO system with an accuracy 0′′.4′′.01, but we can provide no independent estimate of the absolute accuracy of the USNO system itself. The precision of the position of any one star relative to the others in our catalog is probably never better than a few ′′.01, and will be much worse than this for faint or crowded stars, and for non-stellar detections.
3.2. Ground-based Photometry
Profile-fitting and concentric-aperture photometry were obtained for all images of science targets with the DAOPHOT-ALLSTAR-ALLFRAME-DAOGROW- software packages following commonly understood reduction procedures (e.g., Stetson 1987, 1990, 1994). The corpus of ground-based instrumental magnitudes measured in the various bvri systems was then transformed to Stetson’s current best approximation of Landolt’s (1992) BVRI system via the CCDSTD-CCDAVE-NEWTRIAL (Stetson 1993) software packages. The way in which the instrumental magnitudes from the various observing runs are transformed to a common standard system duplicating that of Landolt as closely as possible has been discussed in some detail recently (Stetson 2005).
In brief, for each photometric night, observations of large numbers of primary and secondary standards are used to determine the photometric zero points, extinction coefficients, and polynomial-approximation color-transformation coefficients relating instrumental to standard magnitudes for that specific telescope/filter/detector combination. These quantitative transforming relationships are used to convert the instrumental magnitudes for hand-selected stars in the NGC 4147 field to the standard system. The totality of calibrated data for each of these stars from all photometric nights is robustly averaged to define a local sequence of secondary standards in the NGC 4147 field itself.
For a non-photometric data set, the data for all celestial fields that contain at least two standard stars spanning some range of color are used to determine the corrections for bandpass-mismatch as functions of the standard color; during this analysis the photometric zero point of each individual CCD image is allowed to float. In calibrating an individual image of NGC 4147 from a non-photometric data set, the color transformation derived from all standard-star observations included in that data set is imposed, but the photometric zero point of each image is determined only from the local secondary standards contained within that image itself.
In the field of NGC 4147, the first author has identified 712 stars that appear to be both bright and isolated enough to be potentially useful as photometric standard stars. Among these, 412 stars have been sufficiently well observed that they are listed on his web site (as of January 2005) as potential secondary standards for the calibration of other science targets: these are defined as those stars having at least five observations on photometric nights and standard errors333For a single measurement of a star in a single image, the standard error of the measurement is based upon a compromise between two considerations: first, the readout noise and Poisson noise of star plus sky in each pixel, and second the observed scatter of the residuals of the individual pixels from the best-fitting point-spread function. When the number of pixels contained within the star image is small, the former consideration dominates, when the stellar image is spread over many pixels, the latter dominates. The standard error of the average of many measurements of a particular star in a given filter is similarly based on a compromise of two considerations: first, the above-described standard errors of the individual measurements; second, the actual observation-to-observation agreement of the measured magnitudes, with more weight being accorded to the latter as the number of independent observations grows. of the mean calibrated magnitude mag in at least two of the BVRI filters, and no indication of intrinsic variability greater than 0.05 mag, root-mean-square, when data from all filters are considered together. For our present purposes, we will use the local reference stars solely to redetermine the photometric zero points of the individual CCD images to place them all on as internally consistent a system as possible. All other color terms, extinction coefficients, and spatially dependent corrections will be imposed as known quantities from previous calibration stages. Since the zero point of any given CCD image is now the only unknown quantity, for our present purposes we have slightly relaxed the aforementioned criteria and adopted a local reference sequence consisting of 531 stars that were observed on at least three photometric occasions and have standard errors of the mean magnitude mag in at least two of the four principal filters, and have no evidence of variability in excess of 0.05 mag, root-mean-square. The minimum, median, and maximum number of these local reference stars in any individual CCD image were, respectively, 1, 159, and 479.
Our experience is that the aggregate of CCD data for any given astronomical field obtained on any given photometric night can typically be calibrated to the standard magnitude system with an external accuracy 0.02 mag, root-mean-square (this is a very crude generalization). Some vague sense of the likely external accuracy of our photometry can therefore be obtained from the data in Table 1. For instance, at least some data in the band were obtained for the NGC 4147 field on 18 photometric nights, so the absolute magnitude scale has probably been established with an accuracy no better than mag. A pessimist might say that the 0.02 mag figure actually applies to the accuracy possible from a given run, rather than night. In this case, the external accuracy would be guesstimated at mag. In either case, the absolute accuracy in , , and would be even poorer than these estimates, since these filters were less commonly used than .
3.3. WFPC2 Data
The instrumental magnitudes for stars in the WFPC2 observations of NGC 4147 were extracted from the images in pretty much the same way as was done for the ground-based data (see, e.g., Stetson et al. 1998 for more details). That done, the WFPC2 star lists were searched for cases of individual bright stars that, while not being saturated, nevertheless sufficiently dominated their fainter neighbors that one might be able to relate their WFPC2 instrumental magnitudes to their magnitudes on the fundamental Landolt (1992) photometric system via the ground-based observations of the cluster. Table 2 and Table 3, respectively, list the positions and photometric results for the 91 stars hand-selected for this purpose.


In calibrating these data to the ground-based photometric system, we found that the color-transformation coefficients of Holtzman et al. (1995) for the filter were satisfactory:
left no serious residual trends with color or magnitude, as we illustrate in Fig. 2. However, Holtzman’s transformation,
did not seem to work for the NGC 4147 data. When we imposed this color transformation on the data from the four WFPC2 chips and solved only for a photometric zero point for each image, we obtained the transformation residuals shown in Fig. 3. Not only is there a systematic curvature of the fitting residuals with color, but since the bluest stars all have similar apparent magnitudes—they are on the blue horizontal branch—the poor color transformation appears as a magnitude nonlinearity as well. We therefore used these NGC 4147 data to redetermine the color transformations for the filter, and arrived at the following relationship:
This represents the weighted average of the transformations derived independently from the four CCDs, and this average transformation was imposed equally on the data from the four chips in the final reduction. The star-by-star residuals from this best fit are illustrated in Fig. 4. The data shown in the lower panel suggest that a cubic color term might be called for, as the bluest stars still tend to have positive fitting residuals, and the two reddest stars—which have very small uncertainties—have negative residuals. However, in view of the number and quality of the calibrating stars, we judge a cubic transformation to be too extreme to be attempted in this case. The formal uncertainties of the linear and quadratic coefficients are already and , respectively.
Our -band color-transformation coefficients are painfully huge, and very different from the published values. We note that in a previous analysis of these same data by Piotto et al. (2002), the Holtzman color corrections were adopted. Some indications of a problem with the standard F439W calibration were noted by Bedin et al. (2000) in their study of NGC 2808 = C0911-646, which they dealt with by means of an empirical linear adjustment of the WFPC2-based B–V colors to ground-based values for stars in the cluster field. We can offer no explanation for the difference between Holtzman’s calibration and ours, and fall back on the feeble justification that this transformation appears to be necessary to make our analysis of the WFPC2 images accord with our ground-based results.

4. COLOR-MAGNITUDE AND COLOR-COLOR DIAGRAMS
4.1. Color-Magnitude Diagrams for NGC 4147
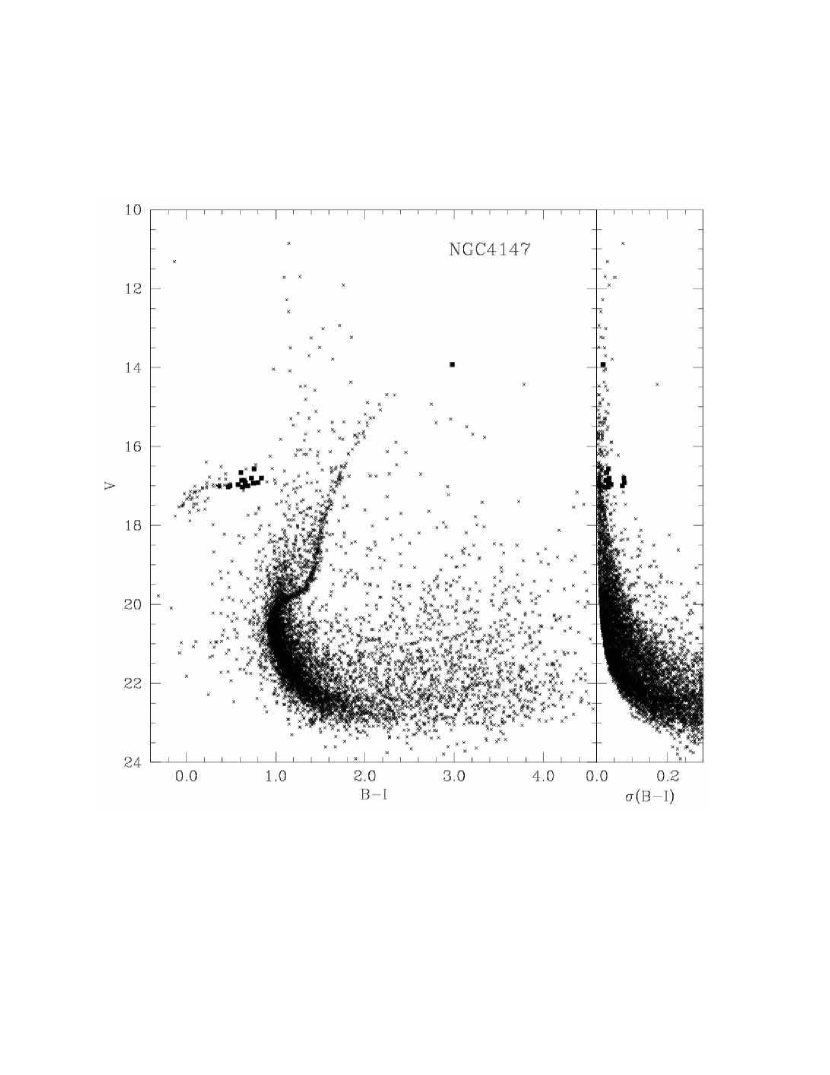
The left panel of Fig. 5 is a ground-based versus B–I color-magnitude diagram (CMD) for every detection in the field of NGC 4147 for which we have photometry in at least the , , and filters, and mag, within the indicated magnitude and color limits. The right panel plots the value of for the same detections against the visual magnitude. Note that the horizontal scales of the two parts of this diagram are not the same. Solid squares in this plot represent average photometric indices for the 15 previously identified variable candidates444At this point, we do not consider V5, V9, or V15 to be likely variable stars; see §5.3 below. in the cluster field, plus one additional variable candidate that we have identified in these data. The variable candidate at is V18, discovered by AF04, which they tentatively identify as a foreground RR Lyrae star. For those variable candidates for which we were able to estimate periods and produce reasonable light curves (see next section), we have derived mean magnitudes by converting the fitted light curves to flux units, integrating over one cycle, and converting the results back to a magnitude scale. In the case of V18—for which we were unable to find a period—the mean photometric indices are only robust averages of the individual magnitudes we have in hand. There will be more discussion of these stars in §5 below.
The CMD clearly shows the presence of foreground stars and background galaxies, especially those with red colors and faint magnitudes. The presence of stellar blends in the crowded cluster center is also evident in the broad lump of stars above the subgiant branch. The fact that tends to values larger than 0.1 mag primarily for stars considerably fainter than suggests that our photometry is reasonably complete to at least this limit555Note that implies, in the worst case, , or a signal-to-noise ratio of about 5 in each filter; if the S/N ratio is slightly poorer than this in one filter, then it will be much better than this in the other. Therefore a star with is at least a detection in and considered together, and is probably a detection when the filter is added, since that bandpass is close to the peak quantum efficiency of standard CCDs., which is close to the main-sequence turnoff (TO) of the cluster.
We therefore estimated the astrometric position of the cluster center as follows: a virtual circular aperture of some specified radius was scanned over the catalog of detections with calibrated positions and magnitudes. This aperture was judged to be centered on the cluster when the median - and median -position of all objects with contained within the aperture coincided with the center of the aperture itself. For instance, when a virtual aperture of radius 5 was concentric with the cluster, it contained 938 catalog entries, and the one-dimensional root-mean-square width of the distribution of objects about the centroid was ′′, so the precision of this cluster centroid may be estimated at 68′′/′′ in each direction. We presume that any residual incompleteness of stars with at small cluster radii will be more or less independent of position angle, so this should not systematically affect our estimate of the cluster centroid position.
Repeat experiments with virtual-aperture radii from 9 down to 10′′ produced ratios that continued to decrease monotonically for smaller aperture radii. During these experiments the derived cluster centroid position drifted over an extreme range of 2′′.9 in right ascension and 2′′.4 in declination. The center of these two ranges corresponds to the position 1006s.34, 3233′′.4 (J2000), which is very close to the estimate obtained with a virtual-aperture radius of 60′′, enclosing 741 objects with a positional root-mean-square dispersion of 27′′. This estimated position, which we believe to be accurate to ′′.0 in each coordinate, lies about 3′′ northeast of the value tabulated by Harris (1996).

The upper panel of Fig. 6 shows the radial distances of all stars with mag from this adopted cluster centroid position, plotted against their apparent visual magnitudes. The filled squares mark 15 of the 16 variable-star candidates (V18 now lies above the upper edge of the diagram). The lower panel shows magnitude against radius for all stars with mag. The rising lower envelopes for ′′ result from the increasing effect of crowding for faint stars at small radii. Taken together, these plots suggest that serious incompleteness for stars with probably sets in only for radii less than 10′′; the detection limit improves from at 20′′ radius to at 100′′, and remains roughly constant at that level as far as the remotest corner of the field some 20 from the cluster center. The slight upturn of the error–magnitude curves at larger radii is due to the fact that the outer parts of the field are contained in fewer CCD images than the cluster center. Our star list is probably close to complete to at all radii down to the cluster center. The cluster HB, indicated by the variable stars and an overdensity of constant stars near , can be clearly traced out to a radius of 200′′, with one probable RR Lyrae variable (the one discovered here) lying nearly 5 from the cluster center. In the upper panel there also appears to be a vague edge to the distribution of upper-main-sequence stars with near a radius of 200′′.

Fig. 5 represents every star with reliable BVI photometry in our sample. We now want to produce a cleaner CMD in order to better define the morphology of the cluster fiducial sequence. Fig. 7 is an attempt to produce a cleaner diagram by plotting only the catalog entries with the following properties: mag, and
These selection criteria have been applied only to the putatively constant stars; all the variable candidates have been plotted as filled squares regardless of position or magnitude.
It is clear from the figure that even these criteria include a few stars of larger photometric uncertainty, especially among stars slightly brighter than the boundaries of our imposed magnitude zones at and ; presumably these stars with larger color errors are concentrated in the innermost parts of their radial zones as well. This illustrates a known shortcoming of the ALLFRAME analysis package: when photometric errors are dominated by crowding, rather than noise, ALLFRAME systematically underestimates the uncertainties of the derived photometric indices. This is shown most clearly by the group of stars to the blue of the RGB and below the HB, with and . These are mostly cluster giants that have been scattered by up to 0.4 mag in B–I color by crowding errors, despite the fact that their color uncertainties have been estimated to be less than 0.10 mag. This tendency of the software results from the fact that those photometric uncertainties are estimated from the known readout noise and Poissonian photon statistics in the digital image as well as the size of the individual-pixel residuals from the profile fits. However, when a given blob of light is being modeled by many overlapping profiles each of which has an amplitude and a centroid in two dimensions that may be freely adjusted, many different combinations of fitted parameter values may produce fits of nearly the same quality. As a result, the adopted solutions may in fact be rather farther from the “true” solution than the fitting residuals would seem to imply. The stars here are affected most strongly in the filter because at shorter wavelengths the brightness contrast between the giant-branch stars and the fainter, bluer subgiants and turnoff stars is smaller than in or , which makes the crowding effects more severe.

To reduce the influence of stars whose photometric errors have been underestimated due to crowding, one can employ a separation index such as that defined by Stetson et al. (2003; see their Sec. 4.1) to supplement the -based selection criterion. Fig. 8 here results from the same selection criteria as Fig. 7 augmented by for an assumed seeing of 1′′.0, which means that a star must be at least sixteen times brighter than the summed contribution of all other stellar profiles at its position—i.e., its light must be contaminated by no more than 6% by known companions—when the seeing is one arcsecond. As one can see, this additional acceptance criterion completely removes the slight haze of stars below the nominal position of the red horizontal branch, and reduces the number of stars above the main-sequence turnoff and subgiant branch.


In Table 4 we present our derived fiducial sequences for NGC 4147. The principal sequences were derived from hand-sketched curves drawn on large-scale plots of cleaned CMDs with plotted against, separately, B–I, B–V, V–R, and V–I. Once normal points had been read out with a ruler, we considered the first and second differences between the tabulated points, and made minor adjustments to the normal points to produce reasonable smoothness. The final curves were visually verified by digitally overplotting the final normal points on the CMDs. In the case of the horizontal branch, we estimated the locus from a large-scale plot of the CMD (Fig. 9), because this diagram offers the most favorable ratio of photometric uncertainty to color range. The hand-drawn curve skirts the lower envelope of the horizontal branch where it is nearly flat—and therefore is expected to represent the ZAHB—and continues through the greatest density of points where it bends faintward at the blue end. This adopted curve has been transcribed to the other filters via color–color plots, like the ones shown as Fig. 10 here.
Fig. 11 shows our ground-based CMD for the NGC 4147 stars selected by the criteria listed above, with our derived fiducial sequences superimposed. For comparison, we show in Fig. 12 the CMD for all stars with and magnitudes derived from the HST observations. Here we have made no selection on radius or crowding; every point is plotted provided only that mag, and the derived color and magnitude fall within the limits of the diagram. The RR Lyrae candidates that fell within the WFPC2 field have again been plotted as filled squares, but since all the HST images were obtained within an interval of about 20 minutes, these represent instantaneous photometric quantities, and the estimated photometric errors do not stand out from those of the other stars. The same fiducial sequences as in Fig. 11 are reproduced here; they indicate that our calibration has done a reasonable job of referring the instrumental F439W and F555W magnitudes to the standard BV system. Only the bluest horizontal-branch stars appear to have been measured a bit too red, and the reddest giants have been measured a bit too blue. This may be a reflection of the third-order color calibration that we eschewed in the previous section.

4.2. Distribution of Blue Stragglers
A comparison of Figs. 11 and 12 suggests that a population of blue stragglers—stars brighter than the TO and bluer than the lower giant branch—is much more prominent in the WFPC2 data than in the ground-based data. To investigate whether there is a significant reality behind this appearance, we have estimated the relative frequency of stars in the blue straggler region of the CMD in various subsamples of the data. We must warn the reader, however, that this is not a fully rigorous experiment: there are complicating factors beyond our control. In particular, NGC 4147 was approximately centered on the PC chip of WFPC2. Readers will be familiar with the peculiar “E”-shaped footprint of the WFPC2 on the sky. With the large inter-chip dead zones (we do not attempt to calibrate photometry from positions px or px on the WFC chips, or px or px on PC; see Stetson 1998), gaps in the WFPC2 coverage extend to as close as 16′′ from the cluster center. The farthest corner of the WFC field lies some 90′′ from the cluster center. The ground-based coverage of the cluster, of course becomes confused and imprecise as the center is approached (Fig. 6 above). Furthermore, the photometric boxes we will use here are comparatively crude, so we will not be measuring a specific blue-straggler frequency in the sense of Bolte et al. (1993), for instance.
We define a blue-straggler box in the CMD by the limits and ; similarly we define a lower giant-branch box by and (cf. Figs. 11 and 12). We have not carried out formal artificial-star tests on these images. However, we note that Fig. 6 has shown that the photometric uncertainties of stars brighter than exceed 0.10 mag only for stars within 8′′ or 9′′ of the center of the cluster. Our past experience is that the detection completeness is not worse than 90% when the photometry achieves these levels of precision. Especially with the broad wavelength difference between the and filters enhancing the detectability of, respectively, blue and red stars, we expect that any residual incompleteness or large photometric errors due to blending will be negligible for these fairly closely matched photometric boxes at radii greater than 20′′.
| B–I | B–V | V–R | V–I | |
|---|---|---|---|---|
| Giant branch | ||||
| 14.75 | 2.275 | 1.072 | 0.623 | 1.203 |
| 15.00 | 2.168 | 1.022 | 0.594 | 1.146 |
| 15.25 | 2.079 | 0.975 | 0.572 | 1.104 |
| 15.50 | 1.998 | 0.931 | 0.551 | 1.067 |
| 15.75 | 1.927 | 0.890 | 0.534 | 1.037 |
| 16.00 | 1.865 | 0.854 | 0.517 | 1.011 |
| 16.25 | 1.811 | 0.820 | 0.503 | 0.991 |
| 16.50 | 1.760 | 0.789 | 0.492 | 0.971 |
| 16.75 | 1.715 | 0.763 | 0.482 | 0.952 |
| 17.00 | 1.671 | 0.738 | 0.473 | 0.933 |
| 17.25 | 1.631 | 0.717 | 0.465 | 0.914 |
| 17.50 | 1.594 | 0.697 | 0.457 | 0.897 |
| 17.75 | 1.560 | 0.679 | 0.449 | 0.881 |
| 18.00 | 1.531 | 0.662 | 0.442 | 0.869 |
| 18.25 | 1.507 | 0.646 | 0.436 | 0.861 |
| 18.50 | 1.484 | 0.632 | 0.430 | 0.852 |
| 18.75 | 1.460 | 0.618 | 0.425 | 0.842 |
| 19.00 | 1.438 | 0.604 | 0.421 | 0.834 |
| 19.25 | 1.411 | 0.590 | 0.417 | 0.821 |
| subgiant branch | ||||
| 19.50 | 1.369 | 0.567 | 0.413 | 0.802 |
| 19.60 | 1.339 | 0.557 | 0.404 | 0.782 |
| 19.65 | 1.314 | 0.548 | 0.395 | 0.766 |
| 19.70 | 1.277 | 0.533 | 0.383 | 0.744 |
| 19.75 | 1.229 | 0.510 | 0.370 | 0.719 |
| 19.80 | 1.176 | 0.478 | 0.355 | 0.698 |
| 19.85 | 1.127 | 0.455 | 0.340 | 0.672 |
| 19.90 | 1.083 | 0.435 | 0.325 | 0.648 |
| 19.95 | 1.052 | 0.421 | 0.312 | 0.631 |
| 20.00 | 1.026 | 0.410 | 0.302 | 0.616 |
| 20.10 | 0.994 | 0.398 | 0.290 | 0.596 |
| main sequence | ||||
| 20.25 | 0.975 | 0.388 | 0.286 | 0.587 |
| 20.50 | 0.965 | 0.380 | 0.286 | 0.585 |
| 20.75 | 0.979 | 0.388 | 0.290 | 0.591 |
| 21.00 | 1.011 | 0.404 | 0.298 | 0.607 |
| 21.25 | 1.061 | 0.426 | 0.310 | 0.635 |
| 21.50 | 1.127 | 0.453 | 0.326 | 0.674 |
| 21.75 | 1.205 | 0.484 | 0.346 | 0.721 |
| 22.00 | 1.296 | 0.520 | 0.370 | 0.776 |
| 22.25 | 1.408 | 0.565 | 0.397 | 0.843 |
| 22.50 | 1.532 | 0.615 | 0.426 | 0.917 |
| Horizontal branch | ||||
| 17.75 | –0.110 | –0.068 | –0.032 | –0.042 |
| 17.70 | –0.099 | –0.062 | –0.031 | –0.037 |
| 17.50 | –0.047 | –0.037 | –0.023 | –0.010 |
| 17.35 | 0.000 | –0.015 | –0.015 | 0.015 |
| 17.25 | 0.040 | 0.003 | –0.008 | 0.037 |
| 17.15 | 0.100 | 0.028 | 0.006 | 0.072 |
| 17.05 | 0.200 | 0.070 | 0.032 | 0.130 |
| 17.03 | 0.300 | 0.112 | 0.063 | 0.188 |
| 17.02 | 0.400 | 0.153 | 0.100 | 0.247 |
If we consider the entire BVI survey area outside the 200′′ limit, we count 12 stars in the blue-straggler box and 54 stars in the lower-giant box, contained within an area of some 890 sq. arcmin; we take these as representative of the field population. If we now consider the ground-based data for the annulus 20′′–200′′, we count 9 blue stragglers and 153 faint giants in an area of some 35 sq. arcmin. If we subtract the scaled field component, the blue straggler:giant ratio becomes 9:151 for the cluster rounded to nearest whole numbers, or 0.06. Now if we consider the WFPC2 photometry (recognizing that a portion of the WFPC2 field overlaps with the 20′′-200′′annulus) we count 23 blue stragglers and 137 faint giants (ratio = 0.17) in a total area of some 4.7 sq. arcmin. Field corrections to these latter numbers are negligible: less than a quarter of a star. Incompleteness due to crowding is also a non-issue in the WFPC2 data. From this, it is already clear that the blue stragglers in NGC 4147 are strikingly more centrally concentrated than the faint giants. This conclusion is reinforced by the observation that, within the WFPC2 coverage, the rms distance of the blue stragglers from our adopted cluster center is 12′′, that of the faint giants is 35′′.
For further discussion of the evidence and implications of radial gradients in blue straggler populations in globular clusters, the reader is referred to the recent papers by Piotto et al. (2004) and Sabbi et al. (2004). The high central concentration of blue stragglers is generally held to be consistent with the idea that they were formed by stellar collisions or binary mergers in a past episode of core collapse.
| Ground-based data | ||||||
| 20.48 | 0.971 | — | — | — | — | — |
| 20.50 | — | 0.677 | — | — | — | — |
| 20.43 | — | — | 0.580 | — | — | — |
| 20.55 | — | — | — | 0.390 | — | — |
| 20.49 | — | — | — | — | 0.293 | — |
| 20.51 | — | — | — | — | — | 0.284 |
| WFPC2 data | ||||||
| 20.51 | — | — | — | 0.398 | — | — |
4.3. Comparison with Other Clusters—Relative Abundances and Ages
The data in Table 4 suggest that the TO of NGC 4147, defined as the bluest point on the fiducial sequence, lies at . A more sensitive analysis, involving the fitting of a parabola to the actual stellar photometry (i.e., not the normal points) in a restricted magnitude range symmetric about the TO (see Stetson et al. 1999), leads to the results shown in Table 5. Each separate CMD indicates both a color and a visual magnitude corresponding to the bluest point on the stellar sequence. A straight unweighted average of the seven values of is 20.50, but we regard the determinations near the top of the table as the strongest and those near the bottom as the weakest, so we adopt 20.48–20.49 as our best guess at the turnoff magnitude. With the flat part of the lower envelope of the horizontal branch (HB) quite well constrained at a value near , this implies a TO–ZAHB magnitude difference or 3.47 mag. Allowing some 0.06 mag for the typical difference between the ZAHB and the mean HB (e.g., Catelan 1992; Cassisi and Salaris 1997), this still puts NGC 4147 squarely within the band of normal globular clusters in the plot of Rosenberg et al. (1999, their Fig. 3) that relates to [Fe/H], implying a completely normal age compared to other globular clusters included in their analysis.


The normalcy of NGC4147 is further illustrated by the comparison between Fig. 13 and Fig. 14: the former shows the (B–I,) CMD of NGC 4147 from just below the turnoff to just above the horizontal branch, with our fiducial sequences superimposed. The latter diagram shows our unpublished data for the cluster M 3 = NGC 5272 = C1339+286, which we have collected and processed in the same way as for NGC 4147 and many other targets. Here we have not imposed a radial selection, but have plotted only stars with and . The solid curve is our hand-fitted fiducial sequence for NGC 4147, shifted brightward by 1.30 mag and with no horizontal shift. The agreement of the colors of the horizontal branches indicate that the reddening difference between the clusters is effectively zero (Harris 1996 gives E(B–V) = 0.02 for NGC 4147, 0.01 for M 3). The slight displacement and relative tilt of the giant branches indicates that M 3 is by a small amount the more metal-rich of the two clusters, an inference consistent with the data in Harris’s compilation catalog: he lists [Fe/H] = –1.83 for NGC 4147 and –1.57 for M 3; these are evidently on the metallicity scale of Zinn & West (1984). The agreement of the luminosity of the subgiant branches indicates that the ages of the two clusters are indistinguishable with the present data.
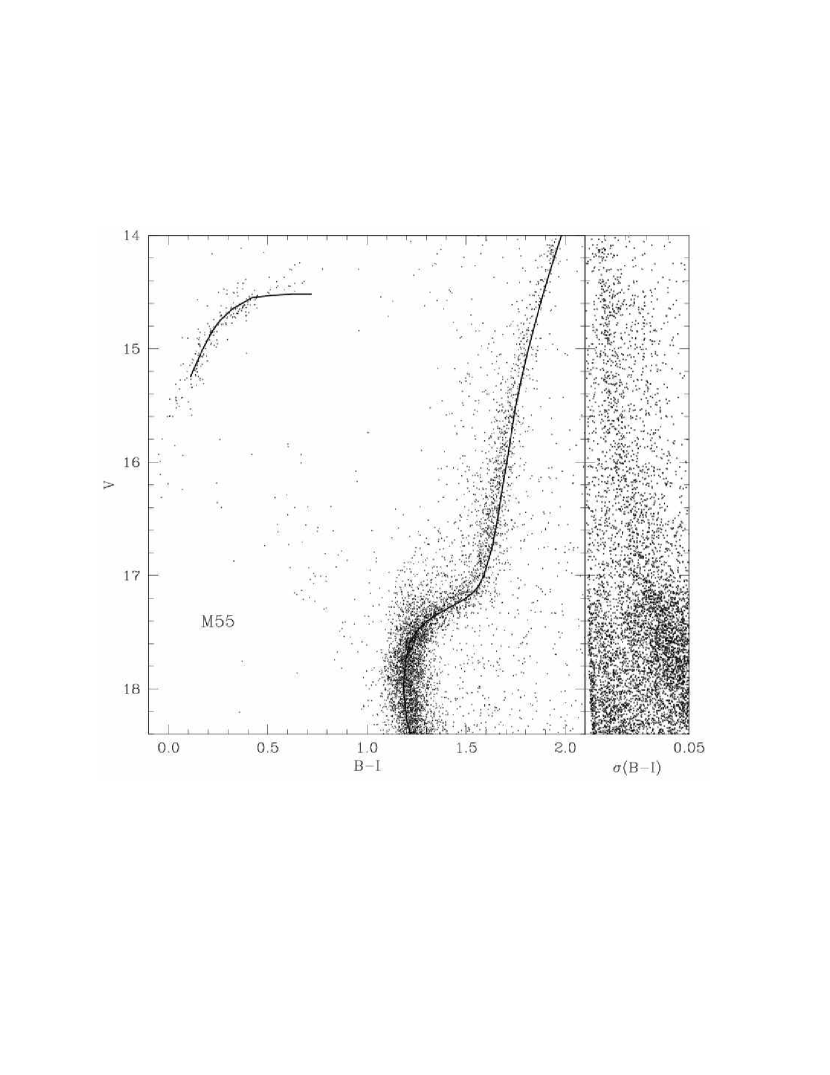
Fig. 15 compares our fiducial sequences for NGC 4147 to our unpublished photometric results for the globular cluster M 55 = NGC 6809 = C1936-310. This comparison is particularly interesting because the two clusters appear to have the same chemical abundances to within the precision with which they can be determined: Harris (1996) lists [Fe/H] = –1.81 for M 55. As is usually the case, the original CCD images are a mix of data we have taken ourselves and data we have requested from archives or received from colleagues with the intention of creating a large, homogeneous database of photometry for star clusters and resolved galaxies. Unlike NGC 4147 and M 3, M 55 is a southern cluster and has literally no observing runs in common with the other two. A quantitative comparison, then, relies heavily on the validity of the standard-star system used to calibrate the data.
The principal sequences in our CMDs for M 55 are perceptibly broadened by amounts in excess of our expected photometric errors. This is in contrast to the photometry of Mandushev et al. (1996) who found a tight main sequence with mag at and just below the turnoff. We have attempted to compensate by plotting only the stars with the very best data: mag, but this has not reduced the scatter. There are a number of possible explanations. First, part of the greater width of our principal sequences is undoubtedly due to the fact that many the images available to us have quite short exposures: their comparatively large values of are visible in the right-hand panel of Fig. 15. However, the perceived scatter does not decrease for the brighter stars as rapidly as one would expect. Second, our 3030 field includes the cluster center, while the 44 field of Mandushev et al. was some 7 (= 2.4 core radii) from the center. Our sample therefore presumably includes more stars whose photometry is adversely affected by crowding, although plots of our color residual from M55’s giant branch versus position do not support the notion that—at least on the giant branch—the photometric errors decrease with increasing distance from the cluster center. Third, we believe it is possible that M55 is subject to differential reddening; its Galactic coordinates are 9, , and the aforementioned plots of color residual versus position suggest that the reddening E(B–I) may be increasing toward the east. We should also note here that our main-sequence ridge line for M 55 in the color magnitude diagram lies 0.02 mag to the blue of that of Mandushev et al. over the magnitude range common to the two studies.
We find a best overall match between NGC 4147 and M when the fiducial sequences for the former are shifted by +0.22 mag in B–I and by –2.50 mag in . A quantitative determination of M 55’s turnoff magnitude by the fit of a parabola to more than 3,000 stars within mag of the turnoff in the (B–I,) CMD yields and , comparable to the values of 1.19 and 17.98 inferred from our manual shift of the NGC 4147 sequences—including the giant branch and horizontal branch—to those of M 55. Harris’s (1996) compilation catalog lists for NGC 4147—extremely close to the value of 17.02 that we have determined here—and 14.40 for M 55. The inferred difference in apparent visual distance modulus, –2.61, is not compatible with our data.
The perceived horizontal shift between the clusters is presumably due primarily to a difference in reddening. If E(V–I)E(B–V), then E(B–I)E(B–V), and our adopted shift of +0.22 mag in B–I corresponds to E(B–V) = +0.10 mag. Yet Harris lists E(B–V) = 0.02 for NGC 4147 and 0.08 for M 55. We note that the reddening maps of Schlegel et al. (1998) predict E(B–V)0.026 for NGC 4147 and 0.135 for M 55; the implied difference of 0.11 mag is less dissimilar to what we find than Harris’s tabulated values.
Closer investigation of Fig. 15 reveals that our shifted NGC 4147 fiducial falls perceptibly to the blue of the center of M 55’s main-sequence band, while NGC 4147’s giant branch is toward the red side of M 55’s. We have already noted that a quantitative determination of the color difference between the turnoffs of M 55 and NGC 4147, mag, is slightly greater than the 0.22 mag adopted as the best compromise shift between the fiducial sequences overall. The extent of the color difference between a cluster’s main-sequence turnoff and its lower giant branch is affected by both age and abundance, with a smaller difference indicating either a greater age or a lower metallicity. By this measure M 55 is then either older or more metal-poor, since for this assumed difference in the clusters’ reddening values its main sequence is redder and its giant branch is bluer than in NGC 4147. However, an age difference would also affect the difference in apparent magnitude between the flat part of the horizontal branch and the turnoff or the nearly flat part of the subgiant branch. As discussed above, this age indicator is very nearly the same in the two clusters; if anything, in Fig. 15 M 55’s subgiant branch is skewed slightly to the blue/bright side of that of NGC 4147, and the stars on the sloping part of M 55’s HB are skewed to the red/faint side of NGC 4147’s. If we accept that these minor differences are statistically significant, this would indicate a younger age for M 55, in conflict with the age implications of the color differences between turnoff and giant branch. We therefore suspect, on the basis of these photometric indicators, that M 55 may actually be slightly more metal-poor than NGC 4147. If this inference is correct, then the dereddened main sequence of M 55 should lie slightly to the blue—not to the red—of that of NGC 4147, and we conclude that the reddening toward M 55 must be still higher than our previous estimate by at least another 0.02 mag in E(B–I), i.e., about 0.26—or about 0.11 in E(B–V)—which brings it into still closer agreement with the Schlegel et al. predictions. Note that the redder measured colors of Mandushev et al. (1996) would imply an even higher reddening for M 55 if its metal abundance is similar to that of NGC 4147. If the reddening of M 55 is as high as E(B–V)0.12–0.15 mag, variability in the reddening at the level of 0.02–0.03 mag (rms) in E(B–V), or 0.05–0.07 mag in E(B–I), would not be surprising. This may be part of the explanation for the slightly broadened principal sequences in Fig. 15.
Even with all these caveats and conditions, the vertical magnitude difference between the clusters’ horizontal branches and subgiant branches, (NGC 4147), (M 55), indicates that their ages are the same to within the precision of these data. We note that VandenBerg (2000) has listed a value for M 55, completely at odds with our estimate even once allowance is made for the magnitude difference between the ZAHB and the mean HB. VandenBerg cites Chaboyer et al. (1996) as his source for this measurement. They in turn cite Buonanno et al. (1989), who derived for M 55 based upon their own CCD measurements calibrated to agree with the photographic photometry of Alcaino (1975), and from the photographic study of Lee (1977). For comparison, Buonanno et al. also cite and for the same cluster from a literature survey by Peterson (1986), but these values do not appear to have been used in their analysis. The original estimate of E(B–V)0.08 mag for M 55 also appears to have come from the photographic study by Lee. We believe the present work supersedes these values. The result found by Rosenberg et al. (1999) accords well with ours, whether we apply the mag correction for the ZAHB minus mean HB magnitude difference or not.
4.4. Morphological Parameters of the Evolved Sequences
The morphology of the giant branch of a globular cluster’s CMD has long been used as indicative of its metallicity. Ferraro et al. (1999) produced quantitative equations relating various measurable quantitities in the (,B–V) plane to [Fe/H] on the scale of Carretta & Gratton (1997; CG97). Fig. 16 shows our dereddened CMD for NGC 4147 with the various parameters illustrated. The B–V colors have been dereddened assuming . In this diagram we have extrapolated the giant-branch fiducial sequence (heavy long-dashed curve) in accordance with the notion that the star designated V18 by AF04 may be in fact a normal giant-branch member of the cluster, presumably near the giant branch tip666We note, however, that our star catalog for the field includes a companion star lying some 0′′.2 from V18, whose presence is inferred from the best-seeing images. V18 is present in the PC images, but in the extreme corner where the point-spread function is distorted and we do not attempt a calibration (the spherically aberrated image of the star falls on a vertex of the pyramid mirror before being corrected, resulting in lost light), and is badly saturated or close to saturation in the F555W exposures, so it is difficult to use them to confirm or refute the reality of the companion. If this detection is false, then we may have significantly underestimated the apparent brightness of V18, and the metallicities inferred here from the extrapolated-giant-branch morphology indices should be revised downward. Aurière & Lauzeral (1991) noted the presence of a bright star 25′′ from the cluster center with and , which agrees reasonably well with our measurements— and —even though they made no mention of such a companion and probably could not have seen one with their 1′′ seeing.. We have also projected the horizontal branch across the diagram to the giant branch (heavy dashed horizontal line) at the level .

Table 6 presents our quantitative results for the different morphology parameters and their corresponding values of [Fe/H] according to the equations given in Table 4 of Ferraro et al. We have marked with colons those results that are particularly dubious because they rely on our extrapolation of the giant branch to V18. We note that the index betokens a rather high metallicity for NGC 4147: higher than the other photometric indices, and high compared to published abundance estimates for the cluster. We do not know why this index stands out. In Ferraro’s compilation the various relations between the photometric indices and metallicity exhibit scatter of order 0.12 dex–0.20 dex in terms of abundance; the dispersion for is given as 0.18 dex. The uncertainty of these estimators for NGC 4147 may well be greater than for the average cluster, due to the paucity of bright giants. The metallicity implied by this one index is therefore anomalous at not more than a 2 level. This is probably not extreme enough to require a special explanation. For comparison, Ferraro et al. listed the following parameters for NGC 4147 based upon the CMD of Sandage & Walker (1955): , , , implying [Fe/H] = –1.53, –1.50, and –1.19. On the CG97 scale the adopted metallicities of NGC 4147, M 3, and M 55 are, respectively, –1.58, –1.34, and –1.61. On the metallicity scale of Zinn & West (1984) all these abundances would be about 0.2 dex lower. Our inferred metallicity estimates for NGC 4147 based upon the giant-branch morphogy parameters are consistent with the claims we made above: namely that it is perceptibly more metal-poor than M 3 and similar to or marginally more metal-rich than M 55 based on their (B–I,) CMDs.
| Parameter | Value | [Fe/H] |
|---|---|---|
| (B–V) | 0.716 | –1.80 |
| 2.40 | –1.75 | |
| 2.70 : | –1.73 : | |
| 3.07 : | –1.56 : | |
| 7.02 | –1.31 | |
| 6.02 : | –1.64 : |
The horizontal-branch morphology of a globular cluster is of particular interest, as it is generally correlated with the metal abundance of the cluster, but not perfectly so. These departures from a simple one-to-one mapping of metal abundance onto horizontal-branch shape are known as the “second-parameter problem”—a riddle of some forty years’ standing that has been intensively debated, but is still without a unique, generally accepted solution. It is not our intent here to pursue this debate, and so we omit a discussion of the literature, but see Catelan (2005) for a recent discussion and references. However, it is still useful to quantify the morphology of the horizontal branch in NGC 4147 so that it may take its place in future discussions. In the absence of notable clumps, gaps, extensions, or bimodality, the HB of NGC 4147 can be adequately characterized by the canonical ratio where , , and are, respectively, the number of stars on the blue HB, the number of RR Lyrae variables, and the number of stars on the red HB. For this estimate we consider all stars within 200′′ of the cluster center without regard to photometric uncertainty or separation index. We define the blue HB as all stars with and (cf. Fig. 5); the red HB as all stars with and ; and the RR Lyraes are those discussed in §5 except V19, which lies beyond 200′′ from the cluster center. With these definitions, the counts are . The number of stars on the red HB is possibly overestimated, because at these colors the inclusion of a field star or two is a possibility; furthermore, it is possible that one or two giants have been scattered into the zone by photometric errors or crowding. Assuming that the red HB stars have been overcounted by some number in the range 0–4, then . This revises slightly downward the HB type recently provided for the cluster by Mackey & van den Bergh (2005), namely +0.66, but is equal to the value tabulated in the Harris (1996) catalog, +0.55.


There are other parameters that provide more detailed information on the density and extent of the blue HB “tail,” such as (where , , and are the same as before, but is the number of blue HB stars bluer than mag), and (the difference in magnitude between the 10% faintest and the 10% brightest blue HB stars). These indices are defined and their interpretation is discussed in Buonanno (1993), Buonanno et al. (1997) and Catelan et al. (2001). From the same data set as before, and , and .
4.5. Comparison of the Cluster and Field Populations
Fig. 17 presents the B–V versus V–I color-color diagram for likely cluster members with the same selection as before:
plus the standard error of each color mag, and . Fig. 18 presents the same color-color diagram for the likely field population, defined as all stars more distant than 200′′ from our adopted cluster center, with color errors mag and . As a further wrinkle, here we have plotted detections with a sharpness index as crosses, and those with sharp as empty circles. These latter should be almost exclusively background galaxies. Here we see that the color-color sequence for the field dwarf stars bends in a direction quite different from that followed by the cluster giants (Fig. 17). This effect has been noted before (e.g., Stetson et al. 2003), and it provides a possible means of distinguishing foreground dwarfs from cluster giants, at least for the reddest stars. The possibility of mistaking a field galaxy for a cluster giant on the basis of this two-color diagram appears to be somewhat greater. It is worth noting that there are a few blue stars in the field that could conceivably be cluster blue horizontal-branch stars at large radii. As noted previously (e.g., Stetson et al. 2004), the blue star that lies well off the mean color-color ridge line at is most likely a photometric mistake or, possibly, a non-stellar object. Note also that variable candidate V18 falls well to the left of the main band of field stars at the same B–V color. This strengthens the case for it being a giant-star member of the cluster.

We adopted 200′′ as the outer radius for our cluster sample only because Fig. 6 seemed to indicate a break in the density profile of the cluster at that distance. The Harris (1996) compilation indicates an estimated tidal radius slightly in excess of 6 for NGC 4147. Fig. 19 is a CMD for the same objects as in the field color-color diagram, Fig. 18 above. As before, probable non-stellar objects with are plotted as empty circles. Here it is clear that the cluster main sequence is still populated beyond a radius of 200′′, and one of the blue stars in the field has the right apparent magnitude for a position on the cluster’s ZAHB. Even at distances greater than 6, it is still possible to see an apparently significant overdensity of stars near the location of the cluster turnoff (Fig. 20). At these radii we are in the regime where the detection limit is becoming brighter again, due to the smaller number of images covering this part of the field. This may explain the paucity of main-sequence stars below the turnoff. However, in the absence of radial velocities, proper motions, or other supporting measurements, we are unwilling to press this as evidence for an extra-tidal population at this time. We can also see from this figure that none of the other blue stars in the field appears to belong to the cluster horizontal branch. We have also searched for evidence for more short-period variables in the NGC 4147 field and have found only one: the candidate we have provisionally named V19 at some 4′.5 from the cluster center.

5. VARIABLE STARS
5.1. Astrometry
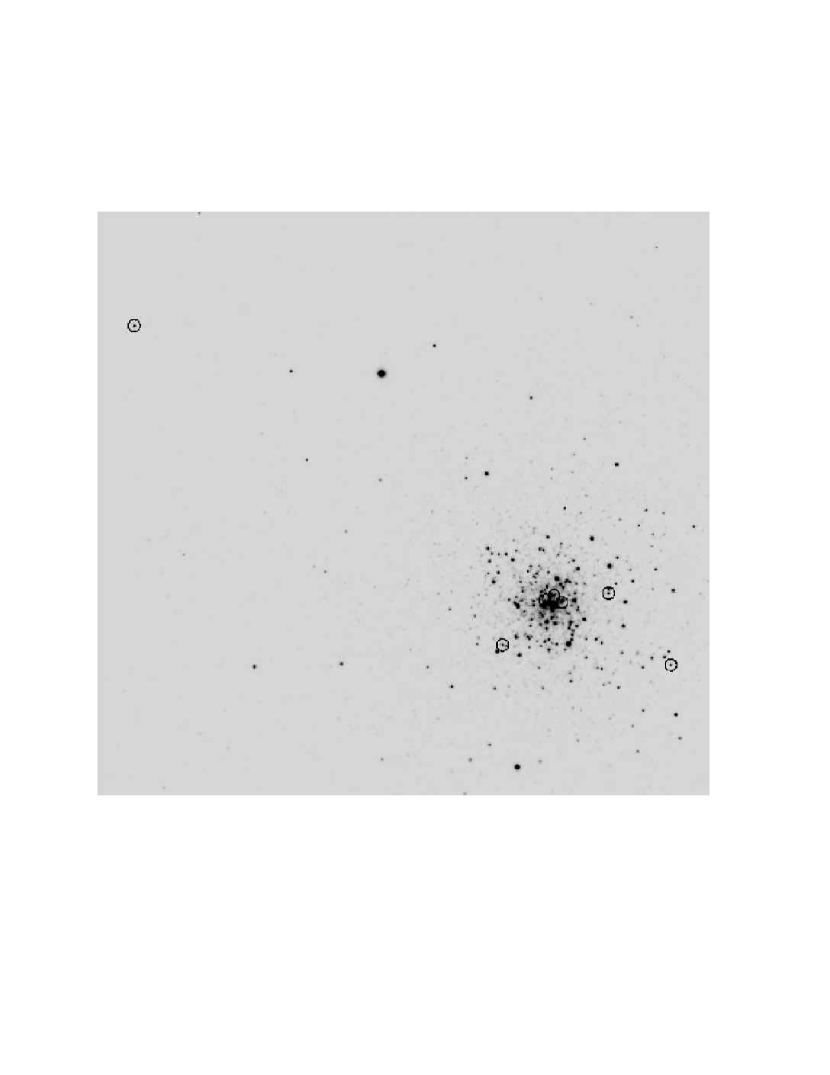
Table 7 lists astrometric positions for the variable-star candidates in NGC 4147. The first column is the star identification, followed by the star’s right ascension and declination as of equinox J2000.0. Then comes the star’s rectilinear coordinates, in units of arcseconds with increasing east and increasing north, relative to our adopted reference point of 1013s.79, 3122′′.4 (J2000). The last two columns give the star’s differential position with respect to our best estimate of the cluster center: (–106.0,+71.0) in our coordinate system, or 1006s.34, 3233′′.4 (J2000) in celestial coordinates. Candidates V1–V18 have been discussed previously in the literature, as mentioned in the Introduction. We have discovered a new probable c-type RR Lyrae star in the field of NGC 4147, which we provisionally name V19, pending approval by higher authorities. This star is marked by the uppermost, leftmost circle in Fig. 21. The star is also visible in Plate I of Sandage & Walker (1955): it is the black dot about 27 mm to the right and 9 mm above star I-3. Our best light curve for the star, phased according to a derived period of 0.273 933 d, is shown here as Fig. 22.
| ID | RA | Dec | ||||
|---|---|---|---|---|---|---|
| 2000.0 | 2000.0 | |||||
| V1 | 12 09 59.38 | +18 31 48.4 | –204.9 | +26.1 | –98.9 | –44.9 |
| V2 | 12 10 04.96 | +18 32 04.5 | –125.6 | +42.1 | –19.6 | –28.9 |
| V3 | 12 10 04.38 | +18 31 58.4 | –133.9 | +36.0 | –27.9 | –35.0 |
| V4 | 12 10 06.39 | +18 32 50.1 | –105.2 | +87.7 | +0.8 | +16.7 |
| V5 | 12 10 07.38 | +18 32 35.1 | –91.2 | +72.7 | +14.8 | +1.7 |
| V6 | 12 10 08.51 | +18 33 00.0 | –75.2 | +97.6 | +30.8 | +26.6 |
| V7 | 12 10 06.66 | +18 32 39.7 | –101.5 | +77.3 | +4.5 | +6.3 |
| V8 | 12 10 06.95 | +18 32 34.8 | –97.3 | +72.4 | +8.7 | +1.4 |
| V9 | 12 10 08.24 | +18 32 59.7 | –78.9 | +97.3 | +27.1 | +26.3 |
| V10 | 12 10 03.74 | +18 31 48.4 | –142.9 | +26.0 | –36.9 | –45.0 |
| V11 | 12 10 05.53 | +18 31 51.8 | –117.4 | +29.4 | –11.4 | –41.6 |
| V12 | 12 10 06.70 | +18 32 28.4 | –100.9 | +66.0 | +5.1 | –5.0 |
| V13 | 12 10 06.37 | +18 32 14.1 | –105.5 | +51.7 | +0.5 | –19.3 |
| V14 | 12 10 06.94 | +18 32 32.4 | –97.4 | +70.0 | +8.6 | –1.0 |
| V15 | 12 10 07.00 | +18 32 24.8 | –96.6 | +62.4 | +9.4 | –8.6 |
| V16 | 12 10 07.35 | +18 32 40.1 | –91.6 | +77.7 | +14.4 | +6.7 |
| V17 | 12 10 10.67 | +18 34 51.2 | –44.4 | +208.8 | +61.6 | +137.8 |
| V18 | 12 10 05.63 | +18 32 11.6 | –116.1 | +49.2 | –10.1 | –21.8 |
| V19 | 12 10 21.98 | +18 35 02.0 | +116.4 | +219.6 | +222.4 | +148.6 |
| C1 | 12 10 01.77 | +18 32 00.5 | –170.9 | +38.1 | –64.9 | –32.9 |
| C2 | 12 10 04.11 | +18 32 38.9 | –137.6 | +76.5 | –31.6 | +5.5 |
| C3 | 12 10 05.88 | +18 32 34.0 | –112.5 | +71.6 | –6.5 | +0.6 |
| C4 | 12 10 06.17 | +18 32 37.6 | –108.4 | +75.2 | –2.4 | +4.2 |
| C5 | 12 10 06.38 | +18 32 36.1 | –105.4 | +73.7 | +0.6 | +2.7 |
| C6 | 12 10 06.51 | +18 32 35.2 | –103.5 | +72.8 | +2.5 | +1.8 |
| C7 | 12 10 08.11 | +18 32 11.1 | –80.9 | +48.7 | +25.1 | –22.3 |
5.2. Periods
We summarize the published and present best periods for each of the variable candidates in Table 8. As always with RR Lyrae stars, there is some ambiguity in the period determinations due to the uncertain number of cycles that take place in the dark ages between successive observing seasons. For instance, the difference between Newburn’s (1957) period of 0.492 39 d for V2 and Mannino’s (1957) period of 0.493 06 d for the same star represents the difference between 741.7 cycles per year and 740.7 cycles per year. We believe that the combination of AF04’s dense string of observations in the first half of 2003 and our own sparser string of observations spanning 1983–2003 (but mostly 1992–2003) offers the best available chance of resolving those difficulties. Accordingly, in the penultimate column of Table 8 we list the best—in our judgment—“modern” periods for the candidates, based upon our analysis of the union of the AF04 data with our own. Similarly, for completeness we list ancient periods for the same stars based upon our reanalysis of the union of Newburn’s data with Mannino’s, where possible, or Newburn’s data alone for stars not observed by Mannino. In obtaining the ancient periods, we chose the cycle count that implied a period closest to the modern period. In most cases, that turned out to be the same best period as was found in a blind search, although not always.
5.3. Comments on Individual Stars
A few of the variables represent special problems, and we discuss them individually here.
V2: The Newburn and Mannino data do not phase well together for any period in the range 0.20–0.80 d. The period indicated here is the least bad. The modern data agree better, but with some indication of a varying amplitude such as is typical of the Blazhko effect (see AF04, Fig. 2).
| ID | Newburn | Mannino | Arellano Ferro | This study | modern data | older data |
|---|---|---|---|---|---|---|
| (1957) | (1957) | et al. (2004) | ||||
| V1 | 0.500 38 | 0.500 3860 | 0.500 38 | 0.500 403 | 0.500 399 | 0.500 38 |
| V2 | 0.492 39 | 0.493 06 | 0.493 25 | 0.493 180 | 0.493 182 | 0.493 12 |
| V3 | 0.281 58 | 0.280 542 | 0.280 58 | 0.280 542 7 | 0.280 542 9 | 0.280 54 |
| V4 | 0.300 97 | — | 0.299 22 | 0.300 031 | 0.300 033 | 0.300 03 |
| V5 | 0.341 25 : | — | not var. | not var. | not var. | not var. |
| V6 | 0.618 60 | — | 0.609 75 | 0.609 730 | 0.609 732 | 0.609 69 |
| V7 | 0.512 94 | — | 0.514 39 | 0.514 245 | 0.514 243 | 0.514 31 |
| V8 | 0.389 7 : | — | 0.278 61 | 0.278 652 | 0.278 651 | 0.278 64 |
| V10 | 0.351 98 | 0.352 314 | 0.352 33 | 0.352 301 | 0.352 300 7 | 0.352 31 |
| V11 | 0.387 36 | 0.387 39 | 0.387 45 | 0.387 419 | 0.387 431 | 0.387 39 |
| V12 | 0.5 : | — | 0.504 61 | 0.504 700 | 0.504 701 | 0.504 67 |
| V13 | 0.375 9 : | — | 0.408 13 | 0.408 320 | 0.408 318 | 0.408 29 |
| V14 | 0.525 5 : | — | 0.259 50 | 0.356 376 | 0.356 372 | 0.356 38 |
| V15 | 0.335 4 : | — | not var. | not var. | not var. | not var. |
| V16 | 0.277 5 : | — | 0.369 4 | 0.372 259 | 0.372 261 | 0.372 09 |
| V17 | 0.375 86 | 0.374 73 | 0.374 94 | 0.371 229 | 0.374 952 | 0.374 84 |
| V18 | — | — | 0.492 05 | not var. | not var. | — |
| V19 | — | — | — | 0.273 933 | — | — |
V4: AF04 report a best period of 0.299 22 d for this star, revised from the value 0.300 97 d of Newburn. Our own reanalysis of the AF04 - and -band data considered in isolation derives a best period of 0.300 04 d, closer to the value 0.300 031 d that we derive from an analysis of our data alone, and to 0.300 033 d that we derive from the merger of our data with those of AF04. In all cases, however, there is appreciable dispersion in magnitude at all phases of the light curve, suggesting some wander in the epoch of zero phase.
V5, V9, V15: We concur with the judgment of Newburn (V9) and AF04 that these stars do not appear to be varying. The heading of Mannino’s Tabella II states that candidate V15 was one of the stars he studied. This must be a typographical error: the body of the text, Tabella I, and Mannino’s derived period all indicate that candidate V17 was the one he investigated.

V6: The merest hint of the striking amplitude variations exhibited in the AF04 light curve is seen in our data.
V8: There is a systematic magnitude offset between our data and those of AF04: we measure it 0.10 mag brighter in and 0.14 mag brighter in than they. We have applied these offsets to their photometry before combining it with ours to derive the modern period listed in Table 8 and the Fourier components discussed below.

V11: A significant number of data points in , and do not phase up with the rest. In Fig. 23 these are visible as the striking arc of points above the main body of the light curve between phases of 0.2 and 0.4. The slope is right but the phase is wrong. There is even a hint of something similar happening at the same phase in the -band light curve. (The small scatter of points below the light curves are the sort of behavior one sees when the star falls very near the edge of the CCD or on a cosmetic blemish in individual images. These anomalies are less likely to be astrophysically significant, and our robust fitting teechniques effectively ignore them.) Upon closer investigation, we found that these discrepant points come from two periods of time: (a) before HJD 2,448,500 (i.e., observing runs “nbs,” “igs,” “c90c17,” “c90ic02, and “rdj,” which took place up to and including April 1991; V11 did not fall within the field covered during the “rld” observing run in May 1991, and the “jvw” run in March/April 1996 did not produce any observations in the crucial phase range 0.2–0.4); and (b) observing run “‘arg02,” which took place in May 2002 (observing runs “bono” and “hannah,” which took place during the same observing season, did not have any coverage in the phase range 0.2–0.4). There is no other evidence for this anomaly after the summer of 1991.

V12: We have a serious disagreement with AF04 concerning the amplitude of variation in and (Fig. 24). The peculiar flat-bottomed appearance of our light curves strongly suggests that we have confounded V12 with a companion that AF04 successfully distinguished from the variable.
V13: We are not able to phase our data with a period near that of AF04. From our data we get reasonable, although somewhat noisy, light curves for a period of 0.408 320 d, in contrast to their period of 0.408 13 d. Our second-best period in the range 0.2–0.408 2 d is 0.407 866 d, and it is appreciably worse than the other one. Conversely, the AF04 data do not phase at all well for any period in the range 0.408 2–0.8 d.
V16: Our data in the , , and filters phase reasonably well for a period near that found by AF04, but the data in the filter do not. By experimenting, we found that by considering only the data taken before HJD 2,450,000 (October 9, 1995), we were able to get reasonable light curves in all filters for a period of 0.372 25 d, which is close to our overall best period. Conversely, for the data taken since then, including the AF04 data, the best period is 0.372 88 d, with a small amount of enhanced scatter in the -band light curve.
V17: Like the case with V11 and V16, in and our data phase well with AF04’s for a period very near their derived value, but a small percentage of the data are out of phase. (The -band data for this star are comparatively poor, but they appear to dislike this period, too.) Here, the optimum slice point seemed to be near HJD 2,451,000 (July 5, 1998). For the data from earlier than that date, quite nice light curves were obtained for a period of 0.371 222 d; the later data, which are dominated by AF04, indicate a best period of 0.374 944 d with amplitude variations. There is also a slightly more complicated scenario. (1) If we take our data from before HJD 2,450,000, they can be reasonably well fit with a period of 0.374 8 d. A period of 0.371 2 d is not as good. (2) In the data taken between 2,450,000 and 2,450,999 there are a number of reasonable periods: one of them is around 0.374 8 d and, again, 0.371 2 d is not as good. (3) But if we try to phase these two groups together, there is no single period that works well. (4) If we try to phase all our data from after 2,450,000, but not the AF04 data, the comparatively few points obtained after 2,451,000 could not be well phased with those obtained earlier at any period. Conclusion: It seems that each major group (the Mannino data, the Newburn data, our pre-2,450,000 data, our 2,450,000-999 data, the AF04 data), taken by itself, can be well fit with a period in the range 0.374 8 d to 0.374 9 d. It is only when we seek to combine the data sets over a long time interval that a 0.371 2 d period appears. This suggests that we have some sort of phase jumps or short-lived period changes that we do not record well, but that the main period does not really change very much.

V18: Candidate variable V18 was identified by AF04 and was thought by them to be a likely foreground RR Lyrae variable projected onto the cluster core. We used our software to examine our data for any plausible periodicities in the range 0.20 d to 0.80 d. Fig. 25 presents the light curve corresponding to the most plausible periodic variation found, with a period of 0.324d. In presenting this figure, we have resisted the temptation to edit out by hand those magnitude measurements that are obviously discrepant. As the CMDs of the previous section have shown, this star is by a significant margin the brightest one in the direction of the main body of the cluster. It is very likely that this star is near or above the saturation level of the detector in some of the long-exposure images, especially for the longer-wavelength filters. It may also have fallen near the edge of the CCD or on a cosmetic blemish in some of the exposures. The star is close to the center of the cluster, and our reconstruction of the scene splits the image of V18 into three components, with companions separated by 0′′.2 and 0′′.9 from the primary star. The reality of the second and third components of the blend may reasonably be doubted, but their presence and astrometric positions—inferred from the best-seeing images available—have been uniformly assumed in poorer-seeing images as well. Differing seeing conditions can quite easily lead to the attribution of different fractions of the photons to different components of the optical blend in different images. In any long list of automatically derived photometry there will always be some corrupt measurements. However, our robust software has been designed to reduce the weight of grossly discrepant data points unless it can find some way to phase them up into the reasonable semblance of a light curve. A periodicity search extended out to a possible period as large as 1000 d turned up a statistically slightly more significant periodicity of 32.99 d for V18, but that light curve was no more visually satisfying than Fig. 25. Our conclusion is that the star may or may not be be varying (we suspect it isn’t), but we certainly can not infer the physical nature of any intrinsic variation from the data in hand.
V19: This star was not previously recognized as a variable candidate, so it has no previous time-resolved photometry in the literature. The light curve fit to our data is noisy, and can be slightly improved if we assume two periodicities rather than one or, alternatively, a change of period or discontinuous jump in phase during the time span covered by our observations. The available data do not permit a definitive conclusion, and the period that we have tabulated seems to be a reasonable compromise.
It is probably noteworthy that the four most anomalous variables, V11, V13, V16, and V17, have best periods of 0.39, 0.41, 0.37, and 0.37 d, respectively. These relatively long RRc periods suggest that the erratic phasing may have something to do with a blending of the fundamental and first overtone pulsation modes. However, although the fits to the light curves of these stars might be marginally improved by double-mode solutions, in no case do we see conclusive evidence for genuine double-mode behavior.
Comparison of the older and modern periods for the NGC 4147 RR Lyrae variables (Table 8) indicates that some of the variables have undergone real period changes over the past half century. Neglecting V17, for which the long-term period behavior is perhaps uncertain, the mean period change for the thirteen remaining variables is +0.5 days per million years. This is a large average period change compared to theoretical expectations (Catelan 2005 and references therein). However, RR Lyrae stars are known to exhibit “noisy” period changes as well as the longer-term period changes expected from evolution (e.g., Rathbun & Smith 1997). It is likely that observations spanning half a century do not yet reveal the true evolutionary period changes of the NGC 4147 RR Lyrae stars.
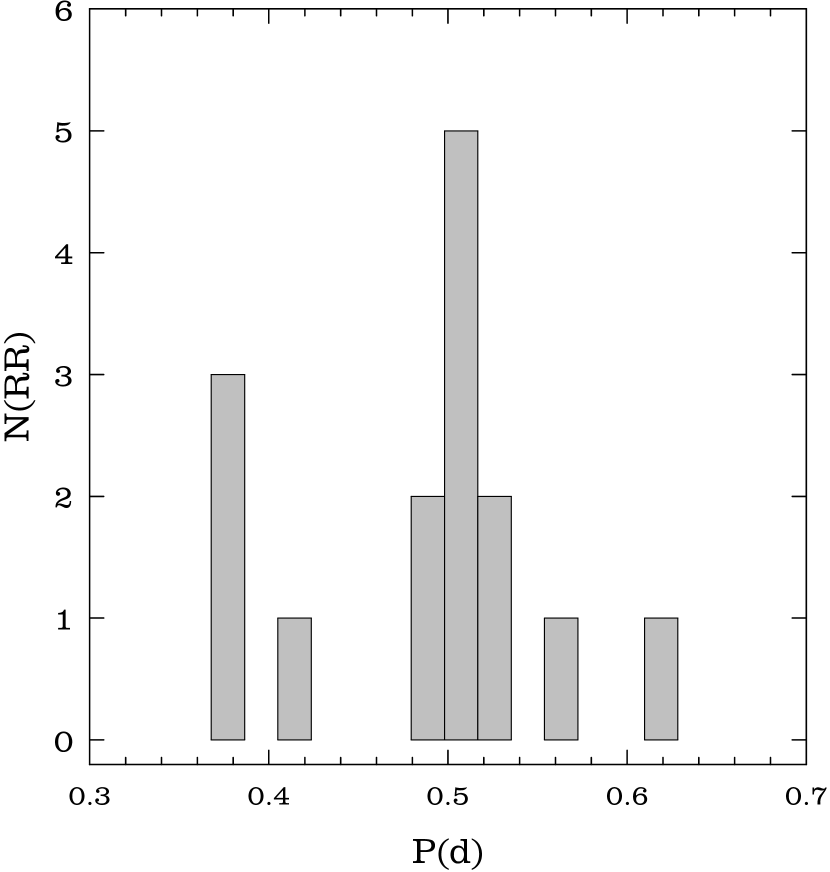
5.4. RR Lyrae Specific Frequency and Period Distribution
The revised number of RR Lyrae stars in NGC 4147 also leads to a revision of its specific RR Lyrae fraction, defined as , where (Harris 1996) is the cluster’s integrated absolute magnitude in . With , we find , compared to 30.8 in the current version of the Harris catalog. With this result, NGC 4147 now has one of the highest values known, falling behind only six other Galactic globular clusters.
In Fig. 26 we show a histogram of the RR Lyrae pulsation periods in NGC 4147. The RRc periods were “fundamentalized” by adding 0.128 to their values. As can be clearly seen, there is a sharp peak in the period distribution at a period around d. Such a peaked period distribution is not uncommon among Galactic globular clusters, as discussed by Rood & Crocker (1989) and Catelan (2004a). The origin of this phenomenon is unclear at present, but it does suggest that the full width of the instability strip is not uniformly populated. The reader is referred to the quoted papers, as well as to Castellani et al. (2005), for critical discussions.
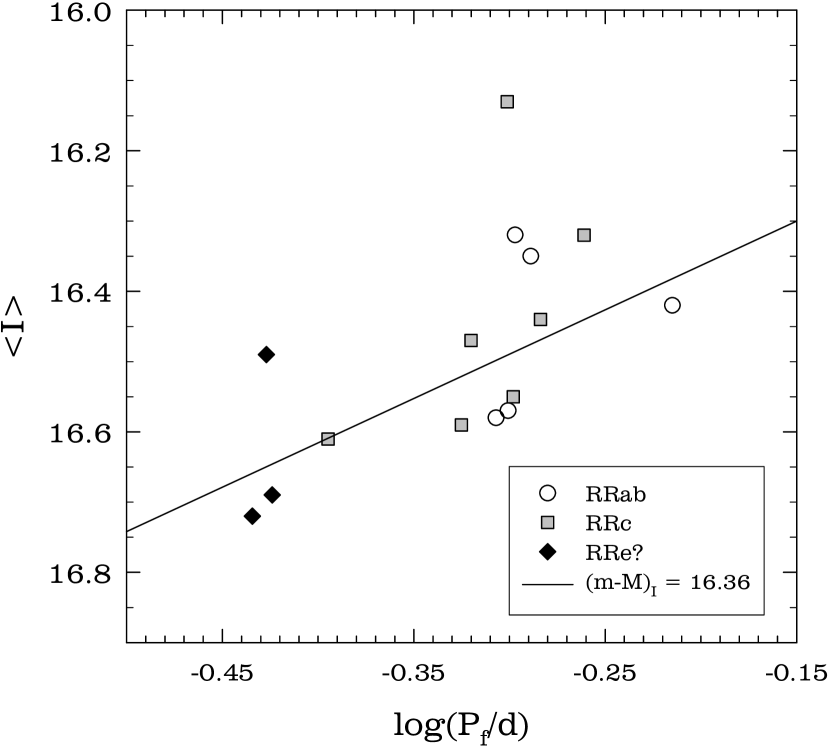
| ID | ||||||||
|---|---|---|---|---|---|---|---|---|
| V1 | 17.26 | 17.00 | 16.80 | 16.57 | 0.69 | 0.26 | 0.20 | 0.43 |
| V2 | 17.21 | 17.03 | 16.81 | 16.58 | 0.63 | 0.17 | 0.22 | 0.45 |
| V3 | 17.18 | 17.00 | 16.86 | 16.69 | 0.49 | 0.18 | 0.14 | 0.31 |
| V4 | 17.19 | 16.97 | 16.80 | 16.61 | 0.58 | 0.22 | 0.17 | 0.36 |
| V6 | 17.22 | 16.92 | 16.66 | 16.42 | 0.80 | 0.30 | 0.26 | 0.50 |
| V7 | 17.08 | 16.80 | 16.59 | 16.35 | 0.73 | 0.28 | 0.21 | 0.45 |
| V8 | 17.11 | 16.86 | 16.68 | 16.49 | 0.62 | 0.25 | 0.18 | 0.37 |
| V10 | 17.25 | 16.99 | 16.81 | 16.59 | 0.66 | 0.26 | 0.17 | 0.40 |
| V11 | 17.09 | 16.86 | 16.64 | 16.44 | 0.65 | 0.23 | 0.22 | 0.42 |
| V12 | 17.16 | 16.80 | 16.51 | 16.32 | 0.84 | 0.36 | 0.29 | 0.48 |
| V13 | 16.93 | 16.66 | 16.52 | 16.32 | 0.61 | 0.27 | 0.14 | 0.34 |
| V14 | 17.22 | 16.94 | 16.72 | 16.47 | 0.75 | 0.28 | 0.22 | 0.47 |
| V16 | 16.89 | 16.57 | 16.38 | 16.13 | 0.76 | 0.32 | 0.19 | 0.44 |
| V17 | 17.16 | 16.93 | 16.75 | 16.55 | 0.61 | 0.23 | 0.18 | 0.38 |
| V19 | 17.19 | 17.03 | 16.88 | 16.72 | 0.47 | 0.16 | 0.15 | 0.31 |
5.5. Physical Properties of the Variable Stars
Table 9 contains the flux-weighted mean magnitudes for the variable candidates that we obtained by integrating over the fitted light curves. Here we have omitted candidates V5, V9, V15, and V18, because we were unable to fit reasonable light curves to the available data. For those variables with ambiguous periods, we have used the light curve corresponding to the best single period that characterized all our observations, without reference to AF04 or any other sources of data. Similarly, Table 10 lists our derived total amplitudes for the perceived variation in the four photometric bandpasses for each of the variable stars. For stars with Blazhko-like symptoms, these represent average amplitudes; we feel that longer and more nearly continuous strings of observations would be needed before extremes of amplitude could be reliably determined. It is important to note that the mean magnitudes (Table 9) are based upon a light-curve analysis of our data only, while the amplitudes (Table 10) are based on a similar light-curve analysis of our data merged with those of AF04. We chose to do it this way so that our mean magnitudes for the variable candidates would be on exactly the same photometric system as our results for the rest of the stars in the cluster field. Since the amplitude determination is fundamentally differential in nature, it would be less affected if the photometry of AF04 is on a system that differs from ours by a few hundredths of a magnitude, and would also benefit from the more densely populated light curves.
| ID | ||||
|---|---|---|---|---|
| V1 | 1.37 | 1.15 | 0.95 | 0.70 |
| V2 | 1.21 | 1.02 | 0.81 | 0.65 |
| V3 | 0.62 | 0.51 | 0.39 | 0.31 |
| V4 | 0.56 | 0.45 | 0.38 | 0.33 |
| V6 | 1.50 | 0.85 | 0.86 | 0.63 |
| V7 | 1.19 | 1.06 | 0.91 | 0.39 |
| V8 | 0.52 | 0.40 | 0.29 | 0.24 |
| V10 | 0.55 | 0.40 | 0.29 | 0.24 |
| V11 | 0.60 | 0.41 | 0.34 | 0.25 |
| V12 | 1.33 | 1.12 | 0.95 | 0.79 |
| V13 | 0.50 | 0.45 | 0.35 | 0.34 |
| V14 | 0.45 | 0.37 | 0.26 | 0.23 |
| V16 | 0.49 | 0.21 : | 0.32 | 0.23 |
| V17 | 0.50 | 0.34 | 0.29 | 0.22 |
| V19 | 0.31 | 0.28 | 0.21 | 0.14 |
Table 11 lists selected Fourier parameters extracted from our fitted light curves. Following traditional practise in the field, we have performed a sine decomposition for the ab-type variables (P0.45 d, in this case), and a cosine decomposition for the c-type variables (see, e.g., Corwin et al. 2003). All Fourier components up to and including the eighth were computed for the ab-type variables, and up to and including the sixth for the shorter-period c-type variables. However, for compactness here we list only the astrophysically most interesting parameters. Table 12 lists physical parameters of the ab-type variables, as based on the empirical analyses by Jurcsik & Kovács (1996) and others (see Corwin et al. for extensive references). Table 13 presents physical properties of the c-type variables, as inferred from comparison to Fourier analyses of theoretical light curves extracted from hydrodynamic pulsation models (e.g., Simon & Clement 1993). These have been computed as explained by Corwin et al. Note that validity of the Simon & Clement results for RRc variables has recently been questioned by Catelan (2004b). Also, for the RRab variables, the physical parameters should be taken seriously only for those with the Jurcsik & Kovács compatibility parameter .
| ID | Note | |||||||
|---|---|---|---|---|---|---|---|---|
| ab-type variables | ||||||||
| V1 | 0.438 | 0.400 | 0.294 | 0.194 | 2.22 | 4.70 | 0.99 | |
| V2 | 0.384 | 0.564 | 0.254 | 0.107 | 2.09 | 4.01 | 5.77 | |
| V6 | 0.318 | 0.475 | 0.305 | 0.182 | 2.46 | 5.23 | 1.66 | |
| V7 | 0.364 | 0.499 | 0.367 | 0.272 | 2.33 | 4.81 | 1.12 | |
| V12 | 0.428 | 0.378 | 0.291 | 0.198 | 2.44 | 4.81 | 0.94 | all modern data |
| V12 | 0.786 | 0.616 | 0.282 | 0.090 | 3.34 | 0.46 | 4.27 | AF04 data only |
| c-type variables | ||||||||
| V3 | 0.241 | 0.224 | 0.061 | 0.023 | 4.63 | 1.16 | ||
| V4 | 0.214 | 0.185 | 0.062 | 0.067 | 4.55 | 5.09 | ||
| V8 | 0.189 | 0.199 | 0.067 | 0.018 | 4.62 | 0.63 | ||
| V10 | 0.212 | 0.096 | 0.045 | 0.037 | 4.55 | 2.71 | ||
| V11 | 0.194 | 0.032 | 0.102 | 0.042 | 6.07 | 2.66 | ||
| V13 | 0.222 | 0.046 | 0.143 | 0.111 | 5.03 | 3.40 | ||
| V14 | 0.182 | 0.100 | 0.109 | 0.075 | 5.06 | 0.95 | ||
| V16 | 0.082 | 0.505 | 0.309 | 0.588 | 4.06 | 0.94 | ||
| V17 | 0.170 | 0.116 | 0.152 | 0.022 | 4.82 | 6.08 | ||
| V19 | 0.144 | 0.157 | 0.054 | 0.101 | 3.73 | 0.44 | ||
| ID | [Fe/H] | Note | ||||
|---|---|---|---|---|---|---|
| V1 | 46.1 | –1.42 | 0.80 | 0.304 | 0.449 | |
| V2 | 162. | –2.30 | 0.76 | 0.310 | 0.457 | |
| V6 | 3.21 | –1.29 | 0.76 | 0.348 | 0.506 | |
| V7 | 3.93 | –1.34 | 0.82 | 0.331 | 0.482 | |
| V12 | 46.4 | –1.29 | 0.81 | 0.306 | 0.452 | all modern data |
| V12 | 164. | –1.13 | 0.19 | 0.223 | 0.349 | AF04 only |
| ID | Mass | |||
|---|---|---|---|---|
| V3 | 0.624 | 1.674 | 3.870 | 0.282 |
| V4 | 0.683 | 1.717 | 3.865 | 0.267 |
| V8 | 0.771 | 1.720 | 3.866 | 0.263 |
| V10 | 0.568 | 1.728 | 3.861 | 0.270 |
| V11 | 0.436 | 1.699 | 3.862 | 0.286 |
| V13 | 0.509 | 1.752 | 3.856 | 0.267 |
| V14 | 0.493 | 1.699 | 3.863 | 0.282 |
| V16 | 0.660 | 1.780 | 3.855 | 0.252 |
| V17 | 0.554 | 1.743 | 3.858 | 0.266 |
| V19 | 0.625 | 1.666 | 3.872 | 0.284 |
We are reluctant to give undue emphasis to the physical parameters derived from Fourier decomposition because (i) the RRc relations are based on formulae that appear to be incapable, for instance, of simultaneously providing masses and luminosities (i.e., they incorrectly predict the period-mean density relation, Catelan 2004b), and (ii) the criterion which is used to refine the RRab sample is also suspect, since it fails to effectively eliminate Blazhko variables (e.g., Cacciari et al. 2005). Nevertheless, accepting the results in Table 13 at face value, they imply a mean mass for the RRc variables of 0.59 M⊙, a mean luminosity of 1.72, and a mean effective temperature of 7300 K. We can compare these results with those compiled by Corwin et al. for several clusters. The mean effective temperature appears consistent with the cluster metallicity (indeed, with any [Fe/H] value in the range –1.5 to –1.9). The same conclusion applies to the mean mass, although the luminosity is most consistent with an abundance close to the metal-rich end of this range. Among the clusters listed by Corwin et al., these physical properties place NGC 4147 close to the boundary dividing the Oo I class from Oo II—again, between M 3 and M 55.
In the case of the RRab stars (Table 12), we are hampered by the fact that only two of them satisfy the nominal acceptance criterion, . From these we find a mean metallicity [Fe/H] = –1.32 on the Jurcsik (1995) metallicity scale ( on the Zinn & West scale), and an absolute visual magnitude of 0.79. The inferred metallicity is, of course, somewhat high compared to published values and compared to our photometric indicators discussed above. The derived absolute magnitude seems only marginally brighter (by 0.02 mag–0.03 mag) than what has been found by the same method for metal-intermediate Oo I clusters, but fainter than what was found for M 55 (Oo II) by some 0.1 mag. Again, we stress that these conclusions are rendered more than normally uncertain by the fact that they are derived from only two seemingly acceptable RRab stars, at least one of which—V6—appears to show a varying amplitude.
5.6. Possible Second-Overtone Variables and the Period-Luminosity Relation in
Fig. 26 above also reveals the presence of a peak in the RR Lyrae period distribution at a period d, corresponding to short-period variables with periods d. As discussed by Alcock et al. (1996) and Clement & Rowe (2000), this is the period range characterizing candidate second-overtone RR Lyrae (RRe) stars. However, Kovács (1998) argues that such variables may be more naturally explained as the short-period wing of the RRc distribution.
One possible way to constrain the RRe possibility is to check the position of the candidate second-overtone stars in the (fundamentalized) period-luminosity diagram. In Fig. 27 we show such a diagram, based on our -band mean magnitudes (§5.5 above) and the “modern” periods (§5.2), with the pulsation type indicated for each star. Even though the candidate RRe stars have been fundamentalized as if they were actually first-overtone pulsators, they still seem to follow the trend defined by the RRc and RRab stars, thus suggesting that they may indeed be more straightforwardly explained as short-period RRc stars; see also Catelan 2004b for a similar argument in the cases of IC 4499 (= C1452-820) and M 92 (= NGC 6341 = C1715+432). Note also that, in contrast with the very small amplitudes that characterize candidate RRe stars (Clement & Rowe 2000), the three stars with the shortest periods in Fig. 27 do not appear to show unusually small amplitudes, thus further supporting the likelihood that they are simply short-period RRc stars.
The sloping solid line in Fig. 27 is the predicted theoretical relation for a metallicity , corresponding to a for an assumed -element enhancement of (see Salaris et al. 1993). This theoretical result is based on Eqs. (1) and (2) and Table 9 in Catelan et al. (2004). A distance modulus mag has been assumed (Harris 1996; readers will recall that Harris’s tabulated value for in NGC 4147 agreed extremely well with ours), corresponding to mag and (as indicated in the plot) mag. As can be seen, there is excellent agreement between the distance modulus tabulated in the Harris catalog and the Catelan et al. theoretical calibration. This result can be compared with that obtained on the basis of the same models from the ZAHB estimate provided in §4.2. There we found that , whereas the Catelan et al. models give . This implies a distance modulus , in perfect agreement with the Harris (1996) catalog and with the analysis of the -band period-luminosity relation.
5.7. Non-Variable Stars near the Instability Strip
Table 7 above also lists positions for seven stars in the field of NGC 4147 that appear to be non-varying even though they lie very near the instability strip in the ground-based data. They were selected by the criteria
′′,
, and
These possibly constant stars are also marked in Fig. 21. They have been numbered C1 through C7 in order of increasing right ascension, that is, from right to left in the finding chart. Stars C1, C2, and C7 are clearly visible in the figure but C3 through C6 are in the crowded cluster center. As mentioned above, stars V5, V9, and V15 are most likely not variables. These, then, are three more apparently non-varying stars near the instability strip. We list the photometric indices of these stars in Table 14. It seems that apparently constant stars C2, V5, and V15, on the one hand, and variable stars V2, V3, and V19, on the other (Table 9), delimit the blue edge of the instability strip quite precisely at B–V = 0.17 or , with an uncertainty of or less. These stars are all quite reasonably uncrowded, with .
| ID | B–I | B–V | V–R | V–I | |
|---|---|---|---|---|---|
| Ground-based data | |||||
| C1 | 16.9330.0009 | 0.9960.0034 | 0.3990.0030 | 0.2930.0017 | 0.5970.0019 |
| C2 | 16.9830.0018 | 0.4280.0044 | 0.1720.0040 | 0.1000.0026 | 0.2560.0032 |
| C3 | 17.0310.0047 | 0.6100.0120 | 0.2080.0084 | 0.1850.0068 | 0.4020.0108 |
| C4 | 16.8290.0043 | 0.4410.0120 | 0.1180.0110 | 0.1230.0082 | 0.3230.0078 |
| C5 | 17.1220.0035 | 0.6380.0146 | 0.1850.0121 | 0.2230.0071 | 0.4530.0095 |
| C6 | 16.9380.0061 | 0.4970.0156 | 0.1340.0119 | 0.1590.0088 | 0.3630.0133 |
| C7 | 16.9000.0014 | 0.9040.0039 | 0.3570.0038 | 0.2600.0022 | 0.5470.0023 |
| V5 | 16.9610.0032 | 0.4820.0092 | 0.1870.0077 | 0.1270.0041 | 0.2950.0067 |
| V9 | 17.0170.0015 | 0.3050.0059 | 0.1070.0042 | 0.0680.0027 | 0.1980.0046 |
| V15 | 16.9810.0028 | 0.4540.0060 | 0.1730.0053 | 0.1230.0040 | 0.2810.0049 |
| V18 | 13.9290.0065 | 2.9820.0170 | 1.4440.0127 | 0.8380.0096 | 1.5380.0146 |
| WFPC2 data | |||||
| C1 | 16.8980.0213 | — | 0.3210.0321 | — | — |
| C3 | 17.4780.0357 | — | 0.0220.0419 | — | — |
| C4 | 17.1940.0261 | — | 0.0660.0371 | — | — |
| C5 | 17.6990.0193 | — | 0.0080.0289 | — | — |
| C6 | 17.4220.0238 | — | 0.0440.0368 | — | — |
| V5 | 16.9060.0452 | — | 0.1720.0520 | — | — |
| V15 | 17.0120.0484 | — | 0.1690.0558 | — | — |
The WFPC2 results suggest that stars C3, C4, C5, and C6 are really normal blue horizontal-branch stars that have been measured too red from the ground due to blending with redder subgiants or turnoff stars. (The reader is reminded that the photometric errors assigned by ALLFRAME to stars in crowded regions are lower limits.) Stars C1 and C7 lie far enough from the cluster core to be easily measurable from the ground and they appear to be uncrowded ( and 4.5, respectively). They both lie rather near the red edge of the instability strip: Cacciari et al. (2005) find at least some RR Lyrae stars redder than in M 3. C1 and C7 are close enough to the cluster that they are quite probably members: the surface density of such blue stars at this apparent magnitude level is very small. This may be confirmed by examination of Fig. 5, which represents an area roughly 25 times larger than the 400′′-diameter area where we carried out this search. In fact, C1 and C7 both lie within a maximum distance of 73′′ from the adopted cluster center; this circle represents about 0.5% of the photometric survey area.
But are these stars really near the instability strip, or have they been placed there because of photometric errors, such as might be caused by blending? It is possible that the Two Micron All Sky Survey (2MASS) Point Source Catalog can help us with this question. We have searched in that catalog for detections near our measured positions for the variable candidates and the constant stars near the instability strip. We also conducted the search in the reverse sense: for every 2MASS catalog entry within 6 of our computed cluster center, we have searched for the best possible cross-identification within our catalog. When the two cross-matches agreed, we concluded we had a possible identification; when they disagreed, there was never any ambiguity about which cross-match was more probable, based upon the relative separations and the implied (optical)–(infrared) colors.
Table 15 lists the results of this process. For each provisional cross-identification within a maximum match-up tolerance of 4′′.0, it lists our star name; the minutes and seconds of right ascension and the arcminutes and arcseconds of declination for the proposed 2MASS counterpart; its infrared magnitudes; inferred I–J and V–K colors; and the angular distance between the optical and infrared positions. Obviously, the and magnitudes have been taken from our work, and the JHK magnitudes from the 2MASS Point Source Catalog. The uncertainties of the 2MASS magnitudes are large, and not all of our stars have 2MASS counterparts; evidently these objects are very near the 2MASS detection limit, and in fact the actual errors of the infrared measurements may be larger than indicated due to the patchy underlying cluster light. We shall make an effort not to overinterpret the 2MASS data.

Fig. 28 plots the apparent separation on the sky between our star and the closest 2MASS point source against the inferred I–J color. The large triangle near the bottom of the figure represents V18, which lies near the tip of the NGC 4147 giant branch. Apart from this one star, all the other objects in the diagram are supposed to be in or near the instability strip—i.e., much bluer than V18. Therefore, assuming that our cross-identification of this object is correct, then it would be unreasonable to expect that any of the other stars should be redder than it if the provisional cross-identification between the optical object and the infrared catalog entry is also correct. On this basis, we can probably say with confidence that the two provisional cross-identifications where the optical and infrared positions differ by more then 1′′.2 are both incorrect, since their inferred I–J colors are redder than that of V18. These are variable candidate V11 and possible constant star C2; the 2MASS indices probably do not refer to these objects, and can not tell us anything new about them. The infrared sources are sufficiently distant from the optical detections that even blending between them is probably not a serious issue.
Among the stars whose positions agree to less than 1′′.2, we have labeled four: the putatively stable stars C1, C7, and V15 (empty circles) and the RRab star V7 (filled square). Clearly the inferred color for V7 is anomalous. In reversing the search, i.e., in looking for optically detected objects near 2MASS sources rather than looking for 2MASS sources near our variable stars, we did find that V7 is in fact the brightest, closest optical object near the infrared detection. It lies 7′′.7 distant from our computed position of the cluster center, and is contained within the WFPC2 coverage of NGC 4147. Within two arcseconds of its position there are 26 other objects with in the WFPC2 detection catalog; the closest and brightest of these (defined as the one that produces the most severe contamination in one-arcsecond seeing conditions) is a subgiant/turnoff star with and . In terms of the fraction of photons delivered to the position of V7’s centroid on the sky in one-arcsecond seeing, this companion is fainter than V7 by 3.2 mag in the photometric bandpass; correspondingly, it would contaminate V7 at a 5% level in if its contribution were unrecognized. The other companions would each contaminate V7 at a level of less than 1.6% each. Even if all 26 of the companions were added together, and even allowing for the fact that they are probably all cooler than V7 and, hence, not so faint—relatively speaking—in the infrared bandpasses, it is not clear that the superposition of these stars with V7 could produce the -band magnitude of the 2MASS detection. The 2MASS source likely represents, rather, the integrated photometry of an ensemble of stars considerably larger than 4′′ in diameter surrounding the position of V7. At this point we have no evidence that the putatively stable stars, C1, C2, and V15, show any evidence of severe crowding like that affecting V7.
| ID | RA–12 | Dec–18 | I–J | V–K | r(′′) | ||||||
|---|---|---|---|---|---|---|---|---|---|---|---|
| Variable stars | |||||||||||
| V1 | 09 59.37 | 31 48.4 | 16.28 | 0.10 | 16.33 | 0.24 | 15.98 | 0.23 | 0.29 | 1.02 | 0.20 |
| V2 | 10 04.94 | 32 04.5 | 16.56 | 0.12 | 16.14 | 0.21 | 16.42 | 0.35 | 0.02 | 0.61 | 0.22 |
| V3 | 10 04.45 | 31 58.5 | 16.03 | 0.08 | 15.84 | 0.16 | 15.78 | 0.18 | 0.66 | 1.22 | 1.09 |
| V4 | 10 06.39 | 32 49.8 | 16.30 | 0.14 | 14.49 | — | 14.47 | — | 0.32 | 2.50 | 0.26 |
| V7 | 10 06.61 | 32 39.8 | 13.75 | — | 14.79 | 0.25 | 13.24 | — | 2.60 | 3.56 | 0.64 |
| V10 | 10 03.74 | 31 47.9 | 16.30 | 0.10 | 15.72 | 0.15 | 15.90 | 0.22 | 0.29 | 1.09 | 0.48 |
| V11 | 10 05.51 | 31 52.2 | 16.10 | 0.09 | 16.02 | 0.200 | 15.95 | 0.23 | 0.34 | 0.91 | 0.50 |
| V14 | 10 06.94 | 32 32.5 | 15.03 | 0.16 | 15.27 | 0.28 | 15.16 | 0.24 | 1.46 | 1.78 | 2.31 |
| V16 | 10 07.32 | 32 39.9 | 15.35 | 0.12 | 15.26 | 0.15 | 15.43 | 0.18 | 0.78 | 1.14 | 0.43 |
| V17 | 10 10.64 | 34 50.9 | 16.26 | 0.10 | 16.13 | 0.21 | 15.64 | — | 0.29 | 1.29 | 0.45 |
| V18 | 10 05.61 | 32 11.4 | 11.29 | 0.03 | 10.55 | 0.03 | 10.41 | 0.02 | 1.10 | 3.52 | 0.31 |
| V19 | 10 21.92 | 35 01.5 | 16.47 | 0.12 | 16.38 | 0.21 | 15.72 | — | 0.25 | 1.31 | 0.90 |
| Constant stars | |||||||||||
| C1 | 10 01.77 | 32 00.2 | 15.91 | 0.08 | 15.57 | 0.12 | 15.80 | 0.19 | 0.43 | 1.13 | 0.30 |
| C2 | 10 04.11 | 32 40.8 | 15.50 | 0.07 | 15.23 | 0.09 | 15.27 | 0.13 | 1.23 | 1.71 | 1.93 |
| C7 | 10 08.04 | 32 10.7 | 15.59 | 0.08 | 15.37 | 0.12 | 15.16 | 0.14 | 0.77 | 1.74 | 1.00 |
| V15 | 10 06.99 | 32 24.9 | 15.77 | 0.18 | 14.53 | — | 14.48 | — | 0.93 | 2.50 | 0.15 |

Fig. 29 is a (V–K,) color-magnitude diagram for the same stars excepting V7, V11, and C2, since it is clear from the evidence of Fig. 28 that the infrared indices can not be assumed to apply meaningfully to these objects. As before, the large filled triangle represents the star near the giant-branch tip, V18. Four other objects have been labeled: variable candidate V4 (solid square), and allegedly constant stars C1, C7, and V15. The optical colors appear to place V15 at the blue edge of the cluster’s instability strip, but its infrared indices imply a much cooler temperature. The star lies 12′′.7 distant from our adopted cluster center, and there are 13 other WFPC2 detections within 2′′.0, the closest and brightest of which contaminates V15 at the 1% level in one-arcsecond seeing. As with V7, the 2MASS flux must represent a patch of sky appreciably larger than 4′′ in diameter. Variable candidate V4 does not appear in the WFPC2 field coverage even though it lies within 17′′ of the cluster center; it fell in the crack between detectors PC1 and WFC2. Constant-star candidate C1 gives every indication of being correctly identified in the 2MASS catalog, and in infrared colors it is surrounded on all sides by RR Lyrae stars, although it is somewhat redder than they are in the optical indices. Candidate C7 is a slightly more ambiguous case, in that the identity between the optical and infrared catalogs is a bit less secure. If the identification is correct, however, the optical and infrared colors suggest that it lies to the red of the instability strip, and is therefore a likely red horizontal-branch star in the cluster. Taken together, C1 and C7 on the one hand, and V6 and V12 on the other, appear to require the red edge of the instability strip in NGC 4147 to lie at or with an uncertainty not worse than 0.04 mag.
Here we summarize the comparison of the 2MASS infrared photometry with our optical photometry. We conclude that the provisional matches for C2 and V11 are incorrect: their separations on the sky are relatively large, and their infrared colors are unreasonably red for their optical colors. The infrared counterparts to V7, V15, and probably V4 are either spurious or, more likely, rendered useless by confusion, because their apparent infrared fluxes are unphysically large for stellar photospheres corresponding to their optical colors. In the case of V7 and V15, it is possible to use the WFPC2 images to estimate the level of confusion with nearby stars, and in each case it is difficult to account for the infrared flux merely by summing the predicted contributions of the stars detected within a few arcseconds: either the confusion circle must be somewhat larger than 4′′, or there must be additional infrared sources not visible in the WFPC2 images, or the 2MASS photometric errors for these stars must be larger than thought (mag). The remaining entries in Table 15 are plausible cross-identifications on both astrometric and photometric grounds. Encouraged by this comparison that these remaining stars have been well photometered, we are able to place quantitative constraints on the colors of the blue and red edges of the instability strip. No constant star has been shown to lie definitively within the instability strip on the basis of both optical and infrared colors, although some stars—C1 and C7, for instance—are very near or in the instability strip in optical or infrared colors but not both. These conclusions are weaker than might otherwise be the case, due to the low mass and relative remoteness of NGC 4147: its horizontal-branch magnitude appears to lie very near the 2MASS detection limit, the total number of horizontal-branch stars is small, and confusion is an issue for many of them because the angular extent of the cluster is also small. Similar optical-infrared analyses of closer and larger clusters may well be more informative than this one has been.
6. DISCUSSION
6.1. Oosterhoff Classification
Castellani & Quarta (1987) classified NGC 4147 as Oosterhoff (1939) Type I (Oo I), making it one of the Galactic globular clusters with the bluest HBs ever to be thus classified, and also the most metal-poor Oo I cluster. As discussed by Contreras et al. (2005), such a classification seems inconsistent with the current theoretical paradigm, which holds that RR Lyrae stars in Oo I globular clusters (comparatively metal-rich systems with predominantly red or intermediate HBs and d) are relatively unevolved objects, whereas those in Oo II globulars (metal-poor clusters with predominantly blue HBs and d) are evolved from a position on the blue ZAHB (e.g., Lee et al. 1990; Clement & Shelton 1999). However, when this potential conflict with the evolutionary interpretation was identified, the possibility was raised that at least some of the RR Lyrae periods reported in the literature for NGC 4147 were in fact incorrect (Clement 2000). While Catelan (2005) has shown that the Oosterhoff dichotomy—as defined by the mean period of the RRab variables—is present even among Galactic globular clusters with , it is important to check the position of the variables in the Bailey (period-amplitude) diagram to place firmer constraints on the Oosterhoff status of a cluster or galaxy (Catelan 2004b and references therein).

The two panels of Fig. 30 are versions of the traditional Bailey diagram relating the logarithm of the period to the amplitude in the (in this case) (left) and (right) photometric bandpasses. The data for this diagram come from our Tables 8 and 10 above: we have used the “modern” periods and the amplitudes derived from the merger of our data with those of AF04. Filled circles represent the c-type (first overtone) pulsators with periods less than 0.45 d; crosses and empty circles are for the ab-type (fundamental mode) variables, with the empty circles designating the stars with Blazhko-like amplitude variations in the available data. The solid curves in the right-hand panel of Fig. 28 are the standard lines for RRab stars in M 3 (prototype Oosterhoff class I) and Centauri (Oosterhoff class II) from Clement & Rowe (2000); the dashed curves in both panels are the standard sequences for Oo I and II proposed by Cacciari et al. (2005), with Oo I and Oo II being the left and right curves, respectively. The one star that stands near the Oo II sequence in the -band Bailey diagram is the Blazhko-like star V6, which in these data has an anomalously high amplitude in . In the -band data—which are much more extensive because we are able to include the data of AF04 with our own—the perceived amplitude of this star is more moderate. In the aggregate, however, the ab-type variables of NGC 4147 clearly lie closer to the Oo I relations despite the cluster’s comparatively low metal abundance and predominantly blue horizontal branch.
The present analysis and that of AF04 have confirmed the observation of Clement (2000) that many of Newburn’s (1957) periods were uncertain and probably incorrect; in fact, essentially all the periods that Newburn flagged as uncertain have turned out to be seriously imprecise or wrong. However, despite these necessary revisions the Oo I classification of the cluster stands as a firm result. Our analysis gives a d for the five confirmed RRab variables, and d for the ten RRc (including the candidate RRe’s). These values are both clearly consistent with an Oo I classification, and incompatible with an Oo II type.
We note again that our analysis of the morphology of the evolved sequences in the CMD of NGC 4147 suggests that its metal abundance may be somewhat higher than previously thought: higher than the abundance of M 55 and thus intermediate between that cluster (Oo II) and M 3 (Oo I). The observed color of the main sequence in NGC 4147 leads to a similar conclusion provided we accept that the interstellar reddening toward M 55 is considerably higher than the value listed in Harris’s compilation catalog, but very close to the value given by the Schlegel et al. reddening maps. The properties tentatively inferred from the Fourier decomposition of the RR Lyrae light curves of NGC 4147 also suggest a greater similarity to the variables of M 3 than to those of M 55.
An intriguing aspect related to the Oo I status of the cluster is its very large RRc number fraction, , which stands in sharp contrast with the much smaller values () typically found in Oo I globular clusters with intermediate or predominantly red HB types. In fact, the RRc number fraction seems to fall much more in line with the predominantly blue HB of the cluster. The same combination of predominantly blue HB morphology, large RRc number fraction and Oo I status has recently also been confirmed for the Galactic globular cluster M62 (NGC 6266 = C1658–300) by Contreras et al. (2005). We therefore favor the interpretation that NGC 4147 is intermediate in metallicity between M 3 and M 55, and close to whatever conceptual boundary it is that separates Oo I clusters from Oo II; it is predominantly on the Oo I side of that boundary, but with some extreme properties compared to other Oo I clusters, such as its comparatively low metallicity, mainly blue horizontal branch, and high fraction of RRc-type variables.
6.2. Broader significance
NGC 4147 has recently surfaced from a long period of relative oblivion to a renewed interest, due to its claimed association with the Sagittarius dwarf spheroidal (dSph) satellite of the Milky Way, which appears to be merging with the main body of the Galaxy and supplying the latter with its stars and globular clusters (Bellazzini et al. 2003a, 2003b, and references therein). The present detailed analysis of the color-magnitude diagram and variable-star properties of the cluster may help us understand its place within the framework of formation models of the Galactic halo.
Examination of the cluster’s color-magnitude diagram confirms the presence of a predominantly blue HB and a fairly low metallicity, dex on the Zinn & West (1984) scale. This value is consistent with that tabulated by Harris (1996), although we note that the cluster’s metallicity has been the subject of some controversy. Zinn & West estimated the metallicity of the cluster on the basis of the integrated-light photometric parameter , finding . They noted that the previous analysis of the flux distribution from red giants in the cluster by Bell & Gustafsson (1983) had provided a metallicity dex, so the value that Zinn & West finally adopted for the cluster was a compromise: dex. More recently, Suntzeff et al. (1988) have used several metallicity-sensitive spectral indices to obtain dex for the cluster. The value currently given in the Harris catalog, dex, appears to correspond to a straight average of the Zinn & West and Suntzeff et al. values. AF04, on the basis of Fourier decomposition of the fundamental-mode (ab-type) RR Lyrae variables in the cluster, arrived at a much higher metallicity, namely dex. Our own Fourier decomposition results also support a fairly high metallicity for the cluster, namely dex (based on two RRab variables with relatively small values). However, it should be remembered that this value is provided in the Jurcsik metallicity scale, and translates to dex on the Zinn & West scale. Our interpretation of the CMD morphology of the cluster favors an [Fe/H] value on this scale lower than that of M 3 (i.e., ) but higher than that of M 55 (i.e., ); perhaps a compromise value near –1.7 may lie within the confidence intervals of the various photometric, spectroscopic, and pulsational analyses of the stars in the cluster.
A similar discrepancy between photometric and Fourier-based metallicity values has recently been discussed by Nemec (2004) in the case of the metal-poor globular cluster NGC 5053 (= C1313+179).
In contrast with previous photometric studies of the cluster, we have been able to examine a wide field that has provided an essentially complete assessment of the cluster’s HB. Furthermore, we have also been able to reach about 2.5 mag below the TO point, thus being able to establish—for the first time—a secure age for NGC 4147 relative to other, better-studied globular clusters. Our results indicate that, compared to similar objects in the studies of Rosenberg et al. (1999) and VandenBerg (2000), NGC 4147 has a completely normal age. (In the course of this exposition, we have noted that the value adopted by VandenBerg from previous studies of M 55 is probably overestimated by mag.) If the cluster is indeed associated with the Sagittarius dSph, this suggests that the latter was able to form globular clusters over an extended period of time, since at least for Palomar 12, which people have also associated with the Sagittarius dwarf (Da Costa & Armandroff 1995; Dinescu et al. 2000), there appears to be a consensus regarding its relative youth (Gratton & Ortolani 1988; Stetson et al. 1989; Chaboyer et al. 1996; Rosenberg et al. 1999; VandenBerg 2000; Salaris & Weiss 2002). While the variation in mean globular cluster age with metallicity remains somewhat debatable, it seems fairly certain that Pal 12 is at least 25%–33% younger than NGC 4147.
As concerns the RR Lyrae variable stars, together with AF04 we have been able to correct the problematic period values to which Clement (2000) called attention, thus confirming—on the basis of the average ab- and c-type periods, as well as the Bailey (period-amplitude) diagram for the RRab’s—Castellani & Quarta’s (1987) classification of the cluster as type Oo I. Unlike what is typically found in Oo I clusters, NGC 4147 has a predominantly blue HB. Interestingly, the c-to-ab number ratio is more in line with the cluster’s blue HB type than it is with its Oo I classification. This all suggests that the stars in the instability strip are relatively unevolved from the ZAHB, but concentrated toward the blue side, unlike traditional Oo I clusters where the variables are near the ZAHB but uniformly distributed or concentrated to the red side of the instability strip, and also unlike traditional Oo II clusters, where the ZAHB is populated primarily to the blueward of the instability strip, and many stars do not become pulsationally unstable until after considerable luminosity and temperature evolution. A similar phenomenon has been recently seen in the case of M62 (Contreras et al. 2005). For a critical discussion of the role played by evolutionary effects in producing Oo II clusters, the reader is referred to Pritzl et al. (2002), and a discussion of appropriate nomenclature is to be found in Catelan (2004a; last paragraph on his p. 411).
Other Sagittarius-related globulars have been studied by Salinas et al. (2005) and Cacciari et al. (2002); the combined results suggest that those globular clusters that have been notionally associated with the Sagittarius dwarf galaxy have fairly unusual RR Lyrae pulsation characteristics when compared with the remainder of the Galactic globular cluster system. This suggests (see also Catelan 2004b, 2005) that the Sagittarius merger is not truly representative of the typical process that has led to the formation of the present-day Galactic halo: the latter’s oldest stellar populations would have looked quite different if Sagittarius-like protogalactic fragments were primarily responsible for its assembly.
References
- (1) Alcaino, G. 1975, A&AS, 22, 193
- (2) Alcock, C., et al. 1996, AJ, 111, 1146
- (3) Arellano Ferro, A., Arévalo, M. J., Lázaro, C., Rey, M., Bramich, D. M., & Giridhar, S. 2004, RMxAA, 40, 209 (AF04)
- (4) Aurière, M., & Lauzeral, C. 1991, A&A, 244, 303
- Baade (1930) Baade, W. 1930, AN, 239, 353
- (6) Bedin, L. R., et al. 2000, A&A, 363, 159
- (7) Bell, R. A., & Gustafsson, B. 1983, MNRAS, 204, 249
- (8) Bellazzini, M., Ferraro, F. R., & Ibata, R. 2003a, AJ, 125, 188
- (9) Bellazzini, M., Ibata, R., Ferraro, F. R., & Testa, V. 2003b, A&A, 405, 577
- (10) Bolte, M., Hesser, J. E., & Stetson, P. B. 1993, ApJ, 408, L89
- (11) Buonanno, R. 1993, in ASP Conf. Ser. 48, The Globular Cluster-Galaxy Connection, eds. G. H. Smith & J. P. Brodie (San Francisco: ASP), 131
- (12) Buonanno, R., Corsi, C. E., Bellazzini, M., Ferraro, F. R., & Fusi Pecci, F. 1997, AJ, 113, 706
- (13) Buonanno, R., Corsi, C. E., & Fusi Pecci, F. 1989, A&A, 216, 80
- (14) Cacciari, C., Bellazzini, M., & Colucci, S. 2002, in IAU Symp. 207, Extragalactic Star Clusters, ed. D. Geisler, E. K. Grebel, & D. Minniti (San Francisco: ASP), 168
- (15) Cacciari, C., Corwin, T. M., & Carney, B. W. 2005, AJ, 129, 267
- (16) Carney, B., Fullton, L., & Trammell, S. 1991, AJ, 101, 1699
- (17) Carney, B., Latham, D. W., & Laird, J. B. 1990, AJ, 99, 572
- (18) Carretta, E., & Gratton, R. G. 1997, A&AS, 121, 95 (CG97)
- (19) Cassisi, S., & Salaris, M. 1997, MNRAS, 285, 593
- (20) Castellani, M., Castellani, V., & Cassisi, S. 2005, A&A, in press (astro-ph/0504470)
- (21) Castellani, V., & Quarta, M. L. 1987, A&AS, 71, 1
- (22) Catelan, M. 1992, A&A, 261, 443
- (23) Catelan, M. 2004a, ApJ, 600, 419
- (24) Catelan, M. 2004b, in ASP Conf. Ser. 310, Variable Stars in the Local Group, ed. D. W. Kurtz & K. Pollard (San Francisco: ASP), 113
- (25) Catelan, M. 2005, in ASP Conf. Ser., Resolved Stellar Populations, ed. D. Valls-Gabaud & M. Chávez (San Francisco: ASP), in press (astro-ph/0507464)
- (26) Catelan, M., Bellazzini, M., Landsman, W. B., Ferraro, F. R., Fusi Pecci, F., & Galleti, S. 2001, AJ, 122, 3171
- (27) Catelan, M., Pritzl, B. J., & Smith, H. A. 2004, ApJS, 154, 633
- (28) Chaboyer, B., Demarque, P., & Sarajedini, A. 1996, ApJ, 459, 558
- Christian et al. (1985) Christian, C. A., et al. 1985, PASP, 97, 363
- Clement (2000) Clement, C. 2000, in ASP Conf. Ser. vol. 220, Amateur–Professional Partnerships in Astronomy, ed. J. R. Percy & J. B. Wilson, (San Francisco: ASP), 93
- (31) Clement, C. M., & Rowe, J. 2000, AJ, 120, 2579
- (32) Clement, C. M., & Shelton, I. 1999, ApJ, 515, L85
- (33) Clement, C. M., et al. 2001, AJ, 122, 2587
- (34) Contreras, R., Catelan, M., Smith, H. A., Pritzl, B. J., & Borissova, J. 2005, ApJ, 623, L117
- (35) Corwin, T. M., Catelan, M., Smith, H. A., Borissova, J., Ferraro, F. R., & Raburn, W. S. 2003, AJ, 125, 2543
- (36) Da Costa, G. S., & Armandroff, T. E. 1995, AJ, 109, 2533
- Davis (1917) Davis, H. 1917, PASP, 29, 260
- (38) Dinescu, D. I., Majewski, S. R., Girard, T. M., & Cudworth, K. M. 2000, AJ, 120, 1892
- (39) Djorgovski, S., & King, I. R. 1986, ApJ, 305, L61
- (40) Ferraro, F. R., et al. 1999, AJ, 118, 1738
- (41) Gratton, R. G., & Ortolani, S. 1988, A&AS, 73, 137
- (42) Harris, W. E. 1996, AJ, 112, 1487
- (43) Holtzman, J. A., et al. 1995, PASP, 107, 1065
- (44) Jurcsik, J. 1995, AcA, 45, 653
- (45) Jurcsik, J., & Kovács, G. 1996, A&A, 312, 111
- (46) Kovács, G. 1998, in ASP Conf. Ser. 135, A Half Century of Stellar Pulsation Interpretations: A Tribute to Arthur N. Cox, ed. P. A. Bradley & J. A. Guzik (San Francisco, ASP), 52
- Landolt (1992) Landolt, A. U. 1993, AJ, 104, 340
- (48) Lee, S.-W. 1977, A&AS, 29, 1
- (49) Lee, Y.-W., Demarque, P., & Zinn, R. 1990, ApJ, 350, 155
- (50) Mackey, A. D., & van den Bergh, S. 2005, MNRAS, in press (astro-ph/0504142)
- (51) Mandushev, G. I., Fahlman, G. G., Richer, H. B., & Thompson, I. B. 1996, AJ, 112, 1536
- (52) Mannino, G. 1957, MmSAI, 28, 285
- Monet+ (1998) Monet, D. G., et al. 1998, USNO-A2.0 (Flagstaff: US Naval Obs.), CD-ROM
- (54) Nemec, J. M. 2004, AJ, 127, 2185
- (55) Newburn, R. L. 1957, AJ, 62, 197
- (56) Oosterhoff, P. Th. 1939, Observatory, 62, 104
- (57) Peterson, C. J. 1986, PASP, 98, 1258
- (58) Piotto, G., et al. 2002, A&A, 391, 945
- (59) Piotto, G., et al. 2004, ApJ, 604, L109
- (60) Pritzl, B. J., Smith, H. A., Catelan, M., & Sweigart, A. V. 2002, AJ, 124, 949
- (61) Pryor, C., & Meylan, G. 1993, in Structure and Dynamics of Globular Clusters, eds. S. G. Djorgovski and G. Meylan, ASP Conf. Ser. (San Francisco: ASP), 50, p. 357
- (62) Rathbun, P., & Smith, H. 1997, PASP, 109, 1128
- (63) Rood, R. T., & Crocker, D. A. 1989, in IAU Colloq. 111, The Use of Pulsating Stars in Fundamental Problems of Astronomy, ed. E. G. Schmidt (Cambridge: Cambridge University Press), 218
- (64) Rosenberg, A., Saviane, I., Piotto, G., & Aparicio, A. 1999, AJ, 118, 2306
- (65) Sabbi, E., Ferraro, F. R., Sills, A., & Rood, R. T. 2004, ApJ, 617, 1296
- (66) Salaris, M., Chieffi, A., & Straniero, O. 1993, ApJ, 414, 580
- (67) Salinas, R., Catelan, M., Smith, H. A., Pritzl, B. J., & Borissova, J. 2005, in preparation
- (68) Sandage, A. R., & Walker, M. F. 1955, AJ, 60, 230
- (69) Schlegel, D. J., Finkbeiner, D. P., & Davis, M. 1998, ApJ, 500, 525
- (70) Simon, N. R., & Clement, C. M, 1993, ApJ, 410, 526
- Stetson (1979) Stetson, P. B. 1979, AJ, 84, 1056
- Stetson (1987) Stetson, P. B. 1987, PASP, 99, 191
- Stetson (1990) Stetson, P. B. 1990, PASP, 102, 932
- Stetson (1993) Stetson, P. B. 1993, in IAU Coll. 136, Stellar Photometry — Current Techniques and Future Developments, ed. C. J. Butler & I. Elliot (Cambridge: Cambridge Univ. Press), 291
- Stetson (1994) Stetson, P. B. 1994, PASP, 106, 250
- Stetson (1998) Stetson, P. B. 1998, PASP, 110, 1448
- Stetson (2000) Stetson, P. B. 2000, PASP, 112, 925
- (78) Stetson, P. B. 2005, accepted for publication in PASP
- Stetson et al. (1998) Stetson, P. B. et al. 1998, ApJ, 508, 491
- Stetson et al. (1999) Stetson, P. B. et al. 1999, AJ, 117, 247
- Stetson et al. (2003) Stetson, P.B., Bruntt, H., & Grundahl, F. 2003, PASP, 115, 413
- (82) Stetson, P. B., McClure, R. D., & VandenBerg, D. A. 2004, PASP, 116, 1012
- (83) Stetson, P. B., VandenBerg, D. A., Bolte, M., Hesser, J.E., & Smith, G. H. 1989, AJ, 97, 1360
- (84) Suntzeff, N. B., Kraft, R. P., & Kinman, T. D. 1988, AJ, 95, 91
- (85) Trager, S. C., Djorgovski, S., & King, I. R. 1993, in Structure and Dynamics of Globular Clusters, eds. S. G. Djorgovski and G. Meylan, ASP Conf. Ser. (San Francisco: ASP), 50, p. 347
- (86) VandenBerg, D. A. 2000, ApJS, 129, 315
- van den Bergh & Mackey (2004) van den Bergh, S., & Mackey, A. D. 2004, MNRAS, 354, 713
- (88) Wang, J. J., Chen, L., Wu, Z. Y., Gupta, A. C., & Geffert, M. 2000, A&AS, 142, 373
- (89) Zinn, R., & West, M. J. 1984 ApJS, 55, 45
| ID | X | Y | RA | Dec |
|---|---|---|---|---|
| ′′ | ′′ | 2000.0 | 2000.0 | |
| 5481 | –194.6 | 65.1 | 12 10 00.11 | +18 32 27.5 |
| 5544 | –190.8 | 83.1 | 12 10 00.38 | +18 32 45.5 |
| 5587 | –186.8 | 76.3 | 12 10 00.65 | +18 32 38.6 |
| 5603 | –185.8 | 46.1 | 12 10 00.73 | +18 32 08.5 |
| 5649 | –183.2 | 112.2 | 12 10 00.91 | +18 33 14.5 |
| 5659 | –182.6 | 41.5 | 12 10 00.95 | +18 32 03.9 |
| 5723 | –178.7 | 66.7 | 12 10 01.23 | +18 32 29.1 |
| 5827 | –173.7 | 11.6 | 12 10 01.58 | +18 31 34.0 |
| 5851 | –172.3 | 78.0 | 12 10 01.67 | +18 32 40.4 |
| 5901 | –170.0 | 45.2 | 12 10 01.84 | +18 32 07.5 |
| 5976 | –166.9 | 119.3 | 12 10 02.05 | +18 33 21.6 |
| 6009 | –165.7 | 99.1 | 12 10 02.14 | +18 33 01.4 |
| 6026 | –164.7 | 91.3 | 12 10 02.21 | +18 32 53.7 |
| 6041 | –163.8 | 33.1 | 12 10 02.27 | +18 31 55.5 |
| 6066 | –162.7 | 89.3 | 12 10 02.35 | +18 32 51.7 |
| 6115 | –161.2 | 78.7 | 12 10 02.46 | +18 32 41.1 |
| 6123 | –160.7 | 41.8 | 12 10 02.49 | +18 32 04.2 |
| 6126 | –160.7 | 101.6 | 12 10 02.49 | +18 33 03.9 |
| 6132 | –160.5 | 49.3 | 12 10 02.50 | +18 32 11.7 |
| 6136 | –160.3 | 111.3 | 12 10 02.52 | +18 33 13.7 |
| 6139 | –160.3 | 29.1 | 12 10 02.52 | +18 31 51.5 |
| 6203 | –157.8 | 120.9 | 12 10 02.69 | +18 33 23.3 |
| 6260 | –155.9 | 36.8 | 12 10 02.83 | +18 31 59.2 |
| 6275 | –155.3 | 109.8 | 12 10 02.87 | +18 33 12.2 |
| 6311 | –153.8 | 110.2 | 12 10 02.97 | +18 33 12.5 |
| 6312 | –153.8 | 112.7 | 12 10 02.97 | +18 33 15.1 |
| 6402 | –150.6 | 82.9 | 12 10 03.20 | +18 32 45.3 |
| 6406 | –150.5 | 5.4 | 12 10 03.21 | +18 31 27.8 |
| 6487 | –147.8 | 19.3 | 12 10 03.40 | +18 31 41.7 |
| 6499 | –147.4 | 93.7 | 12 10 03.42 | +18 32 56.0 |
| 6516 | –146.5 | 109.5 | 12 10 03.49 | +18 33 11.9 |
| 6543 | –145.4 | 59.0 | 12 10 03.57 | +18 32 21.3 |
| 6579 | –144.5 | 1.0 | 12 10 03.63 | +18 31 23.4 |
| 6612 | –143.5 | 131.6 | 12 10 03.70 | +18 33 34.0 |
| 6651 | –142.3 | 95.5 | 12 10 03.79 | +18 32 57.9 |
| 6655 | –142.0 | 145.3 | 12 10 03.81 | +18 33 47.6 |
| 6665 | –141.5 | 81.5 | 12 10 03.84 | +18 32 43.9 |
| 6774 | –138.2 | 9.6 | 12 10 04.07 | +18 31 32.0 |
| 6797 | –137.7 | 78.9 | 12 10 04.11 | +18 32 41.3 |
| 6900 | –135.0 | 27.6 | 12 10 04.30 | +18 31 50.0 |
| 6913 | –134.7 | 146.3 | 12 10 04.31 | +18 33 48.7 |
| 6923 | –134.5 | 135.2 | 12 10 04.33 | +18 33 37.5 |
| 6936 | –134.2 | 120.2 | 12 10 04.35 | +18 33 22.5 |
| 6956 | –133.8 | 49.7 | 12 10 04.38 | +18 32 12.1 |
| 7061 | –131.6 | 36.5 | 12 10 04.54 | +18 31 58.8 |
| 7107 | –130.8 | 51.8 | 12 10 04.59 | +18 32 14.2 |
| 7194 | –128.7 | 105.8 | 12 10 04.74 | +18 33 08.2 |
| 7345 | –125.6 | 114.5 | 12 10 04.96 | +18 33 16.8 |
| 7399 | –124.6 | 159.0 | 12 10 05.03 | +18 34 01.3 |
| 7489 | –122.6 | 119.3 | 12 10 05.17 | +18 33 21.7 |
| 7553 | –121.3 | 68.9 | 12 10 05.26 | +18 32 31.3 |
| 7558 | –121.1 | 89.5 | 12 10 05.27 | +18 32 51.9 |
| 7563 | –121.0 | 67.4 | 12 10 05.28 | +18 32 29.8 |
| 7634 | –119.6 | 76.7 | 12 10 05.38 | +18 32 39.1 |
| 7669 | –118.9 | 150.6 | 12 10 05.43 | +18 33 53.0 |
| 7672 | –118.8 | 93.9 | 12 10 05.44 | +18 32 56.3 |
| 7693 | –118.2 | 141.1 | 12 10 05.48 | +18 33 43.5 |
| 7699 | –118.1 | 138.4 | 12 10 05.49 | +18 33 40.7 |
| 7723 | –117.6 | 69.9 | 12 10 05.52 | +18 32 32.3 |
| 7734 | –117.3 | 60.8 | 12 10 05.54 | +18 32 23.2 |
| 7742 | –117.1 | 118.8 | 12 10 05.55 | +18 33 21.2 |
| 7807 | –115.6 | 100.8 | 12 10 05.66 | +18 33 03.2 |
| 7830 | –115.1 | 127.0 | 12 10 05.70 | +18 33 29.4 |
| 7861 | –114.5 | 96.5 | 12 10 05.74 | +18 32 58.9 |
| 7887 | –113.9 | 122.0 | 12 10 05.78 | +18 33 24.4 |
| 7917 | –113.3 | 79.7 | 12 10 05.82 | +18 32 42.1 |
| 7941 | –112.9 | 60.3 | 12 10 05.85 | +18 32 22.7 |
| 7982 | –112.1 | 103.0 | 12 10 05.91 | +18 33 05.4 |
| 8009 | –111.6 | 98.4 | 12 10 05.95 | +18 33 00.8 |
| 8195 | –107.5 | 110.2 | 12 10 06.24 | +18 33 12.6 |
| 8199 | –107.4 | 142.8 | 12 10 06.24 | +18 33 45.2 |
| 8223 | –107.0 | 137.9 | 12 10 06.27 | +18 33 40.3 |
| 8277 | –106.0 | 123.0 | 12 10 06.34 | +18 33 25.4 |
| 8328 | –105.0 | 106.5 | 12 10 06.41 | +18 33 08.9 |
| 8347 | –104.6 | 119.5 | 12 10 06.44 | +18 33 21.9 |
| 8360 | –104.3 | 57.5 | 12 10 06.46 | +18 32 19.9 |
| 8625 | –99.0 | 87.1 | 12 10 06.83 | +18 32 49.4 |
| 8654 | –98.5 | 82.4 | 12 10 06.86 | +18 32 44.8 |
| 8687 | –97.7 | 85.4 | 12 10 06.92 | +18 32 47.8 |
| 8741 | –96.6 | 62.4 | 12 10 07.00 | +18 32 24.8 |
| 8748 | –96.5 | 81.0 | 12 10 07.01 | +18 32 43.4 |
| 8766 | –96.1 | 146.7 | 12 10 07.03 | +18 33 49.1 |
| 8773 | –95.9 | 81.9 | 12 10 07.05 | +18 32 44.3 |
| 8870 | –93.9 | 122.7 | 12 10 07.19 | +18 33 25.0 |
| 8873 | –93.8 | 106.5 | 12 10 07.20 | +18 33 08.9 |
| 8888 | –93.5 | 114.3 | 12 10 07.21 | +18 33 16.7 |
| 8999 | –91.2 | 72.7 | 12 10 07.38 | +18 32 35.1 |
| 9128 | –88.2 | 99.1 | 12 10 07.59 | +18 33 01.5 |
| 9321 | –83.6 | 120.8 | 12 10 07.91 | +18 33 23.1 |
| 9485 | –79.4 | 118.7 | 12 10 08.21 | +18 33 21.1 |
| 9647 | –74.8 | 113.2 | 12 10 08.53 | +18 33 15.6 |
| ID | ||||||||
|---|---|---|---|---|---|---|---|---|
| 5481 | 19.657 | 0.004 | 20.205 | 0.005 | –0.035 | 0.047 | –0.002 | 0.055 |
| 5544 | 19.337 | 0.003 | 19.921 | 0.006 | –0.066 | 0.056 | –0.054 | 0.056 |
| 5587 | 18.840 | 0.003 | 19.462 | 0.004 | –0.049 | 0.080 | –0.013 | 0.039 |
| 5603 | 20.318 | 0.005 | 20.723 | 0.017 | –0.042 | 0.092 | 0.001 | 0.052 |
| 5649 | 16.688 | 0.001 | 17.454 | 0.003 | –0.028 | 0.054 | –0.009 | 0.032 |
| 5659 | 20.125 | 0.005 | 20.550 | 0.007 | –0.048 | 0.088 | –0.032 | 0.047 |
| 5723 | 20.474 | 0.006 | 20.872 | 0.009 | 0.042 | 0.066 | 0.103 | 0.071 |
| 5827 | 16.535 | 0.001 | 17.329 | 0.003 | 0.031 | 0.051 | 0.001 | 0.033 |
| 5851 | 16.426 | 0.001 | 17.236 | 0.003 | 0.031 | 0.029 | 0.047 | 0.031 |
| 5901 | 17.300 | 0.002 | 17.296 | 0.004 | 0.084 | 0.051 | 0.015 | 0.026 |
| 5976 | 17.857 | 0.002 | 18.518 | 0.003 | 0.034 | 0.035 | 0.005 | 0.048 |
| 6009 | 19.160 | 0.003 | 19.748 | 0.005 | –0.049 | 0.040 | –0.058 | 0.050 |
| 6026 | 20.140 | 0.006 | 20.524 | 0.018 | –0.093 | 0.063 | –0.070 | 0.058 |
| 6041 | 19.935 | 0.004 | 20.371 | 0.008 | 0.063 | 0.066 | –0.009 | 0.047 |
| 6066 | 17.049 | 0.002 | 17.111 | 0.004 | 0.030 | 0.030 | 0.014 | 0.031 |
| 6115 | 18.657 | 0.002 | 19.274 | 0.004 | 0.025 | 0.034 | 0.062 | 0.036 |
| 6123 | 17.199 | 0.002 | 17.172 | 0.006 | 0.115 | 0.051 | 0.023 | 0.026 |
| 6126 | 18.278 | 0.005 | 18.910 | 0.008 | –0.028 | 0.039 | –0.034 | 0.063 |
| 6132 | 19.489 | 0.004 | 20.061 | 0.012 | 0.000 | 0.062 | 0.008 | 0.042 |
| 6136 | 20.366 | 0.006 | 20.750 | 0.012 | 0.042 | 0.056 | –0.069 | 0.062 |
| 6139 | 18.928 | 0.004 | 19.541 | 0.004 | 0.052 | 0.060 | –0.054 | 0.074 |
| 6203 | 17.161 | 0.003 | 17.181 | 0.005 | –0.004 | 0.030 | –0.036 | 0.031 |
| 6260 | 17.142 | 0.002 | 17.150 | 0.004 | 0.058 | 0.052 | 0.013 | 0.032 |
| 6275 | 19.975 | 0.012 | 20.385 | 0.009 | –0.099 | 0.052 | –0.077 | 0.064 |
| 6311 | 20.123 | 0.010 | 20.524 | 0.013 | –0.054 | 0.056 | –0.070 | 0.064 |
| 6312 | 17.394 | 0.002 | 18.100 | 0.005 | –0.019 | 0.033 | 0.018 | 0.032 |
| 6402 | 16.962 | 0.001 | 17.709 | 0.003 | 0.047 | 0.029 | 0.065 | 0.031 |
| 6406 | 18.199 | 0.002 | 18.835 | 0.005 | 0.032 | 0.053 | –0.053 | 0.075 |
| 6487 | 20.364 | 0.006 | 20.760 | 0.013 | 0.043 | 0.068 | –0.036 | 0.088 |
| 6499 | 19.194 | 0.008 | 19.810 | 0.025 | –0.105 | 0.043 | –0.103 | 0.057 |
| 6516 | 20.144 | 0.005 | 20.528 | 0.008 | –0.034 | 0.052 | –0.062 | 0.067 |
| 6543 | 15.942 | 0.001 | 16.808 | 0.003 | 0.110 | 0.050 | 0.066 | 0.026 |
| 6579 | 20.180 | 0.005 | 20.586 | 0.014 | 0.001 | 0.081 | –0.094 | 0.056 |
| 6612 | 20.135 | 0.005 | 20.519 | 0.008 | –0.020 | 0.053 | 0.028 | 0.029 |
| 6651 | 16.776 | 0.002 | 17.545 | 0.005 | 0.042 | 0.036 | 0.014 | 0.044 |
| 6655 | 15.766 | 0.001 | 16.728 | 0.003 | 0.043 | 0.024 | –0.032 | 0.011 |
| 6665 | 17.505 | 0.002 | 17.484 | 0.005 | 0.017 | 0.031 | –0.018 | 0.032 |
| 6774 | 18.874 | 0.003 | 19.497 | 0.005 | 0.028 | 0.056 | –0.053 | 0.039 |
| 6797 | 16.875 | 0.002 | 17.379 | 0.004 | 0.023 | 0.030 | 0.096 | 0.031 |
| 6900 | 17.842 | 0.002 | 18.514 | 0.005 | 0.060 | 0.052 | 0.026 | 0.034 |
| 6913 | 19.905 | 0.005 | 20.329 | 0.006 | –0.055 | 0.041 | 0.040 | 0.041 |
| 6923 | 20.178 | 0.006 | 20.570 | 0.007 | 0.005 | 0.047 | –0.020 | 0.058 |
| 6936 | 19.718 | 0.006 | 20.227 | 0.011 | 0.046 | 0.040 | 0.043 | 0.043 |
| 6956 | 17.168 | 0.003 | 17.901 | 0.007 | 0.074 | 0.051 | 0.005 | 0.029 |
| 7061 | 17.840 | 0.002 | 18.502 | 0.008 | 0.024 | 0.052 | –0.007 | 0.030 |
| 7107 | 16.967 | 0.002 | 17.109 | 0.003 | 0.077 | 0.051 | 0.071 | 0.026 |
| 7194 | 15.284 | 0.001 | 16.238 | 0.002 | 0.033 | 0.027 | –0.020 | 0.010 |
| 7345 | 19.879 | 0.005 | 20.336 | 0.010 | 0.029 | 0.043 | 0.083 | 0.049 |
| 7399 | 18.192 | 0.002 | 18.888 | 0.005 | –0.060 | 0.088 | –0.033 | 0.041 |
| 7489 | 18.473 | 0.003 | 19.103 | 0.004 | –0.060 | 0.058 | –0.014 | 0.021 |
| 7553 | 17.547 | 0.005 | 18.220 | 0.011 | –0.100 | 0.044 | –0.081 | 0.047 |
| 7558 | 15.675 | 0.002 | 16.560 | 0.003 | 0.001 | 0.036 | 0.045 | 0.037 |
| 7563 | 16.904 | 0.004 | 17.647 | 0.009 | –0.029 | 0.039 | –0.021 | 0.045 |
| 7634 | 16.673 | 0.003 | 17.243 | 0.004 | 0.012 | 0.030 | 0.103 | 0.033 |
| 7669 | 18.558 | 0.003 | 19.179 | 0.004 | –0.077 | 0.073 | –0.002 | 0.028 |
| 7672 | 16.919 | 0.002 | 16.993 | 0.005 | 0.041 | 0.025 | 0.042 | 0.013 |
| 7693 | 19.233 | 0.004 | 19.822 | 0.005 | 0.004 | 0.051 | 0.012 | 0.038 |
| 7699 | 20.382 | 0.007 | 20.787 | 0.009 | 0.006 | 0.066 | 0.024 | 0.062 |
| 7723 | 17.006 | 0.004 | 17.030 | 0.008 | 0.063 | 0.024 | 0.042 | 0.044 |
| 7734 | 15.711 | 0.002 | 16.565 | 0.004 | –0.009 | 0.038 | –0.054 | 0.044 |
| 7742 | 19.711 | 0.004 | 20.219 | 0.007 | –0.029 | 0.056 | –0.067 | 0.045 |
| 7807 | 18.960 | 0.005 | 19.606 | 0.007 | –0.079 | 0.077 | –0.022 | 0.052 |
| 7830 | 19.493 | 0.003 | 20.054 | 0.006 | 0.006 | 0.045 | –0.012 | 0.040 |
| 7861 | 18.702 | 0.005 | 19.322 | 0.007 | –0.008 | 0.031 | 0.019 | 0.048 |
| 7887 | 17.234 | 0.002 | 17.237 | 0.005 | 0.037 | 0.025 | 0.002 | 0.013 |
| 7917 | 16.538 | 0.003 | 17.252 | 0.005 | –0.060 | 0.046 | –0.049 | 0.043 |
| 7941 | 17.451 | 0.004 | 17.457 | 0.008 | –0.057 | 0.053 | –0.049 | 0.046 |
| 7982 | 18.130 | 0.004 | 18.774 | 0.011 | –0.003 | 0.028 | 0.013 | 0.023 |
| 8009 | 19.053 | 0.004 | 19.625 | 0.009 | –0.062 | 0.038 | –0.021 | 0.031 |
| 8195 | 19.823 | 0.006 | 20.299 | 0.008 | –0.028 | 0.053 | –0.025 | 0.068 |
| 8199 | 18.506 | 0.005 | 19.132 | 0.009 | –0.015 | 0.075 | 0.001 | 0.038 |
| 8223 | 18.667 | 0.003 | 19.291 | 0.007 | 0.006 | 0.031 | 0.066 | 0.031 |
| 8277 | 20.225 | 0.006 | 20.646 | 0.010 | –0.033 | 0.044 | –0.060 | 0.055 |
| 8328 | 16.482 | 0.002 | 17.280 | 0.003 | 0.001 | 0.034 | 0.065 | 0.016 |
| 8347 | 19.891 | 0.006 | 20.339 | 0.018 | –0.059 | 0.140 | –0.011 | 0.049 |
| 8360 | 16.968 | 0.003 | 17.092 | 0.008 | –0.021 | 0.037 | 0.015 | 0.047 |
| 8625 | 17.231 | 0.003 | 17.933 | 0.009 | 0.009 | 0.046 | 0.016 | 0.047 |
| 8654 | 17.883 | 0.005 | 18.711 | 0.013 | –0.019 | 0.040 | –0.112 | 0.048 |
| 8687 | 17.343 | 0.003 | 17.350 | 0.008 | 0.038 | 0.033 | 0.036 | 0.034 |
| 8741 | 16.982 | 0.003 | 17.154 | 0.005 | –0.021 | 0.056 | 0.011 | 0.045 |
| 8748 | 18.266 | 0.006 | 18.913 | 0.014 | –0.098 | 0.047 | –0.100 | 0.044 |
| 8766 | 18.584 | 0.003 | 19.203 | 0.008 | –0.015 | 0.038 | –0.057 | 0.055 |
| 8773 | 17.885 | 0.005 | 18.550 | 0.014 | –0.011 | 0.048 | –0.019 | 0.051 |
| 8870 | 19.929 | 0.004 | 20.361 | 0.006 | 0.004 | 0.051 | 0.026 | 0.053 |
| 8873 | 19.785 | 0.008 | 20.268 | 0.008 | –0.020 | 0.075 | –0.022 | 0.096 |
| 8888 | 19.566 | 0.006 | 20.127 | 0.011 | 0.055 | 0.045 | 0.037 | 0.042 |
| 8999 | 16.961 | 0.003 | 17.146 | 0.007 | 0.063 | 0.051 | 0.101 | 0.046 |
| 9128 | 17.477 | 0.003 | 17.440 | 0.007 | 0.003 | 0.046 | –0.027 | 0.025 |
| 9321 | 20.109 | 0.013 | 20.508 | 0.022 | –0.061 | 0.056 | –0.121 | 0.053 |
| 9485 | 19.848 | 0.004 | 20.299 | 0.007 | –0.004 | 0.051 | –0.020 | 0.053 |
| 9647 | 19.996 | 0.006 | 20.412 | 0.007 | –0.023 | 0.061 | –0.040 | 0.041 |