11email: jurcsik@konkoly.hu 22institutetext: Department of Experimental Physics and Astronomical Observatory, University of Szeged, H-6720 Szeged, Dóm tér 9, Hungary 33institutetext: Universities Space Research Association/U.S. Naval Observatory, P. O. Box 1149, Flagstaff, Arizona, U.S.A. 86002-1149, U.S.A., e-mail: aah@nofs.navy.mil 44institutetext: Eötvös Loránd University, Department of Astronomy, P.O. Box 32, H-1518 Budapest, Hungary
The triple-mode pulsating variable V823 Cas
Based on extended multicolour CCD photometry of the triple-mode radial pulsator V823 Cas we studied the properties of the coupling frequencies invoked by nonlinear processes. Our results support that a resonance connection as suggested by Antonello & Aikawa (1998) affects the mode coupling behaviour. The P1/P0 period ratio of V823 Cas has an ”out of range” value if compared with the period ratios of the known double mode pulsators, while the P2/P1 period ratio is normal. The periods and period ratios cannot be consistently interpret without conflict with pulsation and/or evolution models. We attempt to interpret this failure by the suggestion that at present, the periods of V823 Cas are in a transient, resonance affected state, thus do not reflect the true parameters of the object. The anomalous period change behaviour of the fundamental and second overtone modes supports this idea. We have also raised the possibility that a resonance may act in triple mode pulsators.
Key Words.:
Stars: individual: V823~Cas – Stars: variables: Cepheids – Stars: oscillations – Stars: evolution – Techniques: photometric1 Introduction
Stellar pulsation often manifests multiperiodic behaviour. The simultaneous excitation of different modes is a common property of e.g. Sct variables. In these stars both radial and nonradial pulsation modes can be excited, and especially in case of a dense frequency spectrum with many nonradial modes, the identification of the modes still has not been settled.
Multiperiodicity of radial mode pulsators is also observed in different types of variables. Radial mode pulsating variables are important targets of astero-seizmology as mode identification is unambiguous in many cases. Consequently, the pulsation properties of these stars reveal the physical parameters quite precisely by using pulsation models and/or empirical relations developed for the different types of variables along the instability strip. Two radial modes can be excited simultaneously in Cepheids, HADS (high amplitude Sct stars) SX Phe and RR Lyrae variables as well. These, so called double mode pulsators, oscillate either in the fundamental and first overtone modes or in the first and second overtones.
In three stars; AC~And, V823~Cas and V829~Aql, the three lowest radial modes have been detected to be excited simultaneously. Very recently two triple-mode short period Cepheids were also discovered in the LMC (Moskalik & Dziembowski, 2005), these stars oscillate, however, in the first three overtone modes. As a result of the mass photometry of the LMC and SMC (OGLE, MACHO, EROS projects, Udalski et al. (1999); Soszyński et al. (2000); Alcock et al. (1999); Beaulieu et al. (1997)) dozens of short period ( d) double mode Cepheids were discovered, both fundamental and first overtone () and first and second overtone () pulsators. These results have also shown that in the LMC and SMC most of the d Cepheids have double mode properties, indicating that in their physical parameter regimes multi-mode pulsation is favoured. Because of the large distance and the consequent faintness of the LMC/SMC multi-mode pulsators, their investigations are strongly restricted. The three galactic triple-mode radial pulsators are also sparsely examined, in spite of that our knowledge on stellar pulsation would highly benefit from their thorough observational and/or theoretical studies.
According to their fundamental periods AC~And and V823~Cas ( d) resemble to metal poor RR Lyrae stars, while V829~Aql with d is classified as a post main sequence Sct star by Handler et al. (1998). The metal content of AC~And is, however, extremely high for a typical RR Lyrae star (Preston, 1959). Fitch & Szeidl (1976) and Kovács & Buchler (1994) based on pulsation and evolution models have concluded that it is most probably a higher mass evolved star similar to Sct variables. Fernie (1994) suggested that AC~And may be the missing link between Sct stars and classical Cepheids.
V823~Cas was discovered to be a triple mode radial pulsator by S. Antipin (Antipin, 1997) using the Moscow photographic plate collection taken with the 40cm astrograph in Crimea between 1948 and 1995. Data showed without doubt light variation with three independent periodicities matching most probably to the three lowest radial mode oscillations. Until today, no further information on this important object has emerged, therefore, we decided to carry out an extensive multicolour photometric investigation of V823~Cas.
2 Observations, data reduction
The observations were obtained with the automated 60cm telescope of the Konkoly Observatory (Svábhegy, Budapest) equipped with a Wright 750x1100 CCD (parameters and calibration are given in Bakos (1999)) using filters. The field of view was 17’x24’. Reduction processes were performed using standard IRAF111IRAF is distributed by the National Optical Astronomy Observatories, which are operated by the Association of Universities for Research in Astronomy, Inc., under cooperative agreement with the National Science Foundation. packages. Data were corrected for atmospheric extinction.
About 3 600 frames were obtained in each passband on 38 nights between 25 September and 14 December in 2003 (JD ). Transformation to the standard system was done using the magnitudes of surrounding stars observed by A. Henden with the USNO Flagstaff Station 1.0 m telescope equipped with a SITe/Tektronix 1024x1024 CCD. A complete table of the positions and magnitudes of stars in the field centred on V823~Cas, is given in Table 1 (available electronically from the CDS). The following formulae were derived to transform the instrumental data to the standard system:
Aperture photometry was applied to measure the relative magnitudes of V823~Cas to GSC~04018-01777 (). HD~134, GSC~04018-01891 and GSC~04018-01661 were used as check stars, neither of them showed any significant variability relative to GSC~04018-01777.
Photometric data are available electronically at the CDS. In Table 2 5 (http://cdsweb.u-strasbg.fr/cgi-bin/qcat?J/A+A/) Column 1 lists the HJD of the observations, and Column 2 gives the differential magnitudes of V823~Cas with respect to GSC~04018-01777 for the colours. , , and colour curves were also derived utilizing the observations and fitted values of the , , curves according the Fourier solutions given in Table 6 and Table 7 for the moments of the measurements. The colour indices are given in the 3.,4., and 5. Columns of Table 3.
3 Photometric results
3.1 Frequency components, amplitudes, and phases

| Identification | frequency | |||||||||
|---|---|---|---|---|---|---|---|---|---|---|
| cycle/day | mmag | |||||||||
| Identification | frequency | |||||||||
|---|---|---|---|---|---|---|---|---|---|---|
| cycle/day | deg | |||||||||
| 85.24 | 86.21 | 87.87 | 90.72 | 82.60 | 80.09 | 79.14 | ||||
| 17.17 | 16.42 | 15.56 | 14.11 | 20.43 | 18.79 | 19.82 | ||||
| 167.96 | 165.83 | 165.24 | 167.21 | 179.39 | 166.14 | 161.51 | ||||
| 40.83 | 40.81 | 36.70 | 24.62 | 46.76 | 57.82 | 74.12 | ||||
| 9.53 | 11.77 | 14.50 | 18.37 | 3.11 | 2.26 | 1.81 | ||||
| 220.48 | 218.75 | 217.74 | 215.09 | 225.52 | 222.46 | 225.57 | ||||
| 69.47 | 66.47 | 57.45 | 58.57 | 247.29 | 66.61 | 66.60 | ||||
| 32.64 | 33.35 | 34.37 | 34.62 | 30.66 | 29.49 | 31.23 | ||||
| 156.53 | 156.86 | 157.49 | 157.50 | 156.46 | 154.16 | 155.79 | ||||
| 124.69 | 124.51 | 123.20 | 125.22 | 124.11 | 130.23 | 123.71 | ||||
| 16.59 | 18.51 | 20.08 | 21.15 | 7.98 | 14.15 | 14.22 | ||||
| 124.89 | 131.37 | 138.78 | 130.44 | 108.37 | 43.21 | 135.37 | ||||
| 259.64 | 248.62 | 244.81 | 234.59 | 275.08 | 259.32 | 277.82 | ||||
| 78.22 | 81.44 | 82.74 | 80.75 | 55.23 | 82.75 | 85.81 | ||||
| 234.69 | 235.40 | 230.99 | 238.92 | 229.87 | 246.51 | 230.05 | ||||
| 78.41 | 78.36 | 62.65 | 65.54 | 79.30 | 98.87 | 108.18 | ||||
| 255.21 | 262.08 | 253.65 | 252.93 | 235.83 | 295.82 | 273.64 | ||||
| 54.17 | 67.07 | 57.34 | 46.21 | 10.08 | 96.75 | 98.38 | ||||
| 119.60 | 131.29 | 137.83 | 145.01 | 44.71 | 91.55 | 116.02 | ||||
| 80.14 | 77.50 | 70.74 | 72.81 | 88.61 | 96.49 | 83.44 | ||||
| 242.97 | 240.53 | 238.93 | 237.65 | 249.56 | 249.04 | 245.89 | ||||
| 158.83 | 158.21 | 171.31 | 170.19 | 169.90 | 126.06 | 138.32 | ||||
| 3.69 | 2.88 | 3.42 | 27.58 | 77.19 | 0.01 | 22.05 | ||||
| 224.63 | 224.04 | 228.02 | 217.36 | 225.35 | 209.85 | 234.81 | ||||
| 95.76 | 91.42 | 94.31 | 114.91 | 112.82 | 84.46 | 55.10 | ||||
| 72.13 | 78.17 | 67.14 | 108.60 | 71.59 | 104.80 | 66.94 | ||||
| 43.06 | 41.77 | 41.87 | 49.15 | 43.61 | 42.78 | 28.25 | ||||
| 30.46 | 39.13 | 33.64 | 38.47 | 44.35 | 54.05 | 35.88 | ||||
| 81.99 | 67.51 | 65.18 | 37.29 | 147.19 | 68.90 | 79.12 | ||||
| 29.87 | 20.70 | 18.68 | 21.75 | 54.73 | 21.53 | 13.96 | ||||
| 34.45 | 48.91 | 52.36 | 43.12 | 1.11 | 12.86 | 58.26 | ||||
| 199.65 | 185.55 | 178.67 | 191.70 | 218.01 | 236.97 | 175.97 | ||||
| 134.81 | 135.73 | 141.33 | 137.49 | 140.06 | 114.45 | 123.12 | ||||
| 171.24 | 155.66 | 169.61 | 197.53 | 222.10 | 141.50 | 124.41 | ||||
| 76.96 | 82.20 | 75.96 | 76.14 | 68.92 | 108.98 | 92.31 | ||||
,
.
| order | frequency | Error() | ||||||
|---|---|---|---|---|---|---|---|---|
| 1 | 0 | 1 | 0 | 1.950515 | 0.1765 | 1.000 | 0.002 | 0.000 |
| 1 | 0 | 0 | 1.494765 | 0.1160 | 1.000 | 0.003 | 0.000 | |
| 0 | 0 | 1 | 2.433590 | 0.0292 | 1.000 | 0.011 | 0.000 | |
| 2 | 1 | 1 | 0 | 3.445280 | 0.0448 | 0.307 | 0.008 | 4.384 |
| 0 | 2 | 0 | 3.901030 | 0.0372 | 0.211 | 0.008 | 3.273 | |
| 1 | 0 | 0.455750 | 0.0251 | 0.172 | 0.013 | 3.496 | ||
| 2 | 0 | 0 | 2.989530 | 0.0166 | 0.143 | 0.020 | 4.179 | |
| 0 | 1 | 1 | 4.384105 | 0.0101 | 0.099 | 0.035 | 3.421 | |
| 0 | 1 | 0.483075 | 0.0069 | 0.068 | 0.059 | 3.176 | ||
| 1 | 0 | 1 | 3.928355 | 0.0060 | 0.083 | 0.055 | 3.087 | |
| 0 | 1 | 0.938825 | 0.0025 | 0.172 | 0.149 | 3.390 | ||
| 3 | 2 | 0 | 2.406265 | 0.0135 | 0.087 | 0.025 | 0.763 | |
| 0 | 3 | 0 | 5.851545 | 0.0131 | 0.075 | 0.026 | 1.108 | |
| 2 | 1 | 0 | 4.940045 | 0.0118 | 0.086 | 0.028 | 2.109 | |
| 1 | 2 | 0 | 5.395795 | 0.0107 | 0.069 | 0.031 | 1.742 | |
| 0 | 2 | 1 | 6.334620 | 0.0059 | 0.046 | 0.059 | 1.179 | |
| 2 | 0 | 1.039015 | 0.0053 | 0.039 | 0.063 | 1.024 | ||
| 1 | 1 | 1 | 5.878870 | 0.0049 | 0.046 | 0.069 | 0.855 | |
| 1 | 1 | 2.889340 | 0.0042 | 0.039 | 0.090 | 0.059 | ||
| 1 | 1 | 1.977840 | 0.0042 | 0.039 | 0.080 | 0.194 | ||
| 3 | 0 | 0 | 4.484295 | 0.0021 | 0.018 | 0.180 | 1.711 | |
| 4 | 1 | 3 | 0 | 7.346310 | 0.0063 | 0.039 | 0.054 | 5.378 |
| 2 | 2 | 0 | 6.890560 | 0.0038 | 0.026 | 0.087 | 6.077 | |
| 0 | 4 | 0 | 7.802060 | 0.0036 | 0.021 | 0.093 | 5.236 | |
| 3 | 0 | 4.356780 | 0.0035 | 0.022 | 0.095 | 4.826 | ||
| 3 | 1 | 0 | 6.434810 | 0.0034 | 0.026 | 0.094 | 6.510 | |
| 0 | 3 | 1 | 8.285135 | 0.0031 | 0.022 | 0.103 | 5.551 | |
| 1 | 2 | 1 | 7.829385 | 0.0025 | 0.020 | 0.124 | 5.380 | |
| 0 | 3 | 3.417955 | 0.0022 | 0.016 | 0.160 | 4.492 | ||
| 2 | 1 | 4.839855 | 0.0021 | 0.017 | 0.162 | 4.635 | ||
| 2 | 0 | 0.911500 | 0.0021 | 0.014 | 0.150 | 2.577 | ||
| 2 | 1 | 1 | 7.373635 | 0.0016 | 0.014 | 0.211 | 4.475 | |
| 5 | 1 | 4 | 0 | 9.296825 | 0.0029 | 0.018 | 0.111 | 3.314 |
| 2 | 3 | 0 | 8.841075 | 0.0017 | 0.011 | 0.193 | 3.363 |
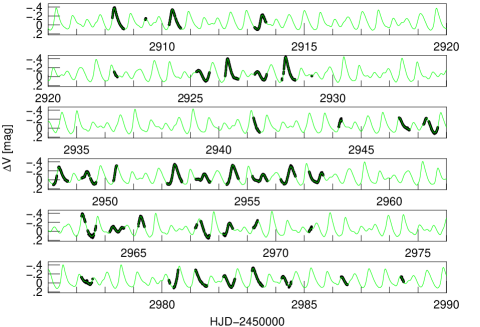
The light curve solution given in Table 6 and Table 7 was determined from the Fourier analysis of the photometric data using the utilities of the program package MUFRAN (Kolláth, 1990). Nonlinear regression facilities of Mathematica (Wolfram Research, Inc) were also applied. The listed frequencies fit the data with 0.0126, 0.0079, 0.0081, 0.0079 mag r.m.s. scatter, respectively, which is about the observational accuracy limit. The light curve and the fit are shown in Fig. 1.
Besides the frequencies of the three dominant radial modes and their harmonics, 26 of the possible linear combination coupling frequencies could be identified in the successively prewhitened spectra of the data.
Frequency component identification was performed on the dataset as the amplitudes of the signals are the largest in . In order to refine the frequency values least squares solutions were calculated within the vicinity of the suspected values of , their harmonics and the detected linear combination term frequencies. Linear combination frequencies were always set according to the actual values of the main frequency components. Solution with the smallest residual scatter was accepted for the frequency values. The asymptotic error estimates of the corresponding periods are 0.000045, 0.000013 and 0.000060 days, respectively.
The formal errors () of the amplitudes are about mmag, the errors of the phases of signals with amplitude larger than 1 mmag are reliable within °.
All but 2-term coupling frequencies involving and , appear in the spectra, and six 3-term linear combination frequencies are also detected. The amplitudes of the coupling components are always smaller than that of its compounding frequencies with one exception. The amplitude of the component is higher than the amplitude of the in each colour. Actually the harmonic component is only marginally present in the data, we involved this component to the solution only because a real frequency component was found at 6.43481 c/d, which we could interpret only as . However, considering the marginal amplitude of the component, this interpretation might not be correct.
After the removal of the radial modes, their harmonics and the coupling terms from the data, the residual spectra in each colour show evidence of a component at 0.817 c/d as shown in Fig. 2. This frequency, denoted as in Table 6 and Table 7, cannot be resolved as the linear combination of the radial modes. As no indication of this frequency was found in the comparison - check stars data, we suppose it as a real frequency component of V823~Cas. Taking into account the small amplitude and the relatively long, 1.22 d periodicity of this variation one may speculate about its origin as a high-order gravity mode, similarly as in the Dor variables. In order to check the reality of this explanation, however, further observational and theoretical confirmations are needed.
No other frequency in the residual spectrum was detected, consequently the solution given in Table 6 and Table 7 is a full description of the data within the limits of the accuracy of the observations.
In most cases the linear combination components involving negative term have smaller amplitudes than the combination component of the same but positive terms, in agreement with model results, that nonlinear pulsation favours combination frequency terms where both and are positive (Antonello & Aikawa, 1998). There is one significant counter-example, has larger amplitude than in each colour. The amplitudes of the 3-term combination frequencies of the same components have similar amplitudes independently of the signs.
The amplitude ratios of the combination frequencies defined as
decrease exponentially with increasing order () as shown in
Fig 3. denotes the amplitude of the frequency
component, i.e., , and .
The amplitudes of all the detected frequencies decrease towards longer wavelengths. Most of the frequencies of the light curve solution appear in the colour indices as well, typically with the largest amplitude in the colour.
The phases of the three pulsation modes tend to be smaller towards the longer wavelengths. The phase differences between the and data for , and are , , and , respectively, while the phases of the colour indices are typically larger than the phases of the light curves, e.g. the phases of , and of the curve are larger by about , , and , than the phases of the light curve solution. In contrast with these systematic trends of the phases of the three radial modes, the phases of the two largest amplitude linear combination terms, and , are identical in each wavelength bands. The phases of the smaller amplitude linear combination terms are not accurate enough to detect any real wavelenght dependent trend in the phase behaviour.
Poretti & Pardo (1997) have shown that in galactic double-mode Cepheids the different order generalized phase differences (, for a definition see Antonello (1994)) of the linear combination term frequencies tend to have similar values. In Table 8 the different order generalized phase differences of our light curve solution and also the amplitude ratios are listed, in the order of decreasing amplitude. The errors of the phases are also given, in order to easily estimate the reliability of the phase difference values. For compatibility with other similar data, the phase differences are given in radians. The averages of the phase differences are 3.55, 1.07, 5.01 (5.26 omitting the most deviant 2.577 value), and 3.34 for the 2., 3., 4. and 5. order terms, respectively. These values are systematically smaller by about rad as the corresponding 4.31, 2.17, 6.24, 3.85 averages of the values of galactic double-mode Cepheids calculated from the data listed by Poretti & Pardo (1997). Taking into account the decreasing trend of the phase differences with decreasing periods as shown in Fig. 2 in Poretti & Pardo (1997) the short periods of V823~Cas may account for its smaller values.
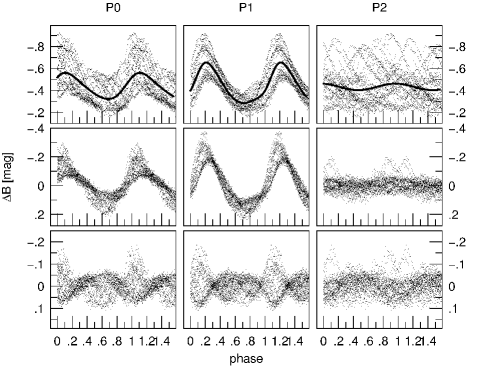
As indicated by Antonello & Aikawa (1998) the only plausible explanation that can change the phases and can lead to coherent values of the different order phase differences is a resonance between the pulsation modes. In Fig 4 the light curve is folded according to the periods of the three radial modes (top panels), after prewhitening with the frequencies and harmonics of the other two modes (middle panels), and the residual light curve after the removal of all the three radial modes’ light curves (bottom panels). These plots still show some kind of regular behaviour according to the main periodicities. It is also evident that extreme large amplitudes occur when each of the modes are simultaneously around maximum phase indicating also that some kind of resonance interaction may be responsible for the occurrence of the coupling frequencies.


4 Comparison with model results
Period ratios of different type radial multi-mode pulsators has been collected and the result is summarized in Fig 5. The separations of the sequences of galactic, LMC and SMC Cepheids reflect the different metal content of the stars ( and 0.004, respectively). The ratio of V823~Cas is evidently discrepant from the global relation defined by the different types of variables. This is most probable because of an anomalous value of , as the period ratio fits well the observed values of other multi-mode pulsators.
In order to find an answer for the anomalous value of the fundamental mode period first we have checked whether the observed periods and period ratios can match stellar pulsation and evolution model results. The difference between pulsation periods derived from linear models and the real nonlinear periods are supposed to be negligible. Thus linear periods are widely used to determine physical parameters of multi-mode pulsators (e.g. Moskalik & Dziembowski (2005); Petersen & Christensen-Dalsgaard (1996); Antonello & Aikawa (1998)). Kovács & Buchler (1994) (hereafter KB94) calculated an extended set of linear radial models to explain the periods of AC~And, the other triple-mode variable with very similar periods. We have compared the pulsation periods calculated from the KB94 formulae with those given in the evolutionary and pulsation models of (Alibert et al., 1999). The period of a given model agrees within 1% accuracy with the period calculated from KB94 models (within the common parameter regimes) indicating consistency of the two model groups.
The observed periods, and period ratios d, can be fitted with period ratio distance (for definition see KB94) accuracy with certain high-mass-sequence 2 models of KB94. Solutions can be found for the Z=0.004 and Z=0.01 models with M☉ and M☉ mass, respectively. The metal-poor solutions () are at too high, temperature out of the instability strip, with negative growth rates of the detected modes, therefore we exclude these among the real possibilities. There is also indication that solutions might also exist for solar composition, Z=0.02 models, but at ’out of range’ mass value, which was not covered with the KB94 models, thus these pulsation solutions are somewhat uncertain. Moreover, considering the Period - Temperature connections valid for Cepheids, e.g., Fig. 1 in Baraffe & Alibert (2001) and Fig. 3 in Sandage (2004), the temperature of Cepheids with periods shorter than 1 day must be higher than 6000 K. All the Z=0.02 model period solutions fall below 6000 K, thus these are not valid solutions as well.
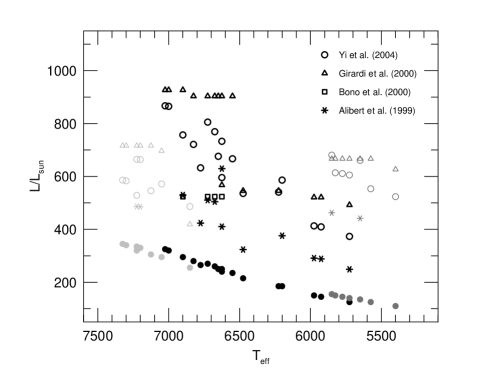
The parameter regimes of the possible solutions are shown in Fig. 6. The physical parameters of these models seems to be, however, in conflict with evolutionary results. At a given mass and chemical composition any canonical evolutionary model predicts the possible lowest luminosity within the instability strip during its ’first crossing’, evolving off the main sequence. However, each of the appropriate evolutionary models (Alibert et al., 1999; Bono et al., 2000; Girardi et al., 2000; Yi et al., 2004) cross the instability strip at significantly larger luminosities than the solutions of the periods indicate even during the first crossing. The minimal luminosity at a given metallicity and mass values according to evolutionary models are also indicated in Fig. 6. The L☉ discrepancy between luminosities allowed by stellar evolution and luminosities derived from the pulsation solution of the periods indicates also that the periods of V823 Cas are anomalous.
This problem arises from the unusually large value observed for the ratio (0.766). At d the normal value of would be less than 0.75 for any consistent model. The extended linear nonadiabatic pulsation models for galactic, LMC and SMC compositions (Morgan & Welch, 1997) strengthen that can never be larger than 0.75 in any real case. There are two ways to increase the period ratio at a given period, towards more metal poor models, and/or with models of smaller ratio the ratio is larger (Petersen & Christensen-Dalsgaard, 1996; Kovács & Buchler, 1994). For V823~Cas, however, both of these possibilities can be excluded, as already mentioned the metal poor period solution fall out of the instability strip, and small ratio is not allowed by evolutionary models.
As a conclusion, we have found that the period ratios of V823~Cas cannot be explained consistently with stellar evolution and pulsation models. We suppose that this is not the consequence of any serious defect/inadequacy of the models but more probably arises from a temporal, transition behaviour of V823~Cas, which produces unusual period ratios (see the next section).
5 Period changes
| star | JD-2 400 000 | [d] | 2 | [d] | 2 | [d] | 2 | ||||
|---|---|---|---|---|---|---|---|---|---|---|---|
| V823 Cas | |||||||||||
| 0.669001 | .000045 | 0.12 | 0.512685 | .000013 | 0.18 | 0.410916 | .000060 | 0.03 | CCD(B) (1) | ||
| 0.668887 | .000005 | 0.13 | 0.512660 | .000002 | 0.18 | 0.411027 | .000005 | 0.05 | pg (2) | ||
| 0.668870 | .000009 | 0.12 | 0.512646 | .000003 | 0.17 | 0.411030 | .000007 | 0.05 | pg (2) | ||
| 0.668840 | .000009 | 0.13 | 0.512628 | .000003 | 0.17 | 0.411040 | .000007 | 0.07 | pg (2) | ||
| AC And | |||||||||||
| 0.711253 | .000014 | 0.525155 | .000009 | 0.421088 | .000014 | Hip (3) | |||||
| 0.711232 | .000002 | 0.525133 | .000001 | 0.421072 | .000002 | pe(V) (4) | |||||
| 0.711227 | .000001 | 0.525130 | .000001 | 0.421067 | .000001 | pg (5) | |||||
| 0.711217 | .000011 | 0.525108 | .000008 | 0.421063 | .000016 | vis (6) | |||||
| Period change rates | [] | ||||||||||
| V823 Cas | increasing | 2.17 | decreasing | ||||||||
| AC And | 0.71 | 0.79 | 1.08 | ||||||||
The extended photographic data complemented with the recent CCD observations enable us to derive reliable period changes of the three observed modes. Antipin (1997) analysed two sets of the photographic data (between and , respectively) and detected period increase of the fundamental and first overtone modes. As photographic data are available already from JD 2 429 076, we divided the photographic data into three subsets in order to get more details of the period change behaviour of V823~Cas. Table 9 lists the periods of the radial modes, their error estimates and the photographic or CCD() amplitudes derived from nonlinear regression process of Mathematica.
For comparison, the period change behaviour of AC~And has been revised and listed in Table 9, too. Periods for the different datasets of AC~And has been determined similarly as described in Sect 3.1.

The period change rate of the dominant, first overtone mode of V823~Cas and that of all the three modes of AC~And well correspond to the theoretically expected evolutionary value during the first crossing of the instability strip. The evolutionary period change rates during the second and third crossing are by two orders of magnitude slower (Moskalik & Dziembowski, 2005). The larger indicates somewhat larger mass of V823~Cas than AC And.
In contrast, the periods of the fundamental mode and the second overtone of V823~Cas behave differently. According to the CCD observations the period change rates of these modes have been recently changed, has increased, while has decreased by about 0.0001 d during the last decades. The amplitude of the second overtone also shows significant changes, it has gradually decreased from 0.07 mag to 0.03 mag, in contrast with the amplitudes of the fundamental and first overtone modes, which differ only within the limits of the uncertainty for the different sets of the observations. The reduction of the amplitude indicates that this mode may be just diminishing, and this is accomplished by the extreme period change behaviour. However, this effect cannot be solely account for the rapid period increase of . As we have no reason to assume that canonical evolution and pulsation models which fail to interpret the period ratios of V823~Cas were in fault, we suggest that, instead, the fundamental mode period is somehow ’wrong’.
An interesting possibility arises from the opposite sign period change of the second overtone mode. Extrapolating backward the linear period changes detected between JD , the period ratios should have been about and about 3 300 years ago. These period ratios fulfill the resonance criterion, as and , indicating that the three radial modes might have been in a resonance connection in a very recent past in astronomical time-scale.
This resonance hypothesis would also help to understand the anomalous period ratios of V823 Cas. If we assume that in the future the period change rate of the first overtone remains the same as detected for the last 50 years, but the period increase of the fundamental keeps on to be larger than that as indicated by recent observations, i.e.,
then, this would lead to change in the period ratio, as
Consequently, with time elapsing,
.
The exponential change in the period ratio results drastic changes during astronomically very short time base. The recent observations have shown that the period change rate of has increased to 3 times that of the period change rate of . Assuming the possible largest uncertainties, is smaller than at present, which, according to the above formula would lead to a decrease in the ratio from its unusual 0.766 to a normal 0.745 value within 14 000 years.
6 Absolute parameters derived from observed magnitudes, and P-L relations
The magnitude and intensity mean brightness and colours of V823~Cas using the standard magnitudes of the comparison star as given in Section 2 are the followings. Magnitude mean values:
.
Intensity mean values:
.
The interstellar reddening in the direction of V823~Cas according to the Schlegel et al. (1998) maps is quite large, mag. V823~Cas lies close to the galactic plane () to the direction of the Perseus Arm. The distance of the Perseus Arm is about 3 Kpc in the direction of V823~Cas () as shown in Fig. 2 in Quillen (2002). Consequently, it can be assumed that within 3 Kpc interstellar reddening is much smaller than 0.887 mag. Dereddened colours, using standard reddening law for colours as given in Schlegel et al. (1998) fit the synthetic colours of atmosphere models (Castelli et al., 1997) according to the parameters listed in Table 10.
The observed periods of V823~Cas are too short for classical Cepheids and are too long for Scuti models. This intermediate status makes comparison with model results uncertain, as in most of the cases conclusions can be drawn from extrapolation. Because of this deficiency and the uncertainties of data conversion between the observable (magnitude, colour-indices) and the theoretical plane’s (luminosity, temperature) quantities, the absolute parameters from the observed colours and periods cannot be determined accurately.
A rough estimate can be, however, done by combining the possible solutions listed in Table 10 with predictions of empirical and theoretical Period - Luminosity relations. The 0.669 d fundamental mode, and 0.513 first overtone periods correspond to mag absolute visual magnitude during first crossing within mag range for matallicity models according to the Period - Luminosity relations of Baraffe & Alibert (2001) and Alibert et al. (1999). This value is in accordance with combined empirical relations of Cepheids and Scuti stars (e.g. Fernie, 1992). Recent empirical studies e.g., Udalski (2000); Sandage (2004) yield also consistent results within the given magnitude range.
Comparing this value with the absolute magnitudes of different reddening and metallicity solutions at a distance of Kpc as given in Table 10 we conclude that if the Period - Luminosity relation of classical Cepheids is valid for V823~Cas, it is either a 1.5 Kpc distant, K object with solar composition or a cooler, Z=0.01-0.004 metallicity object at about 2 Kpc. As it was already mentioned in Sect. 4, Cepheids with day are hotter than 6000 K, thus we conclude that the most probable solution for V823~Cas is E(B-V)=0.37, d=1.5 Kpc, K, , . Because of the uncertainties involved, this result has to be taken with caution.
| 1.5 | 2.0 | 2.5 | 3.0 [Kpc] | |||
|---|---|---|---|---|---|---|
| 0.37 | 0.020 | 6500 | ||||
| 0.19 | 0.010 | 5750 | ||||
| 0.15 | 0.004 | 5500 | ||||
7 Summary
The recent CCD observations of V823~Cas can be fitted with the periods of the 3 lowest radial modes, their harmonics and their linear combination terms within the observational accuracy. No indication of nonradial p-modes has been found, but the probable existence of a small amplitude signal with 1.22 d periodicity needs an explanation.
We present, for the first time, extended multicolour observations of a multi-mode radial pulsator which is accurate enough to study the phase and amplitude relations of the radial modes and the different order coupling frequency components. These results give a deeper insight to the behaviour of the nonlinear processes taking place during stellar pulsation.
The observed period ratios of V823 Cas cannot be consistently explained with canonical pulsation and evolution models. We interpret this anomaly as a consequence of a temporal behaviour of the periods which may originate from the very rapid evolutionary changes of the stellar parameters and/or a resonance connection between the radial modes’ frequencies (), which might have been fulfilled in the astronomically recent past. Both theoretical and observational investigations are needed in order to check the reality of this resonance during the triple-mode phase of the pulsation, and to examine its effect on the observed period values.
If the actual values of the and period change rates remain unchanged, a normal period ratio is going to be reached in a short time, in about 10-20 000 years. This peculiar period change behaviour, together with the lapse of the mode, as indicated by its amplitude decrease, may also hint that in its triple-mode state the periods of V823 Cas may have transient, resonance affected values, which do not reflect the real physical parameters of the star.
The unique period change behaviour of V823 Cas warns about the validity of drawing any conclusion about the evolutionary status and the direction of the evolution from the period change rates. A similar conclusion was reached from the unexpected period change behaviour of the two recently discovered overtone mode triple-mode radial pulsators in the LMC by Moskalik & Dziembowski (2005).
Acknowledgements.
We would like to thank Dr S. Antipin for kindly providing us the photographic measurements of V823~Cas. This research has made use of the SIMBAD database, operated at CDS Strasbourg, France. The financial support of OTKA grants T-043504, T-046207 and T-048961 is acknowledged.References
- Alcock et al. (1999) Alcock, C., Allsman, R. A., Alves, D. R., et al. 1999, ApJ, 511, 185
- Alibert et al. (1999) Alibert, Y., Baraffe, I., Hauschildt, P, & Allard, F. 1999, A&A, 344, 551
- Antipin (1997) Antipin, S. 1997, A&A, 326, L1
- Antonello & Aikawa (1998) Antonello, E., & Aikawa, T. 1998, A&A, 337, 145
- Antonello (1994) Antonello, E. 1994, A&A, 291, 820
- Bakos (1999) Bakos, G. Á. 1999, Occ. Techn. Notes Konkoly Obs., No. 11, http://www.konkoly.hu/mitteilungen/mitteilungen.html
- Baraffe & Alibert (2001) Baraffe, I., Alibert, Y. 2001 A&A, 371, 592
- Beaulieu et al. (1997) Beaulieu, J.-P., Krockenberger, M., Sasselov, D. et al. 1997, A&A, 321, L5
- Bono et al. (2000) Bono, G., Caputo, F., Cassisi, S., Marconi, M., Piersanti, L., & Tornambè, A. 2000, ApJ, 543, 955
- Castelli et al. (1997) Castelli, F., Gratton, R. G., Kurucz, R. L. 1997, A&A, 318, 841
- ESA (1997) ESA 1997, The Hipparcos and Tycho Catalogues, ESA SP-1200
- Fernie (1992) Fernie, J. D. 1992, AJ, 103, 1647
- Fernie (1994) Fernie, J. D. 1994, MNRAS, 271, L19
- Fitch & Szeidl (1976) Fitch, W. S., & Szeidl, B. 1976, ApJ, 203, 616
- Girardi et al. (2000) Girardi, L., Bressan, A., Bertelli, G., & Chiosi, C. 2000, A&AS, 141, 371
- Guman (1982) Guman, I. 1982, Commun. Konkoly Obs., No. 78
- Handler et al. (1998) Handler, G., Pikall, H., & Diethelm, R. 1998, IBVS, No. 4549
- Kolláth (1990) Kolláth, Z. 1990, Occ. Techn. Notes Konkoly Obs., No. 1, http://www.konkoly.hu/staff/kollath/mufran.html
- Kovács & Buchler (1994) Kovács, G., & Buchler, J. R. 1994, A&A, 281, 749
- Lause (1932) Lause, F. 1932 Astron. Nachr. 245, 329
- Lause (1933) Lause, F. 1933 Astron. Nachr. 249, 377
- Lause (1938) Lause, F. 1938 Astron. Nachr. 264, 143
- Morgan & Welch (1997) Morgan, S. M., & Welch, D. L. 1997, AJ, 114, 1183
- Moskalik & Dziembowski (2005) Moskalik, P., & Dziembowski, W. 2005, A&A, 434, 1077
- Petersen & Christensen-Dalsgaard (1996) Petersen, J. O., & Christensen-Dalsgaard, J. 1996, A&A, 312, 463
- Poretti & Pardo (1997) Poretti, E., & Pardo, I. 1997, A&A, 324, 133
- Preston (1959) Preston, G. W. 1959, ApJ, 130, 507
- Quillen (2002) Quillen, A. C. 2002, AJ, 124, 924
- Sandage (2004) Sandage, A., Tammann, G. A., & Reindl, B. 2004, A&A, 424, 43
- Schlegel et al. (1998) Schlegel, D. J., Finkbeiner, D., P., & Davis, M. 1998, ApJ, 500, 525
- Soszyński et al. (2000) Soszyński, I., Udalski, A., Szymański, M., Kubiak, M., Pietrzyński, G., Woźniak, P., & Żebruń, K. 2000, Acta Astronomica, 50, 451
- Udalski (2000) Udalski, A. 2000, Acta Astronomica, 50, 279
- Udalski et al. (1999) Udalski, A., Soszyński, I., Szymański, M., Kubiak, M., Pietrzyński, G., Woźniak, P., & Żebruń, K. 1999, Acta Astronomica, 49, 1
- Yi et al. (2004) Yi, S. K., Kim, Y.-C.; Demarque, P. 2004, ApJS, 144, 259