A further ‘degree of freedom’ in the rotational evolution of stars
Observational and theoretical investigations provide evidence for non-uniform spot and magnetic flux distributions on rapidly rotating stars, which have a significant impact on their angular momentum loss rate through magnetised winds. Supplementing the formalism of 1991ApJ...376..204M with a latitude-dependent magnetised wind model, we analyse the effect of analytically prescribed surface distributions of open magnetic flux with different shapes and degrees of non-uniformity on the rotational evolution of a solar-like star. The angular momentum redistribution inside the star is treated in a qualitative way, assuming an angular momentum transfer between the rigidly-rotating radiative and convective zones on a constant coupling timescale of ; for the sake of simplicity we disregard interactions with circumstellar disks. We find that non-uniform flux distributions entail rotational histories which differ significantly from those of classical approaches, with differences cumulating up to during the main sequence phase. Their impact is able to mimic deviations of the dynamo efficiency from linearity of up to and nominal dynamo saturation limits at about times the solar rotation rate. Concentrations of open magnetic flux at high latitudes thus assist in the formation of very rapidly rotating stars in young open clusters, and ease the necessity for a dynamo saturation at small rotation rates. However, since our results show that even minor amounts of open flux at intermediate latitudes, as observed with Zeeman-Doppler imaging techniques, are sufficient to moderate this reduction of the AM loss rate, we suggest that non-uniform flux distributions are a complementary rather than an alternative explanation for very rapid stellar rotation.
Key Words.:
Stars: rotation – Stars: winds, outflows – Stars: magnetic fields – Stars: mass-loss – Stars: evolution – MHD1 Introduction
In the presence of open magnetic fields the angular momentum (AM) loss of a star through winds and outflows is significantly enhanced since the tension of bent field lines effectively prolongs the lever arm of the associated torque (1962AnAp...25...18S). Whereas during the pre-main sequence (PMS) phase the rotational evolution of a star is dominated by its changing stellar structure and magnetic interaction with a circumstellar accretion disk, its rotation during the main sequence (MS) phase is mainly determined through braking by magnetised winds (1976ApJ...210..498B). Theoretical studies of magnetised winds go back to classical approaches of 1967ApJ...148..217W and 1968MNRAS.138..359M. At high rotation rates the magnetic field adds considerably to the acceleration of the outflow through magneto-centrifugal driving (1969ApJ...158..727M), which makes magnetised winds intrinsically latitude-dependent. The total AM loss rate is consequently susceptible to variations of the surface magnetic field (1997A&A...325.1039S; 2005smaamldtlmw) and atmospheric field topology (1987MNRAS.226...57M; 1988ApJ...333..236K). More recently, multi-dimensional MHD-simulations have been accomplished to study structural and temporal wind properties like coronal mass ejections in more detail (e.g., 1985A&A...152..121S; 1999A&A...343..251K; 2000ApJ...530.1036K); the extensive computational requirements render them however less attractive for studies concerning the rotational evolution of stars.
1.1 Saturation limits
1972ApJ...171..565S analysed the rotation and chromospheric emission of cool stars in different evolutionary stages, and found that their rotation rate (as well as Ca II luminosity) is about proportional to the inverse square-root of their age, that is . Presuming a constant moment of inertia and a WD braking law, the 1972ApJ...171..565S relation implies a linear relationship between the rotation rate of a star and its characteristic magnetic field strength, with dynamo efficiency . However, 1991LNP...380..389S found that the magnetic flux rather than the field strength is increasing linearly with the rotation rate, which is now commonly adopted (at slow rotation rates). The consequence of a continuously increasing stellar field strength is a very efficient magnetic braking of rapidly rotating stars. In fact, too efficient, since observations of young open clusters reveal significant numbers of stars with rotational velocities up to (1997ApJ...479..776S), whose existence is, with initial rotation rates of young T Tauri stars being observationally well constrained (1993A&A...272..176B), difficult to explain in the framework of magnetic braking without any mechanism which moderates the AM loss rate at higher rotation rates. Respective studies therefore frequently presume a saturation of the AM loss beyond a limiting rotation rate, whose value is very susceptible to model assumptions like the internal AM redistribution; whereas some investigations require low () saturation limits (1995A&A...294..469K; 1996ApJ...462..746B; 1997A&A...326.1023B; 1997ApJ...480..303K), others argue for higher () values (1993ApJ...409..624S; 1994MNRAS.269.1099C).
The saturation of the total AM loss rate is often ascribed to the underlying dynamo mechanisms in the convective envelope, because current dynamo theories anticipate a moderation and eventually saturation of the amplification process () when the back-reaction of strong magnetic fields suppresses plasma motions and inhibits its further increase (e.g., 1993A&A...269..581R). However, the various theoretical models are as yet unable to provide consistent or explicit values for the critical rotation rate or field strength at which this occurs.
The concept of a saturation of magnetic activity is strengthened by empirical activity-rotation relationships, which reveal (for rotation periods longer than a few days) close correlations between the rotation rate and the strength of activity proxies like magnetically induced chromospheric and coronal emission (1984ApJ...279..763N; 1984A&A...133..117V; 1995A&A...300..775M; 1997ApJ...479..776S; 2003A&A...397..147P). In rapidly rotating stars several activity signatures are found to saturate: the chromospheric UV emission below rotation periods (1984A&A...133..117V), and the EUV and (soft) X-ray emission for (1997ApJ...479..776S). However, the variation of photometric light curves, associated with the presence of dark spots in the stellar photosphere, is found to increase for even shorter rotation periods, down to , for which the chromospheric and coronal emission are already saturated (1995A&A...294..715O; 2001A&A...366..215M); for an antithetical point of view see 1998ApJ...493..914K.
The saturation of activity signatures is not unambiguously indicative of a saturation of the dynamo mechanisms in the convective envelope, since emission processes are liable to further rotation-dependent effects like a reduction of the X-ray emitting volume through the centrifugal stripping of hot coronal loops, or the shift of coronal loop temperatures into different emission regimes as the effective gravitation and pressure scale hight change with the rotation rate (1997A&A...321..177U; 1999A&A...346..883J). The conjecture that changes of the atmospheric emission are not necessarily correlated with the (sub-)photospheric magnetic activity is supported, for example, by observations of the ultra-fast rotator VXR45a (V370 Vel, , whose X-ray emission is below the typical level of X-ray saturated stars (2003A&A...407L..63M), whereas its brightness surface maps are still very similar to those of more slowly rotating stars (2004AN....325..246M; cs13splinter).
The large range of rotation rates () in which observed activity signatures are found to saturate raises the question whether these phenomena reflect the actual behaviour of the underlying dynamo processes, in particular beyond which critical rotation rate their efficiency breaks down. Since the range of observed saturation limits practically covers the one of suggested AM loss limits, a definite justification of the latter in terms of a dynamo saturation is rather precarious.
1.2 Surface magnetic flux distributions
Doppler imaging (DI) observations of rapidly rotating stars yield non-uniform surface brightness distributions, where, in contrast to the case of the Sun, dark spots are not only located in equatorial regions, but also at intermediate and polar latitudes (2002AN....323..309S, and references therein). Theoretical models considering the formation of magnetic features at higher latitudes involve the pre-eruptive poleward deflection of magnetic flux inside the convection zone by the Coriolis force (1992A&A...264L..13S), and/or its post-eruptive poleward transport through meridional motions (2001ApJ...551.1099S). Backed by these observational and theoretical results, 1997A&A...325.1039S investigated the influence of a bi-modal magnetic field distribution on the rotational evolution of cool stars. They found that a concentration of magnetic flux at very high latitudes reduces the total AM loss rate as efficiently as a dynamo saturation limit at . Based on their findings, they question the concept of a dynamo saturation at low rotation rates and argue instead for a saturation above ; a similar though more qualitative argument has also been discussed by 1997ApJ...484..855B.
The work of 1997A&A...325.1039S was focused on flux concentrations around the pole, assuming that the observed brightness distributions indicate likely locations of open field lines along which a stellar wind can escape. But the bare existence of starspots does not a priori imply information about the associated magnetic field topology, that is neither about the existence nor about the amount of open magnetic flux. Zeeman-Doppler imaging (ZDI) observations in contrast directly confirm the magnetic origin of the dark features and enable a determination of the magnetic field at the stellar surface (1997MNRAS.291..658D). Such field distributions serve as boundary conditions for field extrapolation techniques (1969SoPh....9..131A), which reveal large-scale magnetic field topologies and consequently the distribution of closed and open magnetic field lines (e.g., 2002MNRAS.333..339J; 2002MNRAS.336.1364J). In the case of the rapidly rotating star LQ Hya () the latitudinal distributions of open flux show that large amounts are located at intermediate and high latitudes (2004MNRAS.355.1066M). A similar result is found in the case of AB Dor () for observations between 1995 and 2003 (1997MNRAS.291....1D; 1999MNRAS.302..437D; 2003MNRAS.345.1145D): Figure 1 shows the (normalised) cumulated open magnetic flux, integrated from the equator to a co-latitude .

The curves indicate that of the total open magnetic flux of a hemisphere is on average located below/above , with variations of depending on the observational epoch. These results show that the distribution of open magnetic flux can be distinctively different from spot distributions determined from surface brightness maps alone.
The present work extends the study of 1997A&A...325.1039S and investigates the impact of latitude-dependent flux distributions on the rotational evolution of solar-type stars in more detail. Using the magnetic wind model described in 2005smaamldtlmw, we quantify the influence of prescribed flux distributions with different degrees of non-uniformity on the rotational evolution of stars, and verify their importance by comparing their impact with the influence of other magnetic field-related model parameters.
2 Model setup
The stellar structure of the low-mass star considered here consists of an outer convective envelope and an inner radiative core, each taken to be in solid-body rotation with possibly different rotation rates. With being the AM, the moment of inertia, and the rotation rate, the rotational evolution of the star is determined by the set of coupled differential equations
| (1) | |||||
| (2) |
which comprise changing moments of inertia and the AM transfer across appropriate boundaries; indices ‘e’ and ‘c’ denote quantities of the envelope and of the core, respectively.
2.1 Internal angular momentum redistribution
The stellar structure is taken to be spherically symmetric. The temporal change of the moments of inertia is determined by an evolutionary sequence of stellar models of a star, which was generated with an updated version of the stellar evolution code of 1967micp..7..129. Figure 2 shows the evolution of the (outer) radii, masses, and moments of inertia of both the convective envelope and the radiative core.

As the core-envelope interface recedes outward, the dynamical stability properties at the base of the convection zone change and originally unstable mass settles down on the radiative core. This mass transfer is accompanied by an AM transfer,
| (3) |
The temporal change of the core mass, , is determined from the sequence of stellar models (Fig. 2b); since the mass loss of the envelope through the stellar wind is negligibly small, it is .
Hydrodynamic and hydromagnetic interaction at the boundary between the radiative and convective regions are expected to entail a coupling between the core and the envelope. Different coupling mechanisms based on magneto-viscous interaction or large-scale internal circulations have been investigated by 1989ApJ...338..424P; 1993ApJ...417..762C; 1997A&A...326.1023B; 1998A&A...333..629A and references therein. Here, a more qualitative core-envelope coupling model is used, following the parametric approach of 1991ApJ...376..204M and 1995A&A...294..469K. Based on the Rayleigh criterion a dynamical stable state of rotation inside a star requires111in the equatorial plane and in the absence of viscosity the increase of the specific AM with increasing radius, . Given that the rotation rate of the convective envelope is braked and smaller than the rotation rate of the core, the stability condition is violated at the core-envelope interface and a rotational instability sets in, transferring AM,
| (4) |
from the core to the envelope to eliminate the differential rotation between the two regions. The AM required to equalise the two rotation rates,
| (5) |
is transferred on a timescale, , which is supposed to characterise the various visco-magnetic coupling mechanisms. The coupling time quantises the possibility to deposit AM in the core during the PMS phase and its retarded transfer to the envelope in the course of the MS evolution. For the sake of simplicity the value of is taken to be constant during the entire rotational evolution of the star.
2.2 Latitude-dependent magnetised stellar winds
The AM loss rate of the convective envelope through a latitude-dependent magnetised wind is determined following the approach of 2005smaamldtlmw. The stationary, polytropic stellar wind is assumed to be symmetric with regard to both the rotation axis and the equator. The poloidal component of the magnetic field is taken to be radial, with field lines forming spirals around the rotation axis on coni with constant opening angles. The whole stellar surface contributes to the wind, without ‘dead zones’ retaining mass from escaping (cf. 1987MNRAS.226...57M).
The magnetic wind properties are determined through the radial magnetic field strength,
| (6) |
given at a reference level, , close to the stellar surface. The time-dependent radius ratio is to ensure that the total magnetic flux,
| (7) |
only depends on the rotation rate of the star (1991LNP...380..389S), and an arbitrary reference time, . The efficiency of the underlying dynamo mechanism is expected to increase with the rotation rate of the convection zone. The field strength variation, , is therefore determined in a way that the surface averaged field strength,
| (8) |
obeys the functional behaviour shown in Fig. 3.

The non-uniform flux distributions, superposed on a constant ‘background’ field, , are characterised by an enhancement of magnetic flux at non-equatorial latitudes (Fig. 4):

-
•
Coronal Hole (CH) model
(9) -
•
Latitudinal Belt (LB) model
(10)
Whereas the Latitudinal Belt model closely resembles what is found from field extrapolations based on ZDI images (2004MNRAS.355.1066M), the Coronal Hole model is motivated by numerous DI surface brightness maps (e.g., 2002AN....323..309S). Different degrees of high-latitude flux concentrations are realised by changing the co-latitude of the analytically prescribed functions (Fig. 5).

We classify non-uniform flux distributions by the location of their -open flux level, , where the cumulated open magnetic flux, , reaches half of the total value, .
The total, surface integrated AM loss rate,
| (11) |
is expressed in terms of the plasma density, , and radial flow velocity, , at the Alfvénic point, , where the flow velocity of the wind equals the Alfvén velocity (cf. 2005smaamldtlmw). Whereas , and are functions of the co-latitude, , and subject to the latitude-dependent field distributions, Eq. (6), the respective quantities, , and , are determined in the equatorial plane () using the surface averaged field strength, Eq. (8). The latter quantities determine the AM loss rate following the approach of 1967ApJ...148..217W,
| (12) |
which is based on the simplifying assumption that the equatorial wind structure can be generalised to all latitudes.
2.3 Reference model parameters
The wind structure is determined through boundary conditions prescribed at the reference level , over the range of co-latitudes , measured from the stellar north pole. is the time-dependent outer radius of the convective envelope (Fig. 2a), and a constant radial offset to locate the reference level of the wind at the base of the corona.
For cool stars other than the Sun thermal wind properties are poorly constrained by observations; for possible constraints resulting from relationships between the temperature and density of closed coronal loops and rotation/Rossby number see, for example, 1991MNRAS.252P..21J; 2003ApJ...599..516I. In the following solar-like values are assumed for the temperature, , and (particle) density, . The entropy change of the wind with increasing distance from the star is quantified through the polytropic index, .
The surface averaged magnetic field strength, defined in Eq. (8), is taken to follow the quasi-linear power law shown in Fig. 3 (solid line), that is , with . This is in agreement with observations of rapidly rotating stars, which show magnetic field strengths up to about two orders of magnitude larger than in the case of the Sun (1997MNRAS.291....1D).
Helioseismological observations show that the rotation rate in the solar interior is roughly uniform (2003ARA&A..41..599T). The rotation rate of the solar radiative core and convection zone are within about . The present Sun thus constrains the coupling timescale to the effect that the value of ought to achieve isorotation within a few percent at the solar age, . Using the reference model parameters described above, we accomplished simulations with different coupling timescales to determine the relative deviation, , from isorotation at solar age (Table 1).
| [Myr] | 1 | 5 | 10 | 15 | 20 | 50 | 100 |
|---|---|---|---|---|---|---|---|
| [%] | 0.3 | 1.3 | 2.6 | 4.1 | 5.6 | 16.4 | 35.7 |
For , a value similar to the one adopted by 1991ApJ...376..204M or 1995A&A...294..469K, the deviation is in accord with the observational constrains given by the Sun.
3 Results
We determine the rotational evolution of stars with initial rotation rates , , and from the age onward. The rotation periods, between and , approximately span the observed range of rotation periods of young T Tauri stars (1993A&A...272..176B). In their initial state the convective and radiative zones are taken to be in isorotation, that is .
The rotational histories determined with the AM loss rate , that is using the WD approach, Eq. (12), are used as reference cases (Fig. 6).

In the course of the PMS evolution the rotation rate of the envelope is dominated by its decreasing moment of inertia and the AM loss which goes with the mass settling down onto the radiative core, whereas during the MS phase only the magnetic braking and the internal coupling are relevant.
3.1 Non-uniform flux distributions
We determine the rotational history of stars subject to the Latitudinal Belt (LB) and Coronal Hole (CH) flux distributions with -open flux levels located at different latitudes. At first, the non-uniform flux patterns are taken to be stationary () during the entire evolution, to separate their influence from other rotation-dependent effects.
An accumulation of open magnetic flux at high (low) latitudes causes, with respect to an uniform flux distribution, a reduction (enhancement) of the AM loss rate through the stellar wind. At the age of the present Sun the resulting deviations of the stellar rotation rate are found to cover a range of values between about and different than the respective reference cases (Fig. 7).


The relative deviations show two distinctive regimes, corresponding to the PMS and the MS phase. For the deviations to increase (decrease) with time the net AM loss rate of the envelope has to be smaller (larger) than in the reference case. Since we consider the difference between two rotational histories, the rotation-independent mechanisms cancel out, so that only the magnetic braking and the internal coupling are relevant. The magnetic braking is a direct consequence of the present stellar rotation and causes an immediate AM loss of the envelope. The internal coupling, in contrast, is proportional to the differential rotation and during the early evolution rather inefficient, due to the initial isorotation (Fig. 8).

In the PMS phase the difference between the AM loss of the envelope and its internal AM gain is consequently large and the deviations of the rotation rate quickly increasing. After arrival on the MS the differential rotation is adjusted to the new situation and the tapping of the AM reservoir of the more rapidly rotating core now replenishes most of the AM loss carried away by the magnetised wind; the further increase of the deviations is respectively weaker.
The actual spin-down time scale of the envelope is longer than the braking time scale, because the AM gain of the envelope through the internal coupling follows closely its AM loss through the magnetic braking (Fig. 8). Note that in the course of the evolution the latter is found to converge toward the reference value. Since the magnetic field strength decreases with the rotation rate the relative contribution of the (latitude-dependent) magneto-centrifugal driving to the overall wind acceleration becomes smaller and the one of the (latitude-independent) thermal driving larger. The difference between the 1967ApJ...148..217W and the present non-uniform wind approach thus becomes smaller and the spin-down timescale similar.
The non-uniform flux distributions with have nominally the same -flux level as the uniform flux distribution of the reference cases. The deviations of the relative rotation rate of in the case of the LB model indicate that the usage of only allows for a rudimentary classification of flux patterns. By comparing the rotational histories resulting from different flux distributions with equivalent -open flux levels, we find that over the range the peaked Latitudinal Belt and the bi-modal Coronal Hole model yield rotational evolutions which are within a tolerance of consistent. In the special case of a dipolar field distribution (with and , Fig. 5), the correspondency is found to be good within about .
Observations show that surface distributions of starspots depend on the stellar rotation rate, with spots being preferentially located at higher latitudes the faster the star rotates. We investigate this aspect by assuming a rotation-dependent latitude of the -flux level, which follows the power law , with , and ; this simple relationship is only used to examine the basic effects and not meant to reproduce any complex observed or theoretically derived relations. To avoid unrealistic high flux concentrations in the vicinity of the poles or the equator, the -flux latitudes are constrained to the range (cf. 1997A&A...325.1039S). Figure 9 shows the relative deviations of the rotation rates from the reference values in the case of a rotation-dependent LB distribution; for the CH model the results are very similar.

The major consequence of the rotation-dependence is the enhanced stellar spin-up and spin-down during the PMS and the late MS phase, respectively. The evolutionary stage at which the rotational history is altered by the shifting of magnetic flux to lower latitudes depends however on the actual functional dependence of .
3.2 Comparison with dynamo efficiency and saturation
To examine whether the impact of non-uniform flux distributions is significant with respect to other magnetic field-related model assumptions, we compare the deviations described above with those obtained by successively changing the functional dependence of the magnetic field strength on the stellar rotation rate in the framework of the reference cases (i.e., with uniform flux distributions).
A linear dynamo efficiency is an acceptable approximation in the case of slowly rotating stars, but it is found to fail for fast rotators. We analyse the sensitivity of the rotational evolution on changes of the dynamo efficiency by re-calculating the reference cases, but now subject to non-linear magnetic field-rotation relations, , with (cf. Fig. 3). During the MS phase, the resulting relative deviations cover a large range between and (Fig. 10).

Sub-linear (super-linear) dynamo efficiencies imply a weaker (stronger) increase of the magnetic field strength with rotation rate and consequently a moderation (enhancement) of the magnetic braking. Their influence is therefore qualitatively similar to rotation-dependent concentrations of magnetic flux at high and low latitude, respectively. To determine explicit relations between the dynamo efficiency and the location of the -open flux level, we generate grids of rotational histories with different - and -values, and associate corresponding values by comparing the relative derivations of the rotation rate from the reference case222Since the variations of the rotational histories over the entire evolutionary time range are qualitatively different, we constrain the comparison to the early MS phase between .. Figure 11 shows quadratic fits of the resulting grid-based relations for the LB and CH flux distribution.

The relationships show that non-uniform flux distributions can imitate a large range (here: between and ) of dynamo efficiencies and, consequently, if not taken properly into account, conceal them from an observational determination.
The limiting field strength beyond which dynamo saturation occurs is referred to in terms of a critical rotation rate, , that is . We repeat our calculations of the reference cases under the assumption of saturation rotation rates in the range of (see Fig. 12 for examples).

The saturated magnetic braking causes an enhanced spin-up during the PMS phase, higher rotation rates on the ZAMS, and a weaker spin-down during the MS phase until the rotation rate descends into the regime of the non-saturated dynamo. We compare the rotational histories resulting from a saturated magnetic braking with those resulting from non-uniform flux distributions to associate -open flux level with corresponding dynamo saturation rates (Fig. 13).
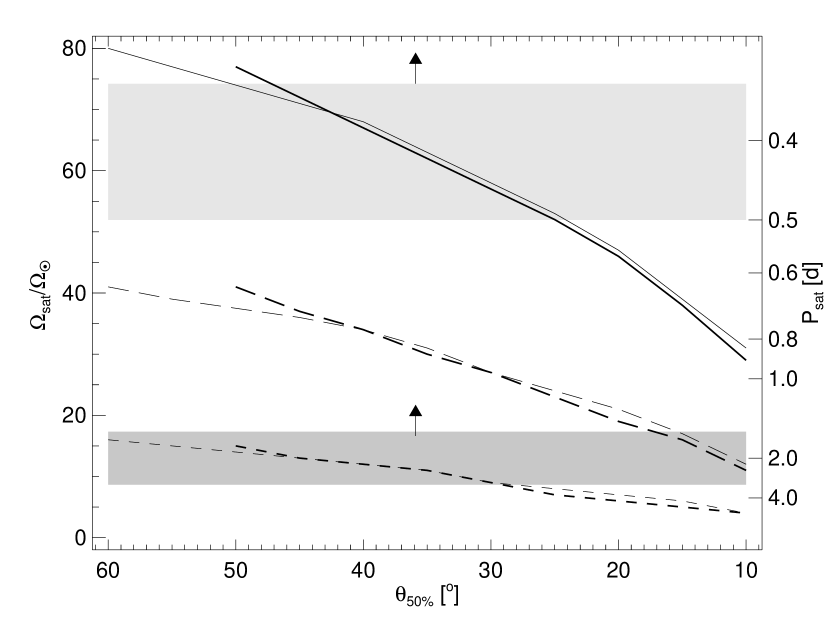
For given initial stellar rotation rates and flux distributions, the curves333Note that this comparison considers exclusive mechanisms only, that is how a saturated dynamo with a uniform flux distribution corresponds to an unconstrained dynamo with non-uniform flux distribution. describe nominal dynamo saturations which cause similar rotational histories like a non-uniform flux distribution with a -open flux level at the respective co-latitude. If the actual dynamo saturation rate is larger than then nominal one, the rotational evolution is likely to be dominated by the impact of the non-uniform flux distribution. If, in contrast, the actual dynamo saturation rate is smaller than the nominal one, then the behaviour of the magnetic dynamo is expected to dominate the evolution. A concentration of magnetic flux at high latitudes of rapidly rotating stars can therefore imitate a rotational evolution like a dynamo saturation limit of about . In case a considerable amount of open flux is located at intermediate or low latitudes, as indicated by recent field reconstructions based on ZDI observations, the nominal saturation level would be rather high () and therefore probably beyond the actual dynamo saturation limit. In this case non-uniform flux distributions alone could not account for the very high rotation rates of young stars.
4 Discussion
Our results show that a concentration of open magnetic flux at high latitudes of active stars yields rotational histories which deviate up to about (early MS phase) to (late MS phase) from the rotation rates obtained in the case of uniform surface fields. The reduction of the AM loss rate entails a quicker increase of the stellar rotation rate during the PMS spin-up and a moderated spin-down during the MS evolution. The higher the (initial) rotation rate, the larger the AM loss due to magnetised winds, and the larger the susceptibility to variations in the open flux distribution. The influence on the rotational history is a cumulative effect, which depends on the evolutionary stage of the star but eventually also on the applied model assumptions.
4.1 Model considerations
In our wind model the poloidal magnetic field component is prescribed to be radial (cf. 2005smaamldtlmw), whereas a fully consistent treatment of the multi-dimensional problem, including the trans-field component of the equation of motion, is found to show a collimation of open field lines toward the rotation axis with increasing distance from the star (e.g., 1985A&A...152..121S). The influence of this effect on our results is difficult to quantify, because investigations focused on this phenomenon are usually limited to particular and illustrative cases. Another approach to include a non-uniform magnetic field topology is the stellar wind model of 1987MNRAS.226...57M, which incorporates in the vicinity of the stellar surface polar ‘wind’ and equatorial ‘dead zones’, the latter preventing plasma escaping from the star and thus reducing both the mass and AM loss rate. Whereas in this model the extent of the dead zone depends on the rotation rate of the star, the magnetic field distribution at the surface is prescribed to be dipolar. Based on the formalism of 1968MNRAS.138..359M and 1987MNRAS.226...57M, 1988ApJ...333..236K derived a parametrised description of stellar AM loss rates through stellar winds, which also comprises qualitative variations of the magnetic field topology; a definite association of non-uniform magnetic flux distributions with the respective model parameter is however missing. Although it remains to be investigated how more complex flux distributions alter the magnetic field topology of stellar winds including effects like collimation or dead zones, we deem these aspects to be less crucial since our analyses are based on relative deviations between two rotational histories. However, more detailed studies concerning this hypothesis are required.
The surface averaged magnetic field strengths, covering here roughly two orders of magnitude over the range of relevant rotation rates, are consistent with observations both in the case of the Sun and rapidly rotating stars (e.g., 1997MNRAS.291....1D). The localised peak field strengths are, depending on the location of the -open flux level and the non-uniformity of the flux distribution, even larger (up to the order of kilo-Gauss), which is also in agreement with observations.
The even flux distribution of the Coronal Hole model and the peaked distribution of the Latitudinal Belt model simulate complementary non-uniformities and allow us to assess the sensitivity of the results beyond our -open flux classification. Whereas both cases are consistent within , we expect this tolerance level to be larger for more complex flux distributions. But in view of the current observational and model limitations a more sophisticated classification scheme appears yet to be inappropriate.
The thermal wind properties are described by solar-like values, which are taken to be independent of the rotation rate, the stellar latitude, and the evolutionary stage of the star. Although there are indications for a rotation-dependence of the coronal temperature and density (e.g., 1991MNRAS.252P..21J; 2003ApJ...599..516I), it is difficult to derive accurate wind parameters, since observational wind signatures are veiled by the outshining coronal emission. The polytropic index of implies an efficient heating and thermal driving of the stellar wind; its value lies well in between those of similar studies (e.g., 1985A&A...152..121S; 2000ApJ...530.1036K). It has been chosen to ensure stationary wind solutions at all latitudes even for small rotation rates, when the magneto-centrifugal driving is inherently small. This implies that the contribution of the latitude-independent thermal driving is relatively large compared with the latitude-dependent magneto-centrifugal driving. In case of a weaker thermal driving, either because of cooler coronae or a smaller energy flux in the wind, the impact of non-uniform flux distributions is expected to be even stronger than described above. If, in turn, magnetised winds turn out to be hotter, latitude-dependent effects may be diminished (given that the thermal wind properties themselves are not latitude-dependent).
The rapidly rotating stellar core represents an AM reservoir which is tapped by the envelope during the MS evolution. The efficiency of the internal coupling, quantified through a characteristic timescale (here determined to be ), is under debate, with previous studies investigating values over a very large range, from very short (solid-body rotation; e.g., 1997A&A...326.1023B) to very long (essentially decoupled differential rotation; 1993MNRAS.261..766J; 1998A&A...333..629A) timescales. The results are typically not fully consistent with all observational constraints given by the rotational distributions of stars in young open clusters of different age, which may point out possible deficiencies of previous models. In this respect the non-uniformity of surface magnetic fields presents an additional and so far rather ignored ‘degree of freedom’, which may help to match theoretical and observed rotational histories of stars.
4.2 Relevance to dynamo efficiency and saturation
Our comparison of the impact of non-uniform flux distributions with the influence of other magnetic model parameters underlines its importance. The dynamo efficiency, that is the dependence of the (here, open) flux generation on stellar rotation, is generally accepted to increase with the rotation rate. Analytical relations based on the theory of -dynamos (e.g., between the dynamo number and the Rossby number; 1984ApJ...279..763N; 2001MNRAS.326..877M) as well as empirical relationships between the rotation rate and magnetic activity signatures like the coronal EUV and X-ray emission (1995A&A...300..775M; 1995A&A...294..515H; 2003A&A...397..147P) imply power law-dependencies over a large range of rotation rates. 1972ApJ...171..565S found the evolution of chromospheric activity to decrease with time following . This relation implies a linear increase of the characteristic stellar magnetic field strength with rotation rate; an example for the commonly agreed concept that the decrease of magnetic activity with age reflects the evolution of the stellar AM and rotation rate. According to 1991LNP...380..389S, it is however more the magnetic flux which increases linearly, instead of the field strength. The linear dynamo efficiency is widely used in studies about the rotational evolution of stars (e.g., 1995A&A...294..469K; 1997ApJ...480..303K). Here, for deviations from the linearity between the rotation rates on the early MS are found to differ between and . Our analysis has shown that non-uniform flux distributions can easily produce similar deviations. A large fraction of open flux in the vicinity of the stellar poles can therefore compensate the influence of a super-linear dynamo efficiency, feigning a less efficient (e.g., linear) dependence on the rotation rate.
A concentration of magnetic flux at high latitudes has qualitatively a similar influence on the rotational history as a dynamo saturation. Since both effects entail a reduction of the AM loss rate, their synergistic action is expected to enable even higher rotation rates. Figure 13 allows for estimates (based on the comparison of exclusive effects) of the principal contribution to the overall reduction of the AM loss. If the saturation limit of the chromospheric and/or coronal emission () is representative of dynamo saturation, then we expect non-uniform flux distributions to contribute only marginally to the reduction of the AM loss. If, however, the photometric saturation limit () reflects the saturation of the dynamo mechanism, then the rotational evolution of most stars is dominated by the actual non-uniformity of the surface flux distribution. But the saturation of indirect activity signatures does not a priori indicate a saturation of the underlying dynamo processes in the convective envelope, since the former also depend on, for example, atmospheric properties and radiation processes which follow different functional behaviours (e.g., 1997A&A...321..177U).
1997A&A...325.1039S applied a bi-modal flux distribution, characterised through polar flux concentrations, to the rotational evolution of stars. For somewhat different model parameters than ours they found a resemblance between the rotational histories subject to their coronal hole model and a dynamo saturation limit of , respectively. Since this saturation limit is of the order required to explain the presence of rapidly rotating stars (), they question the necessity of a dynamo saturation at low rotation rates and argue in favour for values . Whereas our investigation confirms their results in principle, we find that reductions of the AM loss rate resulting from high-latitude flux concentrations are smaller; according to our model a flux distribution with, for example, is equivalent to a dynamo saturation limit of about . The difference with respect to the 1997A&A...325.1039S value () may be due to different model assumptions and parameters. Since our value is still below their supposed dynamo saturation limit of , a strict concentration of magnetic flux around the poles would be able to dominate the rotational evolution of stars. Observations indicate, however, that the -open flux level is likely located at somewhat lower latitudes. Surface brightness maps occasionally show and dark elongated features reaching down to intermediate latitudes (2002AN....323..309S, and references therein), which shift the mean -flux level (averaged over longitude and evolutionary timescales) equatorwards. But the presence of magnetic flux in the form of dark spots is a priori not equivalent with the presence of open magnetic field lines. A more striking constraint arises from ZDI observations, which in combination with field extrapolation techniques allow for the reconstruction of the magnetic field topology and the determination of the actual surface and latitudinal distribution of open magnetic fields. Although the number of detailed observations is yet rather small, first results show that the principal part of (detectable) open flux is apparently located at intermediate latitudes (2004MNRAS.355.1066M), which motivated our Latitudinal Belt model. The cumulated flux distributions of AB Dor (cf. Fig. 1) show that the average -flux level is indeed located between . In this range of values our equivalent saturation limit for rapid rotators is and the impact of the non-uniform flux distribution consequently smaller than the influence of the dynamo saturation at supposed by 1997A&A...325.1039S. In this sense, we consider the effect of non-uniform flux distributions more as a complementary rather than an alternative mechanism for the formation of rapid rotators, which is however based on observationally verifiable principles.
4.3 Observational constraints
Compared to the large number of observed surface brightness distributions of rapidly rotating stars (2002AN....323..309S), ZDI observations of actual magnetic flux distributions are yet rather sparse. A larger database in this field is required to put tighter constraints on possible open flux distributions, that is the qualitative and quantitative description of its non-uniformity and dependence on the stellar rotation rate and the evolutionary phase of the star (including its dependence on stellar mass). Whereas, for example, brightness distributions indicate a clear poleward displacement of starspots with increasing rotation rate, for open flux a similar relationship is yet not available. ZDI observations are handicapped through insufficient signal levels from dark surface regions, so that an unambiguous determination of the flux topology inside dark polar caps (i.e., whether it is mainly unipolar and open or more multi-polar and closed) is yet hardly possible (1997A&A...326.1135D; 2003MNRAS.345..601M). If the field reconstructions in the case of AB Dor and LQ Hya prove to be representative and characteristic for rapid rotators, then we consider the contributions from high-latitude regions to the total AM loss rate to be of minor importance for the rotational evolution of rapid rotators.
Owing to their qualitatively similar behaviour it is questionable whether the impact of non-uniform flux distributions can be observationally separated from the influence of a dynamo saturation. This potentially limits the usefulness of rotation rate distributions as tests of dynamo theories, unless they are supplemented by more detailed information about the structure of stellar magnetic fields. A larger observational database is required to refine the rotation rate beyond which the location of the -open flux level is high enough to cause a discernible impact on rotational distributions of cluster stars. Supposed that the limiting rotation rates for high-latitude -flux levels and dynamo saturation are sufficiently low and high, respectively, it may be possible to distinguish characteristic signatures of non-uniform flux distributions in the (differential) distribution of intermediate rotators with rotation rates in the domain constrained by the two limiting values.
An important role may fall to theoretical models concerning the pre-eruptive evolution and post-eruptive transport of magnetic flux to high latitudes in rapidly rotating young stars (e.g., 2000A&A...355.1087G; 2004MNRAS.354..737M), since they allow for a verification of our insight into stellar magnetic properties by means of activity proxies like (the rotational modulation of) coronal X-ray and chromospheric UV emission (1993A&A...278..467V). Observations in the UV/EUV spectral range may also be used to refine our assumptions about the thermal wind properties, comprising its latitudinal and rotational dependence, because the total AM strongly relies on the stellar mass loss rate and on the acceleration of the wind through thermal driving.
5 Conclusion
Non-uniform magnetic flux distributions have a significant impact on the rotational evolution of stars, mimicking the effect of a large range of dynamo efficiencies and saturation limits. They present an additional degree of freedom in the modelling of stellar rotational histories, which can generate differences cumulating up to . Neglecting their effect implies considerable uncertainties in other magnetic field-related model parameters such as the dynamo efficiency of up to about . Although our results are, in principle, in agreement with those of 1997A&A...325.1039S, we find the effect of non-uniform flux distributions to be less efficient than in their investigation; whereas they find that a concentration of magnetic flux at polar latitudes imitates a nominal dynamo saturation limit at , we find values of about .
Non-uniformities in the form of strong flux concentrations at high latitudes efficiently reduce the AM loss through magnetised winds, entailing high stellar rotation rates. Since magnetic field distributions reconstructed on the basis of ZDI observations however indicate a considerable amount of open flux at intermediate latitudes, the anticipated reduction of the AM loss is expected to be smaller than implied by frequent DI observations of high-latitude starspots and polar caps. The influence of non-uniform flux distributions alone thus appears to be insufficient to explain the existence of very rapid rotators, but their significant moderation of the AM loss rate makes the requirements for a dynamo saturation less stringent, enabling saturation limits .