The Impact of Energy Feedback on
Quasar Evolution and Black Hole Demographics
Abstract
We investigate how accretion episodes onto massive black holes power quasars and active galactic nuclei while they accumulate mass into the holes. We implement an analytic approach to compute both the trend and the stochastic component to the trigger of the accretion events, as provided by structure buildup after the hierarchical paradigm. We base on host galaxy evolution proceeding from the protogalactic era at redshifts dominated by major merging events in high density regions, to the subsequent era marked by galaxy-galaxy interactions in newly forming groups. These dynamical events perturb the gravitational equilibrium of the gas reservoir in the hosts, and trigger recurrent accretion episodes first in the Eddington-limited regime, later in a supply-limited mode controlled by energy feedback from the very source emission onto the surrounding gas. Depletion of the latter by these events (adding to quiescent star formation) concurs with the slowing down of the clustering to cause a fast drop of the activity in dense regions. Meanwhile, in the “field” later and rarer events are triggered by interactions of still gas-rich galaxies, and eventually by captures of dwarf satellite galaxies; these are also included in our analytic model. Thus we compute the quasar and AGN luminosity functions; we find these to brighten and rise from to , and then toward to dim and fall somewhat, in detailed agreement with the observations. From the same accretion history we predict that for the mass distribution of the holes progressively rises and shifts rightwards; we compare our results with the local data. We also find that downward of the Eddington ratios related to emitting, most massive holes drift below unity on average, with a widening scatter; meanwhile, some smaller holes flare up closer to the Eddington limit. We conclude that the accretion history, however rich, is dominated by dwindling events triggered by interactions under the control by feedback; these establish a link between the declining but widely scattered distribution of the Eddington ratios and the tight, closely stable upper section of the correlation. Two clearcut predictions arise from our interaction picture: the BH activity will appear to follow an anti-hierachical trend; the QSO-AGN population is expected to be bimodal, and related to the bimodal galaxy population.
keywords:
black hole physics – galaxies: active – galaxies: interactions – galaxies: nuclei– quasars: general .1 Introduction
Accreting black holes (BHs) with masses are widely held (Rees 1984) to energize Active Galactic Nuclei (AGNs) and quasars (QSOs) and produce their huge bolometric outputs that approach erg s-1 (e.g., Groote, Heber & Jordan 1989, Hagen et al. 1992, Maraschi & Tavecchio 2003). Not only strong gravity but also large mass inflows up to some yr-1 must be involved in these objects, even when the overall efficiency for converting gravitational into radiative energy is up to 10%.
By the same token the BH masses
| (1) |
are expected to keep the archives of the luminous history of these sources down to the cosmic time ; barring major silent accretion, the above equation relates the cumulative variable to the quantity which signals current source activity.
The integral nature of Eq. (1) allows three main activity patterns, as originally discussed by Cavaliere & Padovani (1988), see also Kembhavi & Narlikar (1999). For one, the QSO population could be comprised of a limited number of sources continuously active over several Gyrs, that accumulate large masses in excess of while emitting lower and lower outputs , to agree with the fall observed in the bright QSO population for redshifts (see Osmer 2004 for a review). But then the ratios ought to drop sharply with the cosmic time ; strong -dependence would also occur in the relation between the increasing BH masses and the more persisting properties of their host galaxies, e.g., the velocity dispersion . However, this specific pattern is ruled out by the observations of supermassive BHs widespread in many local and currently inactive galaxies, with an upper mass envelope at (see Tremaine et al. 2002); a similar bound is also found for QSOs shining at higher (see McLure & Dunlop 2003, Vestergaard 2004).
At the other extreme, Eq. (1) holds as well during a single accretion event of a mass over the time scale Gyr to yield a flash of bolometric luminosity . Here each BH’s mass is accreted in one go over a constant , so applies and the ratios ought to be closely constant. Here the QSO fall would be made up by many sources active only once and briefly, conceivably self-limited by the radiation pressure at the Eddington value , with exponentiating on the Salpeter timescale Gyr. Over the cosmic time new BHs ought to form continuously, but with progressively lower masses for so as to track the observed population decline to lower luminosities while retaining constant Eddington ratios . For this to occur, the trend in the hierarchical formation of structures toward ever-growing masses would have to be reversed in a closely tuned way for the active BHs (see discussion by Merloni 2004). Then the tight correlation observed between the BH masses and the bulge velocity dispersions (first pointed out by Ferrarese & Merritt 2000, Gebhardt et al. 2000) would evolve markedly, being progressively extended toward smaller for decreasing , still with a narrow scatter.
Finally, the luminous history may involve in many bright galaxies a number of recurrent accretion events with decreasing outputs; then Eq. (1) yields
| (2) |
and the BH mass has the form with the few first contributions dominating. Now the individual BH’s masses will grow moderately with , in accord with the intrinsic hierarchical trend but in accord also with the decreasing average luminosities. Such limited supplies will cause a mild drift of the average Eddington ratios below the value , but only weak evolution in the relation. Here we plan to discuss the latter two activity patterns, motivated by a number of observations.
Shields et al. (2003) observe the correlation to be largely in place at epochs at least in its upper range, the masses being afterward modified by factors of a few at most. The single-flash pattern of activity with const hardly accords with these findings, see discussion by Corbett et al. (2003); it also disagrees with the considerable scatter shown by ratios .
As to the latter, Eddington luminosities are welcome at the highest observed redshifts , when the age of Universe was definitely shorter than 1 Gyr and yet powerful QSOs with erg s-1 already appear in the SDSS data (Fan et al. 2003). These sources require minimal BH masses if they shine at , a condition that also fosters fast growth from much smaller seeds. In fact, for McLure & Dunlop (2003) find sources with Eddington ratios often attaining values (see also Corbett et al. 2003), but undergoing a slow average decrease toward . In addition, Vestergaard (2004) finds to show large, partly intrinsic scatter at all redshifts , with a declining upper envelope for the massive objects as decreases. These observations indicate that the radiation pressure limit to accretion is often attained at high , but also that it does not always constitute the tightest constraint at lower . We propose that for a supply limit may be more effective for many BHs.
The counterpart of Eq. (1) extended to the entire unobscured population (or populations) is provided by the relation (cf. Soltan 1982)
| (3) |
Here is the bolometric luminosity function (LF) of the quasars and AGNs, and is the mass distribution (MD) of the related BHs.
The development of the former is known to be sharp, coherent and non-monotonic; the QSO luminosity density peaks at the epoch corresponding to , and rises and falls on both sides on timescales of a few Gyrs (Schmidt 1989, Osmer 2004). In detail, the optical LF “evolves” sharply from the Local Universe, with the number of luminous QSOs rising out to (see Grazian et al. 2000; Croom et al. 2004). Past this redshift, “negative evolution” occurs with the luminous QSOs dwindling on average out to and beyond (see Kennefick, Djorgowski & De Carvalho 1995; Schmidt, Schneider & Gunn 1995; Fan et al. 2001). A similar trend is also shown by the LF observed in the X-ray band out to (see Miyaji, Hasinger & Schmidt 2000; La Franca et al. 2001; Cristiani et al. 2004a).
Less known is the behaviour of the MD. The local distribution has been estimated from the observations of a number of relic supermassive BHs (see Yu & Tremaine 2002; Marconi et al 2004; Shankar et al. 2004). These authors find the integrated mass density to take on local values in the range Mpc3, consistent after Eq. (3) with the optical emissions from QSOs summed to the X-ray emissions from AGNs, with a considerable contribution from obscured sources. In the range where the quasar population declines, these AGNs still contribute appreciably to the BH masses; eventually, the dominant contribution comes from the AGNs pinpointed in X-rays (Hasinger 2003, Fabian 2004, Cristiani et al. 2004a).
We stress that Eqs. (3) and (1) with their integral nature require neither the variables and to be linked by a constant value of , nor the functions and to be linked by a relation of the type in terms of the emission duty cycle . In fact, both assumptions, however appealingly simple, run at some point against a piece of the available data, especially on our side of the QSO peak. In this paper we shall relax these assumptions, and will widen our scope to derive the actual relationship between and and between and ; in §2 we give our guidelines. In §3 we describe how supermassive BHs form and shine at while their protogalactic hosts are built up. In §4 we compute how formed BHs are re-fueled during the subsequent era by interactions of their hosts with companion galaxies in dense regions. In §5 we develop our formalism to evolve the BH mass function throughout the two above eras. In §6 we derive the QSO luminosity function evolving under the drive of the above BH accretion history. In §7 we consider the late fueling events due to interactions in low density regions and to captures by the host of satellite galaxies. In §8 we sum up and discuss our findings.
Our framework will be provided by the “Concordance Cosmology” with km/s Mpc, (see Bennett et al. 2003); this implies the relation we use between and , namely, Gyr.
2 Our guidelines
Many authors have attempted to model the connected evolution of the BH MD and of the shining QSO LF, particularly: Cavaliere & Vittorini (2000 and 2002, CV00 and CV02 hereafter), Kauffmann & Haehnelt (2000), Cattaneo (2001); more recently yet, Volonteri, Haardt & Madau (2003), Menci et al. (2003), Wyithe & Loeb (2003), Steed & Weinberg (2003), Marconi et al. (2004), Granato et al. (2004), Merloni (2004).
In the present paper our guideline will be that such a connection has to take place through the Eqs. (1) and (3) intrinsic to any accretion process. These processes are far from trivial, since to power sources as luminous as the bright QSOs they have to involve large gaseous masses and high accretion rates. For outputs exceeding erg s-1, masses or more must be funnelled toward the central BH in times Gyr or less. In addition, these accretion episodes must be coordinated into the highly coherent, non-monotonic evolution the QSOs exhibit on scales of a few Gyrs over a span of about 13 Gyr.
Large gravitational perturbations involving a considerable volume of the host galaxies, such as merging of protogalaxies or galaxy-galaxy interactions, are required in order to distort the galactic potential on kpc scales, and remove enough angular momentum from the galactic gas so as to start it on an inward course toward the central BH.
But major mergers of the dark matter (DM) host haloes as the only accretion triggers hardly can account for the observed strong evolution of QSOs for . In fact, as discussed in detail by Menci et al. (2003), the widely agreed paradigm of hierarchical growth of cosmic structures implies the merging rate at galactic scales to decrease slowly by a factor of some from the QSO peak to the local Universe. This by itself would lead to overpredict the bright QSOs surviving at low , at variance with the dramatic fall observed in the QSO population which entails factors of order in the number of bright sources. Even when account is taken of the galactic gas exhaustion due both to BH accretion itself and to thhe ongoing star formation (see Kauffmann & Haehnelt 2000, Cattaneo 2001), the computed population of QSOs with blue magnitudes would still outnumber that observed for . Moreover, the MD accordingly computed differs considerably at from what is inferred on the basis of the observations and the distribution of the velocity dispersions (see Wyithe & Loeb 2003).
We instead relate BH growth with QSO and AGN luminosities from considering the rich picture that arises naturally after the hierarchical formation of cold DM structures; this envisages the initially minute density perturbations to grow, collapse and virialize under the drive of the gravitational instability, and in closer detail to merge with similar clumps into larger structures (see Peebles 1993). We follow this standard course, and consider how the various dynamical events it predicts affect the dynamical life of the host galaxies and trigger different modes of accretion onto the central BH.
These events include the early major mergers that assemble the massive protogalaxies, but also include later and milder tidal interactions of the formed hosts with companion galaxies in dense environments like groups, or even in lower density environments such as the Large Scale Structures (LSS); eventually, the hosts cannibalize their retinues of satellite galaxies. The interactions in dense environments (groups in particular), while still able to trigger large inflows of the galactic gas toward the nucleus, outnumber the bound mergers for , consume more gas and decay faster, so speeding up the QSO evolution (see Menci et al. 2003).
Later on for “field” processes such as interactions of gas-rich hosts in LSS and satellite cannibalism together are left as the dominant, if often meager fueling mode, so as to be phenomenologically perceived as a later AGN population as opposed to that related to dense environments.
We let all these dynamical events, with their overall trend and their stochastic component, to form or rekindle the BHs as they may; we just record the outcomes from the integral relationship Eq. (1) of with . As discussed in detail in §4, our key parameter here will be the gas fraction destabilized by an interaction, with values around based on transfer of angular momentum from the orbital motion of the partner to the host gas, and confirmed by numerical simulations.
We also compute and separately but consistent with the integral relation Eq. (3), and compare these distributions with the observed ones. Such observable will be related to the statistics of the interactions based upon the mass distributions of galaxies in groups, for which we adopt the standard Press & Schechter (1974) mass function.
We stress recent, direct evidences of activity connected with clearly interacting galaxies given by Rifatto et al. (2001), Komossa et al. (2003), Ballo et al. (2004), and Guainazzi et al. (2005), who report AGNs hosted in both galaxies of the interacting systems ESO 202-G23, NGC 6240, Arp 299, and ESO509-IG066, respectively. These findings complement the extensive, long known body of evidence indicating that some 30% QSO and strong AGN hosts have close companions or show signs of ongoing interactions, see the many single observations referred to in CV00, and the statistics by Bahcall et al. (1997) and by Kauffmann et al. (2003). The evidence is even more significant in view of the different times conceivably taken by inner fueling and by outer disturbances, see the discussions by Beckman (2001) and by Tadhunter et al. (2005), with the references therein.
One feature specific to the present work is our structural inclusion of the effects from the source output itself onto the BH; we investigate how such an energy feedback from QSO emissions onto the surrounding gas can regulate the amount actually accreted and stored into the BHs. In fact, accretion is expected to be impaired or utterly halted when the gas binding energy in the host is balanced by the energy deposited by the source into the surrounding gas during a dynamical time, see Silk & Rees (1998).
Whenever the accretion is so feedback-constrained, the balance condition clearly translates into a steep relation between the mass accreted and the depth of the host potential well. In closer detail, we will compute how the feedback affects the evolution of the relation, the Eddington ratios, and the evolving LF and MD. As discussed in detail in §3, the key parameter here will be the feedback efficiency to deposit source energy into the host gas; we will use values a few following from momentum conservation from radiation to gas, and consistent with independent lines of data.
3 Forming BHs in protogalactic haloes for
Taking up from CV02, it is convenient to divide the growth of the BHs into two main regimes that overlap around , with later additions.
At early epochs , supermassive BHs grow mainly during the major merging events that in dense environments build up massive protogalactic haloes of masses . By these events large amounts of gas are destabilized and funnelled towards the galactic centre to be eventually accreted onto the BH. Meanwhile, the same events also replenish the host structures with fresh gas supplies, and so sustain the amounts of galactic gas at nearly cosmic levels . As a result, the accretion is often self-limited at nearly Eddington rates with , while protogalactic haloes and BHs grow together but not necessarily in a proportional fashion. Thus during this era it is appropriate to assume that BHs form with masses directly related to the mass of the galactic hosting halo.
We may express in terms of the DM velocity dispersion , noting that for the standard isothermal sphere applies, while for the DM profiles by Navarro, Frenk & White (1997) a similar value holds at the virial radius R. To actually relate to , we will consider two different models.
The unconstrained accretion model (UA) focuses on BH coalescence directly following the merging of their host haloes; this yields the simple proportionality (see Haehnelt & Rees 1993, Volonteri, Haardt & Madau 2003). When expressed in terms of in units km s-1 this yields
| (4) |
The first relation obtains at a fixed virialization epoch, considering that holds in terms of the DM density in the haloes. The steeper course on the r.h.s. obtains from considering (Haehnelt & Kauffmann 2000) that the -dependence may be approximately rephrased in terms of an additional dependence (plus a wide residual scatter), because at high the standard hierarchical scaling applies, having used the index for the power spectrum of initial density perturbations on galactic scales. When translated in terms of of the stellar velocity dispersions in the galactic bulges as indicated by Ferrarese (2002), by Baes et al. (2003) and by Pizzella et al. (2004) the resulting average relation turns out to be too flat compared with the slope observed by Ferrarese & Merritt (2000), Gebhardt et al. (2000), while the scatter is still too large. Note that a similar argument extended to , when the Concordance Cosmology modifies the scaling laws into , would yield instead too steep a relation .
These drawbacks leads us to consider the alternative model based on feedback-constrained accretion (FCA) that includes the energy balance suggested by Silk & Rees (1998) and worked out by Haehnelt, Natarajan & Rees (1998); analogous results come from more detailed work, e.g., King (2003), Granato et al. (2004), and Lapi, Cavaliere & Menci (2005). The balance condition reads
| (5) |
This applies since gas unbinding and outflow occurs and accretion is halted when the fractional quasar output deposited within a dynamical time yr into the current gas mass in the host exceeds the binding energy of the gas. We begin with assuming effective values based for radio-quiet QSOs upon momentum conservation between radiation and gas that yields (in the absence of cooling) values up to a few ; for radio-loud QSOs the kinetic energy in the jets affords higher efficiencies, but the statistics of such sources is down to 10, so conserves the weighted value. The latter is independently confirmed on considering (Lapi, Cavaliere & Menci 2005) its effects on the density of, and the X-ray emission from hot gas in groups of galaxies surrounding the quasar hosts. We also assume to be independent of the host mass, a point to be discussed in §8.
Recall now that the hosts are resupplied with fresh gas under halo merging; so as long as the overall gas mass retains nearly cosmic values , the balance condition straightforwardly yields
| (6) |
In terms of , this is close to the observed slope (the prefactor at after additional mass has been accreted is discussed below and given in Eq. 30). Eq. (6) may be recast into the form , to make clear that feedback constrains smaller haloes to form or grow BHs with a lower efficiency .
In both models, during this era the QSO outputs – sustained at Eddington levels – are distributed after a LF directly related to the halo MD by the relation ; this is in terms of the hierarchical halo formation rate , which decreases toward masses smaller than the average mass virializing at (see Cavaliere, Colafrancesco & Scaramella 1991), so that the r.h.s. only approximately reads . By the same token, the hole MD is also linked as given by
| (7) |
to , or to the equivalent distribution . As for the former, we use the simple expression first proposed by Press & Schechter (1974) updated to the Concordance Cosmology. The MD computed from Eq. (7) constitutes at an initial condition to be evolved afterward under the drive of the interactions described in §4.
The LF at early had been preliminarily computed and discussed by CV02. They stressed that for the FCA model with the ensuing non-linear stretching yields LF shapes generally flatter than their UA counterparts, and more in tune with the then existing data at high and bright (Fan et al. 2001). At fainter the present model – with the smaller prefactor corresponding to Eq. (6), consistent with the additional accretion we envisage at later – yields an even lower LF, in tune with the recent observations by Cristiani et al. (2004b), see Fig. 6. If needed, the LF may be fine-tuned on using the Sheth & Tormen (1999) rendition of the halo MD instead of the simple Press & Schechter (1974) form, and on adjusting the still unsettled amplitude of the initial perturbation spectrum. In sum, three main intrinsic features concur to limit the number of small BHs active at early : first, the lower efficiency in forming smaller haloes given by , yielded by the hierarchical formation; second, the lower efficiency of these in forming BHs after , due to the feedback process; third, the low prefactor that leaves room for the later increase of the BH masses computed next.
4 Refueling BHs in interacting hosts for
For major mergers become rarer and rarer at galactic scales; fewer new massive BHs are formed at these epochs so their number is conserved to a first approximation (improved in §7), but their mass can still grow. Now the prevailing dynamical events that trigger accretion are best described as interactions between developed galaxies, and these occur mainly in the small, dense groups that at these epochs begin to virialize. By the same token, the gas mass in the hosts is consumed with no fresh imports provided by mergers. So the accretion becomes supply-limited and can be easily sub-Eddington.
Small groups with mass exceeding , radius and bright galaxies membership provide particularly suitable sites for the hosts to interact with their companions (CV00); in fact, in early groups the density of galaxies is high, while their velocity dispersion is still comparable with the galactic , conditions that favour effective binary interactions. These are mainly in the form of fly-by, that is, binary encounters with impact parameter ranging between the galactic radius and the value , that need not lead to bound mergers. The cross section is still close the geometrical value as long as applies , and the average time between these events is given by
| (8) |
the local value is Gyr. As groups merge into rich clusters, decreases strongly following the density in the host haloes, a trend only partially offset by the limited increase of . As a result, the interaction rate declines with time following in the Concordance Cosmology.
An interaction of the host with a group companion of mass will perturb the galactic gravitational potential, and destabilize a fraction of the cold gas mass in the host from its equilibrium at kpc from the centre. The amount funneled to the galaxy centre ends up in part into circumnuclear starbursts, and in a smaller part trickles down to the accretion disk ending up onto the central BH. When the main constraint governing the gas equilibrium is provided by the angular momentum , the fraction may be computed as in CV00 to read
| (9) |
This ranges from some to ; the latter constitutes the expected maximal gas fraction driven into the central pc, as confirmed by aimed numerical simulations of galaxy interactions (see Mihos 1999). Corresponding to larger galaxies being more resistant to gravitational distortion, Eq. (9) shows to scale as .
A fraction around of the inflowing mass reaches the BH rather than ending into circumnuclear starbursts, as indicated by the statistics of the energy sources that heat up the dust in bright IR galaxies (see Franceschini, Braito & Fadda 2003). So is the mass made available for actual accretion, while the rest ends up into stars or is dispersed. The process of fueling takes times of order , the host dynamical time, and spans a few Salpeter times.
Between the limits the probability density for due to the distribution of the orbital parameters primarily reflects the distribution of the masses of the interaction partners; this is because the encounter velocity and the impact parameter vary in narrow ranges, and are actually correlated in a galaxy group. So closely applies; since is distributed after with slightly under , following the Press & Schechter (1974) distribution in its power-law section, the result is close to . Th result reads
| (10) |
This is used to compute the average value ; since applies at given , the result closely reads .
Recurrent interactions will iteratively exhaust the initial gas mass in the host; after interactions the residual mass reads
| (11) |
where each is extracted from the probability distribution Eq. (10).
We will often use the simple estimate for the average value , based on equal average depletion factors ; this is accurate to within up to steps as we shall find below to occur on average from to . We may also write for the average depletion rate the equivalent differential equation
| (12) |
In fact, its discretized solution starting from the initial condition reads just as above when computed at the step given by the integer part of
| (13) |
starting from that corresponds to ; the r.m.s. deviation of the stochastic variable is about to a sufficient approximation. To the depletion given by Eqs. (11) or (12) we systematically add the gas consumption by ongoing star formation, that we compute following Guiderdoni et al. (1998).
As for the mass actually accreted, in this regime of supply-limited accretion we again consider two possibilities.
The unconstrained accretion model (UA), where the accretion is not affected by dynamical feedback, but still are subject to the radiation pressure limit. The mass accreted in each interaction is , distributed as given by the simple counterpart of Eq. (10), namely
| (14) |
where provides the normalization.
The feedback-constrained accretion model (FCA), in which a tighter constraint to is set by the analogous of Eq. (5). This is evaluated on considering that now the accretion may be sub-Eddington, so is to be replaced by , to read ; so the constraint reads now , considering that and apply.
The mass actually accreted is given by the minimum between the amount made available by the interaction, and the constraint set by the feedback; that is to say,
| (15) |
After interactions is rescaled down iteratively as said, to yield the estimate . Note that the total probability of the value is contributed by all interactions leading to accretion events that, if unconstrained, would exceed this value; this leads to piling up of accretion episodes at the upper bound . To account for this, we write the counterpart of Eq. (14) in the form
| (16) | |||||
where .
In all cases the luminosity attained in any one accretion event no longer is in a fixed relation to the current BH mass . This is because the accreted mass depends now on stochastic orbital parameters as given in Eq. (9), and is distributed according to Eq. (14) or Eq. (16) in the UA or the FCA model, respectively.
We end this Section by giving a simple estimate of the final mass of a BH after a number of interactions; when the feedback constraint given by Eq. (15) is effective so as to join smoothly at with the mass similarly constrained by Eq. (6), a simple upper bound is given by
| (17) | |||||
In fact, this is close to the actual value in small and intermediate haloes when the feedback constrains to be close to , see Eq. (15).
With we find , a bound actually approached when the interaction number grows large. More realistically, as is related to (or ) by Eq. (13) on average, the host undergoes interactions from to , of which only the initial or are effective on average; correspondingly, the masses grow by a factor up to . On the other hand, the mass remains unchanged for the BHs that were never re-activated after ; so the growth of spans the range from 1 to 4 at the outmost. This may be rephrased in terms of an overall scatter bounded by a factor 2 from the average, that is, is bounded by 0.3 dex.
5 Evolving the BHs for z
On long time scales the development of the MD of the BHs may be viewed at as a stochastic process that increases , at given and given halo distribution ; the corresponding distribution is denoted by .
This is ruled by the equation
| (18) | |||||
proposed by CV02, and used also by Yu & Tremaine (2002), Hosokawa (2004), Menou & Haiman (2004). The evolutionary rate is contributed by two terms. The first describes the BHs which interact and thereby increase their initial mass , so depleting the number in the mass range . The second describes the number of BHs which start from a lower mass and accrete a gas amount , with probability given by Eq. (14) or (16) for the UA or r the FCA model, respectively. Here is the average time between two subsequent interactions of a galaxy, discussed in §4; moreover, is is the host fraction in dense environment, corresponding to the bright galaxies residing in groups with membership (Ramella et al. 1999). In the above equation the number of BHs is conserved, while they are re-distributed toward larger masses; to a next approximation number conservation may be relaxed on adding to Eq. (18) the appropriate source term as discussed in §7.
To capture the evolutionary trends given by Eq. (18) it is convenient to consider at first small accretion events with , and Taylor expand to second order. So, we end up with the approximate equation
| (19) | |||||
This is similar to a Fokker-Planck equation, actually one based on the probability distribution . The coefficient of the first order derivative represents the average upward drift of the mass under accretion, while the coefficient of the second derivative plays the role of a diffusion coefficient; the averages are computed on using the probability distribution given in Eq. (14) or (16). Note that in the context of QSO evolution (Cavaliere et al. 1983, Small & Blandford 1992), Eq. (19) constitutes a continuity equation for the MD that contains also a diffusive term; correspondingly, not only drifts toward larger masses, but it is also reshaped reflecting the scatter in the masses added by the stochastic re-activations.
Here we give the analytic solution of the above equation in the simple case when the coefficient is constant in time and independent of (see Shankar 2001). We solve for the evolution from an initial mass distribution of the BHs residing in groups at . We perform a transformation to Lagrangean coordinates , where the drift term is absorbed into a total derivative; so we end up with a pure diffusive equation. This is solved by standard methods to yield
| (20) |
Finally, we go back to Eulerian coordinates and obtain our solution . We represent in Fig. 3 the local mass distribution , with the first term due to the dormant BHs that do not reside in groups; both terms are integrated over the variable . We use the following parameter values: the coefficient Gyr is derived from its definition combined with Eqs. (9) and (12), averaged with the use of Eq. (10), and considering also that applies; the second coefficient Gyr is derived similarly, but performing a final time average.
The solution of Eq. (19) in the form is represented by the solid, thin line in Fig. 4. It is seen that the evolutionary trends described by the approximate solution are close to those from the full Eq. (18) where the actual mass additions are finite; the similarity is closer in the FCA case where the probability in Eq. (16) is effectively confined to a narrow range.
To solve the full Eq. (18), we use recursive stepwise integration, having assumed all host galaxies residing in groups (a fraction of the hosts) to undergo an interaction in the time interval . The BHs are formed with initial mass by the end of the era ; each of the subsequent interactions (labeled by the index ) contributes an additional mass . After interactions the BH mass is given by the sum of the stochastic amounts , with . The probability density for is given by Eq. (14) for unconstrained accretion; if instead the constraint by the feedback is effective, will have the probability density given by Eq. (16).
Thus after interactions the solution for at the time provided by Eq. (13) is given by
| (21) |
Here again the first contribution is due to the dormant BHs; , the conditional probability to find a BH mass in a halo with given , is computed with the recursive equation
| (22) |
This starts out with the conditional probability for the initial step , that we express as
| (23) |
by continuity with the correlation produced at the end of the previous era .
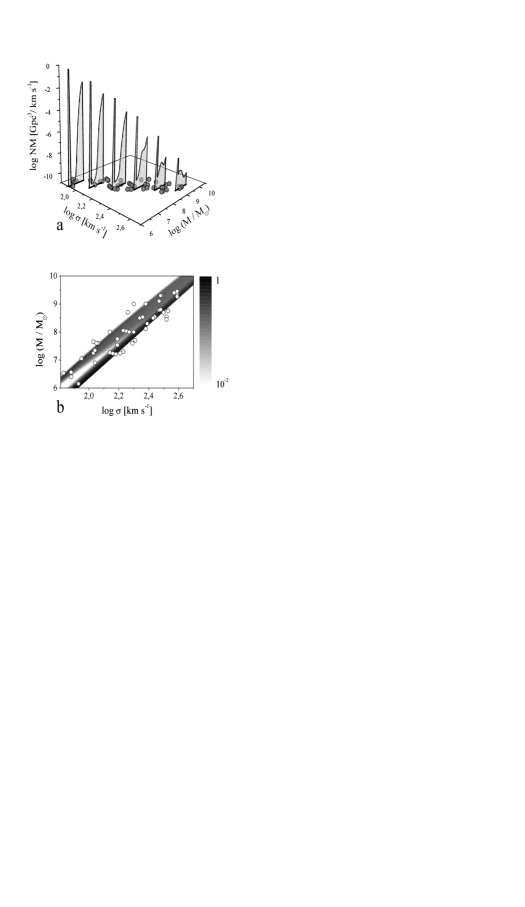
Each sheet in Figs. 1a and 2a represents the contribution, expressed by Eq. (21), to the MD of relic BHs from hosts with a given velocity dispersion . The contribution from hosts that never previously interacted is represented in the form of spikes peaked around the BH masses formed at . The alignment of such spikes shows how these masses are related to after the Eqs. (4) or (6), respectively. At the regime of galaxy interactions in groups begins; now the spikes partially drift and spread along the mass scale, as the BHs grow by such stochastic accretion events. The growth differs in the UA and FCA model.
In the unconstrained model UA (Fig. 1a) the BHs grow by stochastic amounts distributed with the probability given by Eq. (14). This extends over the mass axis with decreasing values. In the feedback-constrained model FCA (Fig. 2a) the growth of the BHs is reduced, being bounded by a factor 4. This is because the constraint cuts off the upper range of the probability distribution tucking it – as it were – at the upper bound of the range of , as described in detail by Eq. (16).
In Figs. 1b and 2b we project onto the plane the probability given by Eq. (21); we have also reported the data concerning as discussed by Tremaine et al. (2002). We predict the feedback-constrained mass accretion to be not so abundant as to materially change the early correlation. So in our constrained model this is rooted back at , with only mild alterations occurring afterwards, and these mainly at intermediate and small masses; the result is consistent with the observations by Shields et al. (2003).
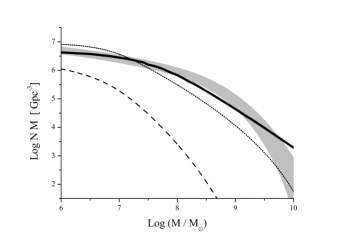
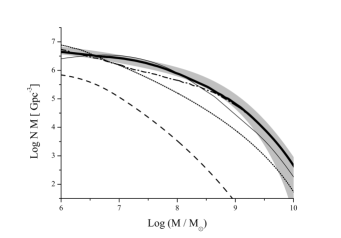
In Figs. 3 and 4 we show the behaviour of , the MD integrated over , i.e., over the sheets shown in the previous two Figures; note the dependencies on of Eq. (21). We illustrate how the MD changes from (dashed lines) to (dotted lines), and then to (thick solid lines); in both Figures the shaded region represents the observational evaluations from local data in different bands (Yu & Tremaine 2002, Shankar et al. 2004). In the UA model shown in Fig. 3 the relic MD at extends toward large masses with a high tail; here the match to the data is poor, since the latter indicate a sharper decline. Fig. 4 shows how in the FCA model the feedback depletes the tail and produces a closer fit to the local data; the accretion so constrained goes to contributing significantly more in the intermediate mass range where it causes the MD to swell, again in agreement with the data. We have included the contribution of later accretion events occurring in the field (to be discussed in §7), to the effect of yet improving at small masses the agreement with the observations, as can be seen by comparison with the dashed-dotted line which does not include this contribution. The approximate diffusive solution for the MD is represented by the thin solid line in Fig. 4.
The same interactions that produce the MD above when time-integrated over several Gyrs, also produce over times Gyr the LF that we discuss next.
6 The luminous evolution for
At high redshifts where the luminosities are expected to be Eddington limited and feedback constrained as discussed in §3, the LF has been computed by CV02; we just recall in Fig. 6 their prediction at to show the agreement with the recent observations by the GOODS survey (Cristiani et al. 2004b).
Here we focus on the the range , an era when the supply is limited due to progressive exhaustion of the gas reservoirs in the hosts by the many accretion episodes that produce . Two reasons concur to cause here a complex relation between LF and MD. First, as anticipated in §1 an accretion episode of a mass over a time produces the luminous output given by Eq. (2); instead, the cumulative mass growth is given by , involving time-integration over the history of the QSO population. Second, the mass made available for the accretion is ruled by the interactions with their stochastic component; so may be quite smaller than , and the accretions may be very sub-Eddington. In other words, the relation of with is no longer tight.
The actual relation stems from the conditional probability distribution for accreting at given , expressed in Eq. (14) or (16) for the UA or the FCA model, respectively. This yields also the conditional probability density for the luminosity to attain in a reactivation the value given by Eq. (2), and then fade out. So at any given time we have
| (24) |
where effectively depends on due to Eq. (12).
Note that in the UA model, the mass accumulated at time into a BH obeys the relation in terms of the residual gas mass in the host; so, the distribution of the latter is directly linked to the MD of BHs. This no longer holds in the FCA model, where we use the average value for given by Eq. (12).
The rate of the reactivations is , in terms of BH number distribution , and of that represents the fraction of hosts residing in groups (see §5) and interacting over a mean time a few Gyrs.
The above components can be brought together to yield the LF, upon using the formalism of the continuity equation along the axis, as developed by Cavaliere et al. (1983). This takes on the form
| (25) |
considering for simplicity light curves equal and monotonically decreasing on the scale . The solution is given by
| (26) |
for the numerical computations represented in Figs. 5 and 6 we use the specific values with Gyr, while saturates to the value soon below .
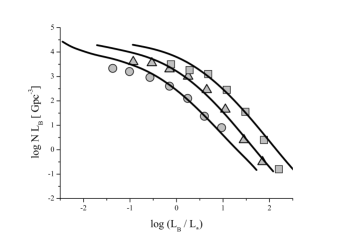
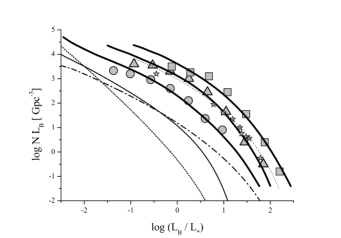
Dependencies on arise in Eq. (26) from the probability distribution that enters Eq. (24), and from the integrated obtained from Eq. (21). Upon convolving over , we obtain the bolometric LF; this is converted to optical luminosity on using the standard bolometric correction of 10. The results are plotted in Figs. 5 and 6 for unconstrained and feedback-constrained accretion – our model UA and FCA, respectively – and are discussed below; we compare them with the data of Boyle et al. (2000) and Grazian et al. (2000). As to , in Fig. 6 and its caption we also recall that in our FCA model the LF has flat shape, low normalization, and behaviour in detailed agreement with the observations over a wide range of at .
Points to be noted are as follows. First, the shape of the LF may be schematically rendered as a rather flat faint section going over to a steeper bright section. The faint section results from the flow along the axis (2nd term on l.h.s. of Eq. 25) of sources fading from their top luminosities (stochastically provided after Eq. 24); the bright section results from the shape of convolved over .
Second, the evolution we expect for the LF may be understood as a combination of a mild “density evolution” and a stronger “luminosity evolution”. The former arises as the interactions re-activate the BHs in groups on a time scale that grows moderately with cosmic time; this causes a decrease of the amplitude of the LF by a factor around down to . The latter evolution occurs because on the same time scale the interactions exhaust the gas content in the hosts according to Eq. (12); less remaining gas means lower luminosities following .
Third, the accretion history we envisage produces at late an excess of sources compared to the optically selected AGNs; this leaves room for sources in X-rays and for obscured objects (Fiore et al. 2003, Ueda et al. 2003). A larger excess is produced at fainter by the field processes to be discussed in §7.
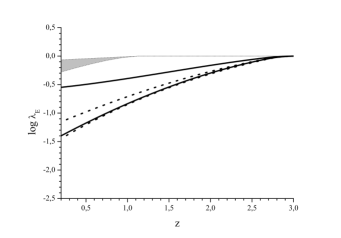
Decreasing luminosities and increasing masses produce Eddington ratios declining on average. In fact, the luminosities of the sources when re-activated at are lower than at by a factor for ; meanwhile, the masses grow at most by a factor 4 as we have seen at the end of §4, so the Eddington ratios decrease to about toward . The actual distribution of at given is computed on convolving the probability for a luminosity given by Eq. (24) and that for a mass given by Eq. (22), with the variables combined as to yield . This may be represented as
| (27) | |||||
considering that for any value of the Eddington ratio holds. Fig. 7 illustrates our numerical results with feedback-constrained accretion, the FCA model that enters through the expressions of from Eq. (16) and from Eq. (22).
The figure shows the complex behaviour of that we find for increasing number of interactions undergone by the hosts. In fact, we have simplified our plots starting them from a sharp initial condition at . The overall decline is due to the average dimming of all luminosities, more rapid in hosts with smaller ; these undergo relatively faster gas consumption due to the scaling discussed in §4. The overall range of is affected by the varying lower end and also by the distribution of ; the result is illustrated by the pairs of lines corresponding to given values of , with two instances named in the caption. The outcome is a correlation between and which is tighter in smaller hosts, more sensitive (in the absence of the limits from cooling or optical depth as discussed in §8) to the feedback constraint.
In sum, as decreases from the average values of decline for the truly supermassive BHs in old spheroids while the intrinsic range covered by widens, consistent with the observations by McLure & Dunlop (2003) and by Vestergaard (2004). Next we consider the higher values of contributed by interactions involving hosts located in the field.
7 Later accretion events in the field
To now we have focused on accretion events driven for by interactions of the old host galaxies residing in dense environments like the groups. But hierarchical clustering also envisages additional ways to feed BHs, which for contribute to accretion onto BHs even when their hosts are located in lower density environments (the “field”).
There some new BHs continue to form by major merging events even at , though at a reduced rate; meanwhile, starving BHs are still refueled by interactions, though on longer time scales Gyr. By the same token, these later and rarer events involve hosts that are still moderately rich of gas, the latter having been depleted only or mainly by quiescent star formation; on similar scales, satellite galaxies begin their plunge into the hosts, importing some fresh gas.
So these later, generally smaller but still considerable accretion events feed what is perceived as a later population of AGNs peaking under . Thereby the LF is enhanced especially at faint bolometric L, and is best observed in the X-ray band; the integrated contribution to the BH masses is appreciable. Since our basic equations Eqs. (18) and (25) are linear, in our computations of the observables we have summed the outcomes of the following three independent processes.
i) Some major galaxy mergers still occur for , if at lower and lower rates. These strong dynamical events may form/grow BHs in recently reshuffled, gas-rich hosts at low . Correspondingly, we add a source term to the r.h.s. of Eq. (18), in the form that yields the host merging rate in terms of . This yields some of all AGNs at ; but these “new” BHs will start below the overall relation, and shine close to at intermediate .
ii) Interactions occur also in non-virialized LSS for . Here the relative velocities are up to km, the upper bound to the pairwise ones; the galaxy densities are lower by about , and so are the related encounter rates . But the hosts so involved are about 4 times more numerous than in groups, which include only a fraction of the galaxies in the field (Ramella et al. 1999). The corresponding rate in LSS to be inserted on the r.h.s. of Eq. (25) is given by ; at this contributes about 10% compared with the rate in groups, a fraction increasing to toward at erg s-1. On the other hand, in these conditions the gas exhaustion rate is lower by compared with hosts in groups, see Eq. (12); this leaves in the hosts correspondingly more residual gas, thus the QSOs so reactivated may burst out at higher Eddington ratios than their coeval counterparts in groups.
iii) The DM merging history also includes many events where the hosts end up cannibalizing their satellite galaxies (see Menci et al. 2003) together with the associated, scant gaseous content; many traces of ongoing such events are being unveiled in our Local Group, see Martin et al. (2004); Law, Johnston & Majewski (2005). Such episodes cause only small accretion and weak, often sub-Eddington AGN emissions; these are easily drowned into the starlight or obscured by dust in the optical band, but are noticeable in X-rays (see Di Matteo et al. 2000). On the other hand, the capture rate is considerable just under , as the cosmic time approaches the time scale of dynamical friction which sets the beginning of the satellite plunge into the central galaxy.
In detail, we consider that the satellites involved have masses , and begin their infall into the host potential well under dynamical friction in standard times Gyr, see Binney & Tremaine (1987). But during the capture the gas in the satellite is peeled off by tidal disruption and stripping (Colpi, Mayer & Governato 1999); so the gas masses reaching the host nuclear region are reduced down to . Assuming that the initial mass function of the satellites follows the low-mass end of the Press & Schechter expression close to , the probability distribution for is given by in the range .
Thus satellite captures constitute another, late stochastic process that contributes to accretion. They affect the evolution of the MD in a way still described by an equation like Eq. (18); but now the average increment is roughly constant in time rather than being proportional to , and occurs in many galaxies. Meanwhile, the number of satellites is depleted from an initial value around , at the rate
| (28) |
so that decreases on scales of several Gyrs.
We illustrate in Fig. 6 how (ii) and (iii) contribute about 70% to the faint end of the integral LF at , and up to 80% at . The latter, dominant contribution undergoes density evolution on the scales of several Gyrs by the decrease of ; this will be luminosity-dependent owing to the basic dependence on the satellite mass. Meanwhile, the contribution to the integrated masses from (ii) and (iii) is considerable, as shown in Fig. 4.
Finally, low outputs are conceivably contributed by independent processes. In elliptical hosts the cooling of the galactic gas can provide sufficient accretion to power low-luminosity radio sources, see Best et al. (2005). In spiral hosts disc instabilities and bar formation provide enough gas inflow to power faint optical AGNs (see Sellwood & Moore 1999, Combes 2003); it will be interesting to see what such processes contribute to the overall LF and MD.
8 Discussion and Conclusions
We have discussed how the standard hierarchical paradigm for structure formation gives rise to a unified if rich picture for the accretion history of the supermassive BHs energizing the QSO and AGN emissions. The paradigm envisages the host galaxies to undergo a sequence of dynamical events beginning with early major mergers in high density environments, and passing over by to milder interactions with companion galaxies in groups; later on, interactions of hosts the field join in, and the overall sequence ends with captures from the retinues of satellite galaxies.
All such dynamical events trigger some gas inflow toward the nucleus, albeit along the sequence the accreted masses decrease on average. At the two extremes of the sequence, major mergers and satellite captures both import fresh gas into the hosts; while the intermediate interactions just tap diminishing gas reservoirs by perturbing the symmetry of the host gravitational potential and inducing non-conservation of the integrals that control the gas equilibrium, such as the angular momentum.
On this basis we have computed several linked observables on using a formalism focused on following both the trend and the stochastic components to the accretion events. We have computed how the statistics of merging events and interactions produce in nearly real time (i.e., within Gyr) the shape of the QSO luminosity functions . We have also computed how their petering out over scales of a few Gyrs concurs with the exhaustion of the galactic gas reservoirs to produce strong evolution in the LF described by our in Fig. 6. Over yet longer scales of several Gyrs their cumulative actions add up to grow the BH masses and to change their distribution as shown by Fig. 4.
We have seen that in the early era , when large proto-spheroids were in the process of buildup through major merging events, the BH masses closely tracked those of the host haloes; correspondingly, the MD of the BHs also tracked closely that of the host DM haloes, see Eqs. (7). These conditions hold at high , when not only the protogalactic dynamical scales are close to the Salpeter time, but also replenishment of galactic gas is granted by the same merging events that trigger the accretion; then the Eddington limit applies to yield . In turn, the MD and the LF grow together at these high redshifts, to yield approximately , as envisaged by Marconi et al. (2004) improving on Small & Blandford (1992).
Our main focus was the later era , when these simple relations break down, and takes on a different course from as does the LF from the MD; basically, this is because now a supply limit applies. In fact, the hierarchical paradigm indicates as main triggers the interactions of the host galaxies within the small, dense groups that at these epochs begin to virialize. These interactions, while no longer providing fresh gas to the host, can funnel toward the nucleus fractions of the residual gas left over by previous events, that are considerable yet lower than the BH mass already accumulated. So in this era it is convenient to represent the luminosities as
| (29) |
to highlight the historic trend embodied in the residual gas mass , and the stochastic component triggered by the last accretion event. At given the strength of such events and the levels of the associated are set by the stochastic distribution related to the orbital parameters of the interactions. The feedback constraint, when effective, cuts off the upper range of and tucks in – as it were – the distribution at its upper end as shown by Fig. 2a.
The result is a basic shape modified by convolution over , see Fig. 6. For the -depending LF embarks on a fast decrease; it is intrinsic to our view that the peak of the QSO evolution should be found at close to the beginning of the virialization era for small and dense groups, the sites most conducive to interactions.
We stress why physical continuity between the two main regimes of accretion is bound to arise across , and how this is implemented in our analytic calculations, in particular as for and . The first issue clearly goes back to the smooth transition large galaxies small groups in the hierarchical scenario, that in particular implies . The second issue is related in the UC model to the close equality , that is ensured when the mass actually accreted on the first interaction satisfies ; this is the case with the average values that we independently evaluate from Eqs. (9) and (10). The related semi-analytic computations by Menci et al. 2003 visualize such a smooth transition. On the other hand, in our FCA model the coupling efficiency is clearly continuous across z = 2.5, and this ensures the condition to hold, as shown in Sect. 4, by Eq. (17) and preceding lines. Note that our coupling levels (independently motivated at the end of §2), imply a supermassive BH (active of dormant) to inhabit nearly all bright galaxies, with masses satisfying the relation. Moreover, Lapi et al. 2005 show that such values for , when used in the feedback balance extended to the hot gas pervading groups, also yields the appropriate relation for the associated X-ray emissions.
While the first population of QSOs and powerful AGNs of high density ancestry is on its decline, at our LF shows an excess of faint QSOs over standard Type 1 sources; as shown in Fig. 6, the excess relatively increases at fainter bolometric luminosities erg s-1 and toward lower , mainly due to the field processes discussed in §7. These summed excesses emerge at as a later population of AGNs, consistent with the observed numbers of X-ray selected and obscured AGNs, see Hasinger (2003), Fabian (2004) 111Our referee has kindly pointed out to us that the the new optical LFs of Richards at al. 2005, preprinted after the submission of our MS, agree even better with our predicted excess at faint magnitudes.
Correspondingly, albeit in a fashion softened by its time-integrated nature, changes for by drifting to larger while undergoing considerable reshaping. As shown by Fig. 4 the latter is in the form of swelling in the intermediate range, related to the stochastic distribution being tucked in by the feedback limit. The overall change we compute ends up in a shape agreeing with the local observations; Fig. 4 shows this to be the case throughout the observed range, and predicts what will be observed at higher .
The relic, local mass density in BHs is computed on the basis of Eq. (3) from our feedback-limited MD increases, and yields a factor close to 3 from to , to attain a local value of Mpc-3 in agreement with the estimates by Tremaine et al. et al. (2002) and by Shankar et al. (2004). This includes the excess we find at intermediate and over the Type 1 AGNs; the value goes up to Mpc-3 on including also the late accretion processes in the field.
Two more imprints are left by this rich history. One is to be found in the steep and tight relation of to the DM velocity dispersion in its upper section. In the FCA model we find that Eq. (6) is updated to by the additional mass increase given by Eq. (17), to read
| (30) |
illustrated by Fig. 2b. This translates into in terms of the velocity dispersion of stars in the bulge (see §3), which agrees with the observations (recall that km s-1). Here the scatter is moderate, in fact, bounded by 0.3 dex, first because the next recurrent events contribute progressively less mass on average; second, because the actual accretion is constrained by the feedback. In fact, the latter effect is dominant in hosts with km s-1 when the quasar output is coupled to the surrounding medium at levels . In full, the limit is provided by Eqs. (15) to read ; on recalling from §4 and §3 that applies, the condition may be recast to read
| (31) |
At the other extreme of small haloes we note that a BH may end up its trajectory on the plane above the values given by Eq. (30) if the coupling is weaker than our standard value ; this may occur with a coupling proportional to an optical depth, so that the balance condition yields at low an upturn toward . The upturn is yet enhanced to with a larger scatter, when cooling faster than the dynamical time (more likely to occur in small dense haloes) offsets the feedback, and emulates the condition illustrated by the Fig. 1b in its left corner, see also CV02. The low data of Onken et al. (2004), and Barth, Greene & Ho (2005) apparently indicate these conditions to apply; we expect this may occur for km/s, an issue that we will develop elsewhere.
The other imprint left by stochastic but dwindling activity in high density environments is to be found in the Eddington ratios that we find to be widely scattered, yet declining on average to local values for the most massive BHs, see Fig. 7. The decline is due primarily to the average decrease of the luminosities under the generally weakening interactions that tap diminishing gas reservoirs. Intrinsic scatter is caused primarily in and in a milder integrated form in , by the stochastic distribution of orbital parameters in the interactions, and by the the dependence on of their effects. Under the control by the feedback the overall scatter is actually constrained to under a factor with some mixing caused by the host dispersion , as shown by the lines in Fig. 7. The result is consistent with the observations by McLure & Dunlop (2003) and by Vestergaard (2004), considering conceivable sources of additional scatter, such as: the initial conditions for will itself contain some dispersion; additional scatter in the data clearly comes at low from observational selection picking up lower value of ; at high the current estimates of grow more uncertain based on scaling relations extrapolated from nearby AGNs (see Kaspi 2000, Vestergaard 2004).
Beyond detailed modeling, we stress that the observed combination of scattered but declining ratios with the tight and steady upper correlation indicates supply-limited activation of BHs in stochastic but generally dwindling accretion episodes. This is because the later and weaker repetitions controlled by the feedback increase and its scatter only moderately, see Fig. 2b; meanwhile they decrease the average and enlarge its variance considerably, to yield widening scatter to superposed to an overall declining trend, see Fig. 7. The two figures together illustrate how these two trends are made consistent by the feedback constraint, and lead us to favour the FCA model for km s-1 .
In sum, a sequence of fueling modes enliven the uniform underlying BH paradigm. Out of the several, attendant astrophysical processes our work has focused and linked three major components: the dynamical events, that recur with decreasing average strength and trigger stochastic but generally dwindling accretion episodes; the ensuing depletion of the galactic gas reservoirs, that in dense environments run out of the supply for accretion and for star formation; the constraint imposed to actual accretion by the energy feedback from the very source emissions. Our predicted outcomes include: flat LFs at higher , flattening yet at fainter luminosities; a steep and sharp correlation for the truly supermassive BHs; an upper cutoff to their local MD; decline and scatter of the Eddington ratios, widening to low . All features in telling agreement with the developing observations.
To these accretion modes that prevail in dense environments and power a first QSO Population, we have added (taking advantage of the linearity of our basic Eqs. 18 and 25, see §7) in Figs. 6 and 7 also the independent modes persisting or standing out for hosts in the field. There we have found a second, later AGN population to arise and evolve slowly simply because the density-dependent interaction times given in Eq. (8) are considerably longer, around 10 rather than 1 Gyr. Relatedly, high values of still occur at in some of the faint sources and in some 70% of the bright ones; they arise when hosts in the field – still gas-rich just because their encounters and interactions are late and rare – get involved in strong dynamical events that kindle up relatively small BHs starting from under the constrained relation (for related evidence, see Tanaka 2004).
We conclude with two straight implications of our picture. First, in massive spheroids built up in dense environment, the same rapid exhaustion of the gas reservoirs that causes strong evolution in the early QSO/AGN population is also bound to cause early reddening of the star populations. Later and slower field accretion modes, instead, involve blue galaxies still rich of gas and actively forming stars. All that will be observed (cf. Kauffmann et al. 2003, Hasinger 2004) as a bimodal QSO-AGN population, correlated to the bimodal colours of the galaxy population (Dekel & Birnboim 2004). Second, early small spheroids form small BHs with the reduced efficiency discussed in §3 causing the flattened and low LF shown in Fig. ; this means a small fraction of BHs conspicuous at early . At low , instead, many blue galaxies will harbor smaller spheroids and smaller BHs, either limited by the feedback constraint or not yet matured; their fueling and illumination by field triggering modes - although basically driven by the hierarchical formation of the underlying structures – will be perceived as an anti-hierarchical development of the activity.
Acknowledgments
We have benefited from fruitful discussions with A. Franceschini, P. Rafanelli, F. Vagnetti, and especially with A. Lapi and N. Menci. We thank our referee for stimulating comments and suggestions, and for pointing out the agreement of our predicted LF with observations in press. Work partially supported by INAF and MIUR.
References
- (1) Baes M., Buyle P., Hau G.K.T., Dejonghe H., 2003, MNRAS, 321, L44
- (2) Bahcall J.N., Kirhakos S., Saxe D.H., Schneider D.P., 1997, ApJ, 479, 642
- (3) Ballo L., Braito V., Della Ceca R., Maraschi L., Tavecchio F., Dadina M., 2004, ApJ, 600, 634
- (4) Barth A.J., Greene J.E., Ho L.C., 2005, ApJ, 619, L151
- (5) Beckman J.E., 2001, ASP Conf. Series 249, 11
- (6) Bennett C.L. et al., 2003, ApJ Suppl., 148, 1
- (7) Best P.N. et al. 2005, submitted to MNRAS, preprint astro-ph/0506269
- (8) Binney J., Tremaine S., 1987, Galactic Dynamics (Princeton: Princeton Univ. Press)
- (9) Boyle B. J., Shanks T., Croom S. M., Smith R. J., Miller L., Loaring N., Heymans C., 2000, MNRAS, 317, 1014
- (10) Cattaneo A., 2001, MNRAS, 324, 128
- (11) Cavaliere A., Colafrancesco S., Scaramella R., 1991, ApJ, 380, 15
- (12) Cavaliere A., Giallongo E., Messina A., Vagnetti F., 1983, ApJ, 269, 57
- (13) Cavaliere A., Padovani P., 1988, ApJ, 340, L5
- (14) Cavaliere A., Vittorini V., 2000, ApJ, 543, 599 (CV00)
- (15) ————————————, 2002, ApJ, 570, 114 (CV02)
- (16) Colpi M., Mayer L., Governato F., 1999, ApJ, 525, 720
- (17) Combes F., 2003, in Active Galactic Nuclei: from Central Engine to Host Galaxy, ed. S. Collin, F. Combes, I. Shlosman, ASP Conf. Series 290, 411
- (18) Corbett E.A. et al., 2003, MNRAS, 343, 705
- (19) Cristiani S. et al., 2004a, ApJ, 600, L119
- (20) Cristiani S. et al., 2004b, in ‘Multiwavelength Mapping of Galaxy Evolution’ eds. A. Renzini and R. Bender, in press (preprint astro-ph/0403494)
- (21) Croom S. M., Smith R. J., Boyle B. J., Shanks T., Miller L., Outram P. J., Loaring N. S., 2004, MNRAS, 349, 1397
- (22) Dekel A. & Birnboim Y., 2004, astro-ph/0412300
- (23) Di Matteo T., Quataert E., Allen S.W., Narayan R., Fabian A.C., 2000, MNRAS, 311, 507
- (24) Fabian A.C., 2004, in Coevolution of Black Holes and Galaxies, ed. L. C. Ho (Cambridge: Cambridge Univ. Press)
- (25) Fan X. et al., 2001, AJ, 122, 2833
- (26) Fan X. et al., 2003, AJ, 125, 1649
- (27) Ferrarese L., 2002, ApJ, 578, 90
- (28) Ferrarese L., Merritt D., 2000, ApJ, 539, L9
- (29) Fiore F., 2003, A&A, 409, 79
- (30) Franceschini A., Braito V., Fadda D., 2002, MNRAS, 335, L51
- (31) Gebhardt K. et al., 2000, ApJ, 539, L13
- (32) Granato G.L., De Zotti G., Silva L., Bressan A., Danese L., 2004, ApJ, 600, 580
- (33) Grazian A., Cristiani S., D’Odorico V., Omizzolo A., Pizzella A. 2000, AJ, 119, 2540
- (34) Groote D., Heber U., Jordan S. 1989, A& A, 223, L1
- (35) Guainazzi M., Piconcelli E., Jimenez-Bailon E., Matt G., 2005 , A& A, 429, L9
- (36) Guiderdoni B., Hivon E., Bouchet F.R. & Maffei B. 1998, MNRAS, 295, 877
- (37) Haehnelt M.G., Kauffmann G., 2000, MNRAS, 318, L35
- (38) Haehnelt M.G., Natarajan P., Rees, M.J., 1998, MNRAS, 300, 817
- (39) Haehnelt M.G., Rees M.J., 1993, MNRAS, 263, 168
- (40) Hagen H.J. et al., 1992, A& A 253, L5
- (41) Hasinger G., 2003, astro-ph/0302574
- (42) Hasinger G., 2004, astro-ph/0412576
- (43) Hosokawa T. 2004, ApJ, 606, 139
- (44) Kauffmann G., Haehnelt M.G., 2000, MNRAS, 311, 576
- (45) Kauffmann G. et al. 2003, MNRAS, 346, 1055
- (46) Kaspi S. et al., 2000, ApJ, 533, 631
- (47) Kembhavi A.K., Narlikar J.V., 1999, Quasar and Active Galactic Nuclei (Cambridge: Cambridge Univ. Press)
- (48) Kennefick J.D., Djorgovski S.G., De Carvhalo R.R., 1995, AJ, 110, 2553
- (49) King A., 2003, ApJ, 596, L27
- (50) Komossa S., Burwitz V., Hasinger G., Predhel P., Kaastra J.S., Ikebe Y., 2003, ApJ, 582, L15
- (51) La Franca F., 2001, ASP Conference Series, 232, 96
- (52) Lapi A., Cavaliere A., Menci N. 2005, ApJ 619, 60
- (53) Law D.R., Johnston K.V., Majewski S.R. 2005, ApJ, 619, 807
- (54) Maraschi L., Tavecchio F., 2003, ApJ, 593, 667
- (55) Marconi A., Risaliti G., Gilli R., Hunt L.K., Maiolino R., Salvati M., 2004, MNRAS, 351, 169
- (56) Martin N.F. et al., 2004, MNRAS, 348, 12
- (57) McLure R.J., Dunlop J.S., 2003, MNRAS, 351, 347
- (58) Menci N., Cavaliere A., Fontana A., Giallongo E., Poli F., Vittorini V., 2003, ApJ, 587, L63
- (59) Menou K., Haiman Z. 2004, ApJ, 615, 130
- (60) Merloni A., 2004, MNRAS, 353, 1035
- (61) Mihos J.C., 1999, Ap& SS, 266, 195
- (62) Miyaji T., Hasinger G., Schmidt M., 2000, A&A, 353, 25
- (63) Navarro J.F., Frenk C.S., White S.D.M., 1997, ApJ, 490, 493
- (64) Onken C.A. et al., ApJ, 2004, 615, 645
- (65) Osmer P. S. 2004, in Coevolution of Black Holes and Galaxies, edited by L. C. Ho (Cambridge: Cambridge Univ. Press)
- (66) Peebles P.J.E., 1993, Principles of Physical Cosmology (Princeton: Princeton Univ. Press)
- (67) Pizzella A., Dalla Bontá E., Corsini E.M., Coccato L., Sarzi M., Bertola F., 2004, astro-ph/0404284
- (68) Press W.H., Schechter P.L., 1974, ApJ, 187, 425
- (69) Ramella M. et al. 1999, A&A, 342, 1
- (70) Rees M.J., 1984, ARAA, 22, 471
- (71) Richards, G.T. et al. , 2005, preprint astro-ph/0504300
- (72) Rifatto A., Rafanelli P., Ciroi S., Radovich M., Vennik J., Richter G., Birkle K., 2001, AJ, 122, 2301
- (73) Schmidt M., 1989, Highlights Astron., 8, 31
- (74) Schmidt M., Schneider D.P., Gunn J.E., 1995, AJ, 110, 68
- (75) Sellwood J.A. & Moore E.M. 1999, ApJ, 510, 125
- (76) Shankar F., 2001, A Model for the Evolution of Supermassive Black Holes, Thesis Univ. Tor Vergata
- (77) Shankar F., Salucci P., Granato G.L., De Zotti G., Danese L., 2004, MNRAS, 354, 1020
- (78) Sheth, R. K., Tormen, G. 1999, MNRAS, 308, 119S
- (79) Shields G., et al., 2003, ApJ, 583, 124
- (80) Silk J., Rees M.J., 1998, A&A, 331, L1
- (81) Small T.A., Blandford R.D., 1992, MNRAS, 259, 725
- (82) Soltan A., 1982, MNRAS 200, 115;
- (83) Steed A., Weinberg D.H., 2003, astro-ph/0311312
- (84) Tadhunter C., Robinson T.G., Gonz lez Delgado R.M., Wills K., Morganti R., 2005, MNRAS, 356, 480
- (85) Tanaka Y., 2004, Prog. Theor. Phys. Suppl., 155, 231
- (86) Tremaine S. et al., 2002, ApJ, 574, 740
- (87) Ueda Y., Akiyama M., Otha K., Miyaji T., 2003, ApJ, 598, 886
- (88) Vestergaard M., 2004, ApJ, 601, 676
- (89) Volonteri M., Haardt F., Madau P., 2003, ApJ, 582, 559
- (90) Wyithe S., Loeb A., 2003, ApJ, 595, 614
- (91) Yu Q., Tremaine S., 2002, MNRAS, 335, 965
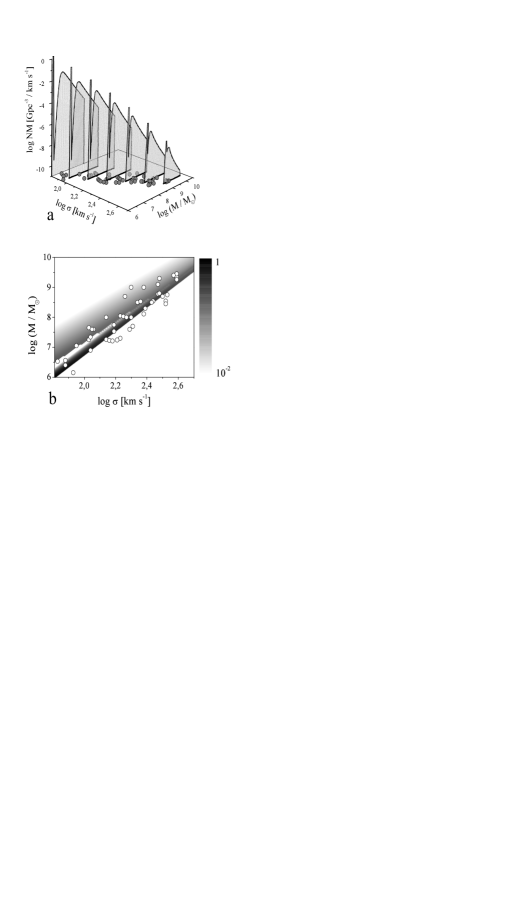
1b. The local relation, as obtained on projecting the distribution in Fig. 1a onto the plane, see §5 of text. The levels shown by grayscale tones are normalized to their maximal value. Data points from Ferrarese & Merritt (2000) and from Gebhardt et al. (2000).