Chandra observation of the multiple merger cluster Abell 521
We present the Chandra analysis of the rich galaxy cluster Abell 521 (=0.247). The high resolution of the Chandra observation has allowed us to refine the original merging scenario proposed for A521, and to reveal new features in its X-ray emission. A521 has strongly substructured ICM density and temperature maps. Its X-ray diffuse emission is elongated along a NW/SE direction (SX2) and shows two major components, a main cluster and a northern group of galaxies. This latter is in turn substructured, showing a clump of cold and very dense gas centred on the Brightest Cluster Galaxy (BCG), and a northern tail aligned in the SX2 direction. A compression of the X-ray isophotes is also observed South of the BCG. We conclude that the northern group is infalling onto the main cluster along the NW/SE direction. This hypothesis is corroborated by the presence of a hot bar in the ICM temperature map located between the southern and northern regions, as the gas could be compressionally heated due to the subclusters’ collision. The hot region corresponds to the eastern part of an over-dense ridge of galaxies, along which it was originally suggested that a merging of subclusters has recently occurred along the line of sight. An alternative hypothesis about the origin of the hot central bar is that we could observe in projection the shock fronts due to this older cluster-cluster collision. However, the two hypothesis do not exclude each other. Two other structures possibly interacting with the main cluster are detected on the West and North-East sides of the BCG. We also uncover the presence of two northern edges in the ICM density, which could be due to the ongoing merging events observed in the central field of the cluster, or even in its outer regions. A521 is a spectacular example of a multiple merger cluster made up by several substructures converging at different epochs towards the centre of the system. The very pertubed dynamical state of this cluster is also confirmed by our discovery of a radio relic in its South-East region.
Key Words.:
galaxies: clusters: general - galaxies: clusters: individual: Abell 521 - X-rays: galaxies: clusters1 Introduction
In the concordant cosmological model (CDM, =0.3 and =0.7), small structures are the first to form, and then they merge giving rise to more and more massive systems in a hierarchical way. Both numerical and observational results show that galaxy clusters form and evolve through the merging of sub-clusters and groups of galaxies along filamentary structures (e.g. West et al. 1995; Bertschinger 1998; Durrett et al. 1998; Arnaud et al. 2000; Bardelli et al. 2000; Borgani et al. 2004; Adami et al. 2005).
Combined optical and X-ray studies have been particularly successful in revealing the dynamics of merging clusters (Flores et al. 2000; Henriksen et al. 2000; Donnelly et al. 2001; Bardelli et al. 2002; Barrena et al. 2002; Czoske et al. 2002; Rose et al. 2002; Valtchanov et al. 2002; Boschin et al. 2004; Belsole et al. 2005; Demarco et al. 2005; Durret et al. 2005; Ferrari et al. 2005). This field is more and more active since precise spectro-imaging data in X-rays are now available with Chandra and XMM, allowing to derive high resolution temperature and density maps, in which very typical signatures of merging events have been detected such as strong temperature and density variations (Markevitch & Vikhlinin 2001; Belsole et al. 2004, 2005; Henry et al. 2004; Durrett et al. 2005), bow shocks (Markevitch et al. 2002; Markevitch et al. 2005) and cold fronts (Markevitch et al. 2000; Vikhlinin et al. 2001; Mazzotta et al. 2001; Sun et al. 2002; Dupke et al. 2003). Detailed multi-wavelength studies of galaxy clusters are essential to determine the scenario of their formation, and to analyse the complex physical processes acting during their evolution.
Abell 521 (z=0.247) is a relatively rich (R=1) cluster of Bautz-Morgan Type III (Abell 1958; Abell et al. 1989). After its first detection in X-ray with HEAO1 (Johnson et al. 1983; Kowalski et al. 1984), the dynamical state of A521 has been investigated in detail through a combined X-ray and optical analysis (Arnaud et al. 2000; Maurogordato et al. 2000; Ferrari et al. 2003). A severe segregation between the gas and galaxy distributions was detected. ROSAT/HRI observations revealed the presence of two peaks of X-ray emission, associated with a diffuse main cluster and with a compact less massive group (Arnaud et al. 2000). Unlike what is usually observed in relaxed systems, the Brightest Cluster Galaxy (BCG) is not located at the barycentre of A521, but in the compact sub-group, with a surprising off-set from its X-ray peak. The galaxy isodensity map in the central 20’20’ field of A521 has a very irregular and strongly sub-clustered morphology. Its general structure follows a NW/SE direction, crossed by a perpendicular high density ridge of galaxies in the core region (Arnaud et al. 2000; Ferrari et al. 2003). The analysis of the dynamical and kinematic properties of more than one hundred cluster members confirmed that A521 is far from dynamical equilibrium: its radial velocity distribution significantly different from a Gaussian and characterised by a very high dispersion ( km/s) is typical of merging systems (Ferrari et al. 2003). A detailed dynamical analysis revealed at least two different and not contemporary episodes of merging: a) a dynamically bound complex of galaxies, hosting the BCG and corresponding to the compact group detected in X-ray, is currently infalling on the plane of the sky toward the centre of the main cluster, and b) two or more sub-clusters have recently collided along the over-dense central ridge, with a collision axis nearly along the line of sight (Ferrari et al. 2003).
The recent analysis by Umeda et al. (2004) of A521 luminosity function showed that this cluster contains more currently star-forming galaxies than local clusters, consistently with the observed Butcher-Oemler effect. The excess of star formation (SF) can be at least partly related to the particular dynamical state of A521, since an increase of SF has been observed in several merging systems (e.g. Gavazzi et al. 2003; Poggianti et al. 2004; Ferrari et al. 2005).
The complex dynamical state of A521 and its unique morphological features motivated our Chandra observations with the aim of better characterising the physics of this exceptional cluster. In this paper the Chandra data are analysed. Sect. 2 briefly describes the observations and the data reduction. In Sect. 3 we study the X-ray morphology and the temperature structure of A521. Results are discussed in Sect. 4 and summarised in Sect. 5. As in Ferrari et al. (2003), all numbers are expressed as a function of , the Hubble constant in units of 75 km . We have used the CDM model with and , thus 1 arcmin corresponds to 0.217 Mpc in the following.
2 Observations and data reduction
A521 was observed with Chandra ACIS-I and ACIS-S in ”VFAINT” mode. The datasets were processed and cleaned using CIAO 3.2 software and calibration files in CALDB 3.0.0. The first exposure was done on Dec 23, 1999 with ACIS-I and focal plane temperature of for an effective exposure time of 38.0 ksec after standard cleaning (88% of the nominal exposure time). On Oct 13, 2000, a second exposure of 41 ksec was done with ACIS-S and focal plane temperature of . After cleaning the light curve from the several flares present by requiring a mean count rate of 0.085 cts/s, an exposure of 18.4 ksec is obtained.
3 Results
3.1 X-ray morphology
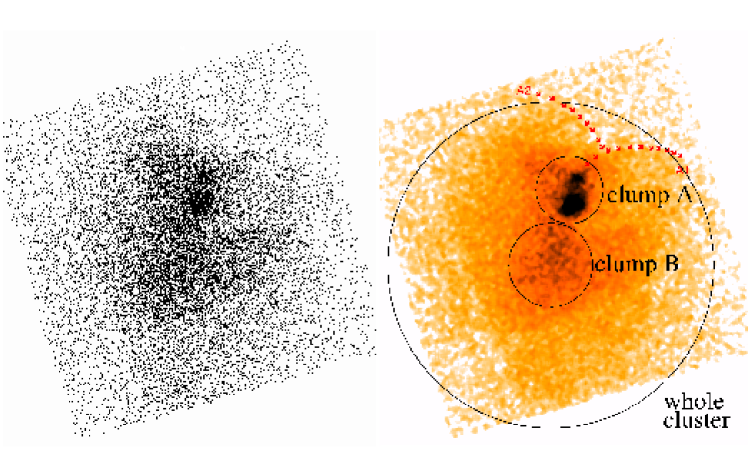
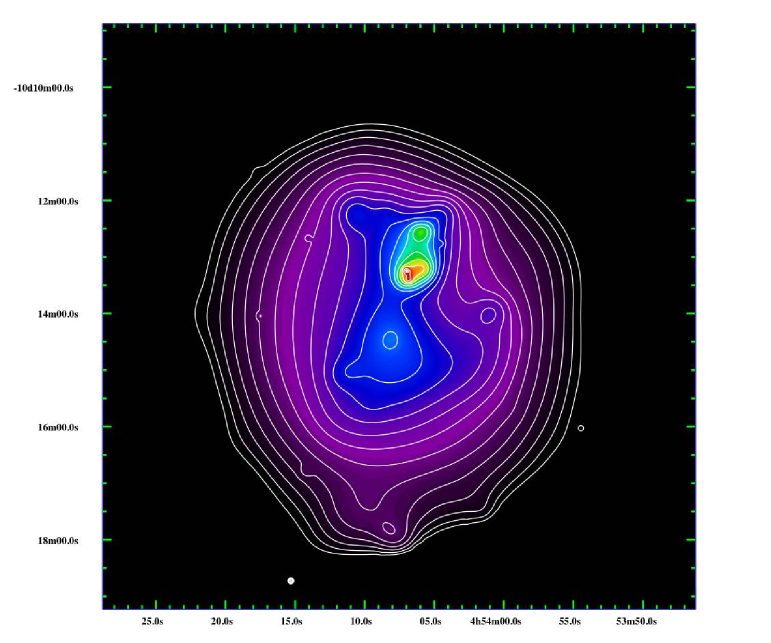
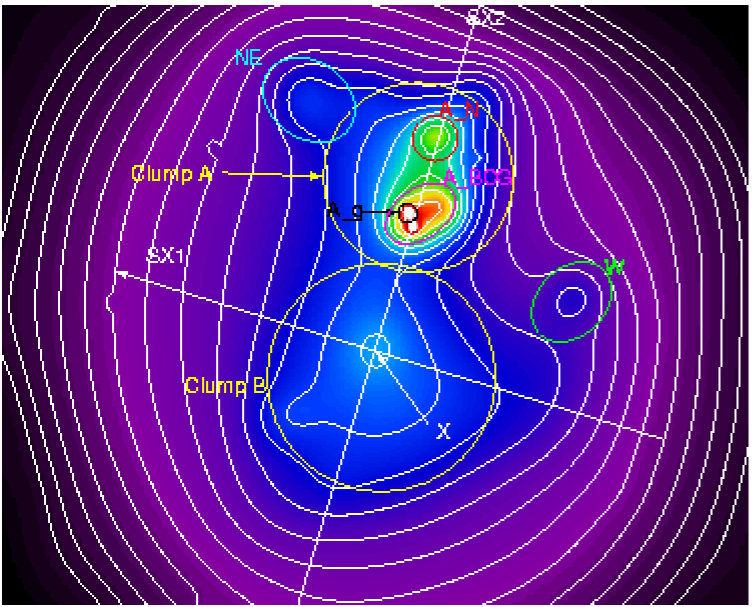
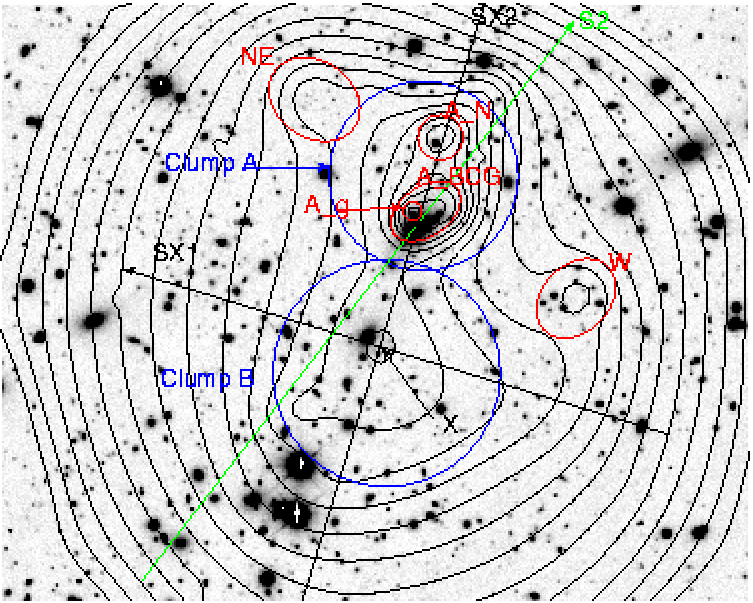
The raw image of A521 diffuse emission is presented in Fig. 1. The cluster shows two highest density regions that we will call clumps A and B in the following. They correspond respectively to the Northern group and the central part of the main cluster identified in the ROSAT image (Arnaud et al. 2000). The new Chandra observations uncover the presence of several features inside and around each of the two clumps, as it appears more clearly in Fig. 2, which represents a smoothed image of the cluster central field () in the 0.5-5 keV energy band. In order to get a smoothed image of the diffuse emission of the cluster, the programme “mrp_filter” of the package “MR/1 Multiresolution Analysis” (Stark, Murtagh & Bijaoui 1998) has been applied. The programme does a wavelet filtering for images with Poisson noise. We used a significance level of 1.E-04, corresponding to a 3.7 Gaussian detection level. The image has been thresholded and reconstructed such that both point sources and the background are excluded, and it has been exposure corrected. In Fig. 3 the X-ray contours are overlaid on the X-ray (top) and I-band (bottom) images of the cluster.
The Chandra observations reveal a structure of A521 diffuse emission that is even more complicated and irregular than the morphology obtained through the ROSAT observations (Arnaud et al. 2000), confirming that this cluster is out of hydrostatic equilibrium. The general X-ray structure of A521 is elongated along the axis joining the two main X-ray peaks (SX2 in Fig. 3). The green line in the bottom panel of Fig. 3 shows the direction followed by the general structure of the cluster at optical wavelengths (S2 in Ferrari et al. 2003). A deeper optical analysis of the alignment effects in A521 revealed that the NW/SE direction indicated in green is the preferred one for the formation of the cluster, since it is the main elongation axis of a) the brightest cluster galaxies, b) the main sub-structures detected in the red-sequence iso-density map, and c) the general cluster structure out to 5 Mpc (Plionis et al. 2003). A slight misalignment is present between the main axis of the X-ray and optical emission (SX2 and S2).
The X-ray peak of the main cluster (labelled X in Fig. 3) is close to the second brightest cluster galaxy and its position corresponds to the barycentre of the optical emission of A521. South of SX1, the axis perpendicular to SX2 (see Fig. 3), the cluster appears rather relaxed with quite regular isophotes (Figs. 2 and 3).
The Northern part (North of SX1) is much more complex, as it shows evidence of several sub-structures and elongations in the ICM distribution. The most prominent structure is the clump A (see Figs. 1 and 3). It is brighter than the equivalent region centred on the main cluster and roughly elliptical in shape, with a main axis along the SX2 direction. Two internal sub-structures are detected, a northern clump and a southern one, labelled respectively A_N and A_BCG in Fig. 3. The brightest peak of clump A, located inside the A_BCG substructure, is clearly centred on the BCG position. The substructure A_BCG shows an elongation more toward North-West with respect to the SX2 direction, being in fact more aligned with the main axis of the optical distribution and of the BCG (S2 in Ferrari et al. 2003, green line in Fig. 3). A compression of the X-ray isophotes is also observed in the South of the BCG along the S2 direction. The clump A_BCG shows a secondary X-ray peak centred on one of the blobs of the optical arc-like structure surrounding the BCG (A_g in Fig. 3). The observations of Ferrari et al. (2003) have shown that all of these blobs are at the same redshift of the cluster, and that they could be galaxies falling onto the brightest cluster object. A_g is likely to be a point like emission of one of these galaxies. The A_N structure is centred on a bright object (a star, based on the spectral analysis by Ferrari et al. 2003), but its X-ray emission is extended. The northern part of the whole substructure A (A_N and surrounding regions) could therefore be a tail of gas of the clump A_BCG.
Two other less prominent substructures are present in the North. First, a North-East clump which appears as an excess of emission east of clump A (NE ellipse in Fig. 3). Second, we observe an elongation of the X-ray isocontours on the West side of the main cluster X-ray peak towards a sub-structure (labelled W in Fig. 3) at 2.5 arcmin from it in a North-West direction. Fig. 3 shows that several galaxies are concentrated in the W region, i.e. 8 quite bright objects (=18.5-19) and several faint ones. Spectroscopic observations reveal that 3 of them are confirmed cluster members, but note that in this region the spectroscopic observations are complete at no more than 50-60% level (Ferrari et al. 2003).
The X-ray morphology of A521 is therefore regular South of the SX1 direction, strongly substructured in the northern part. This is even clearer in Fig. 4, which shows the residuals obtained after subtracting in each region the emission from the symmetric region with respect to the X-ray peak of the main cluster (labelled X in Fig.3). This way we subtract in the North the corresponding ’unperturbed’ part of the main cluster, as measured in the South. Clumps A, W and NE emerge clearly North of SX1 (with a possible tail of X-ray emission towards South-East for the substructure W).
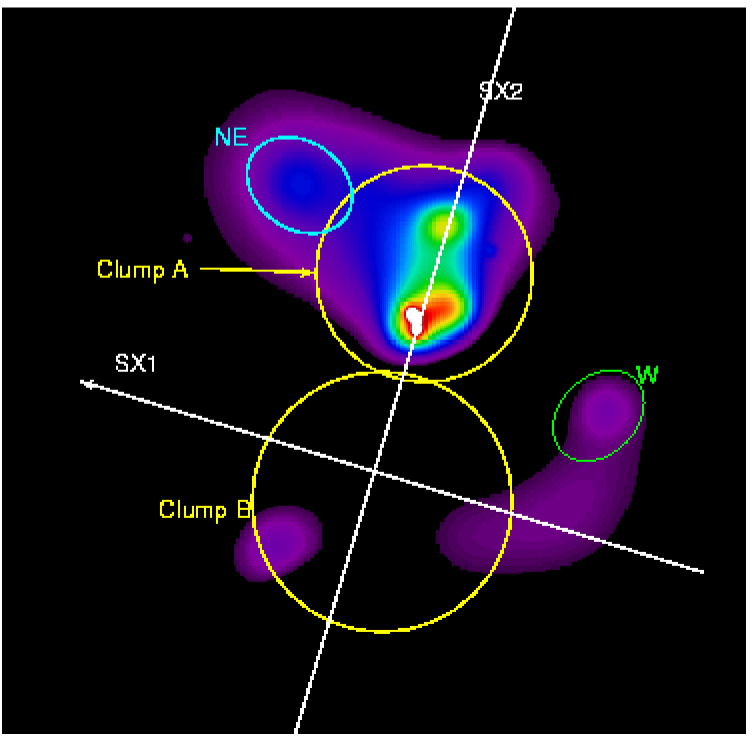
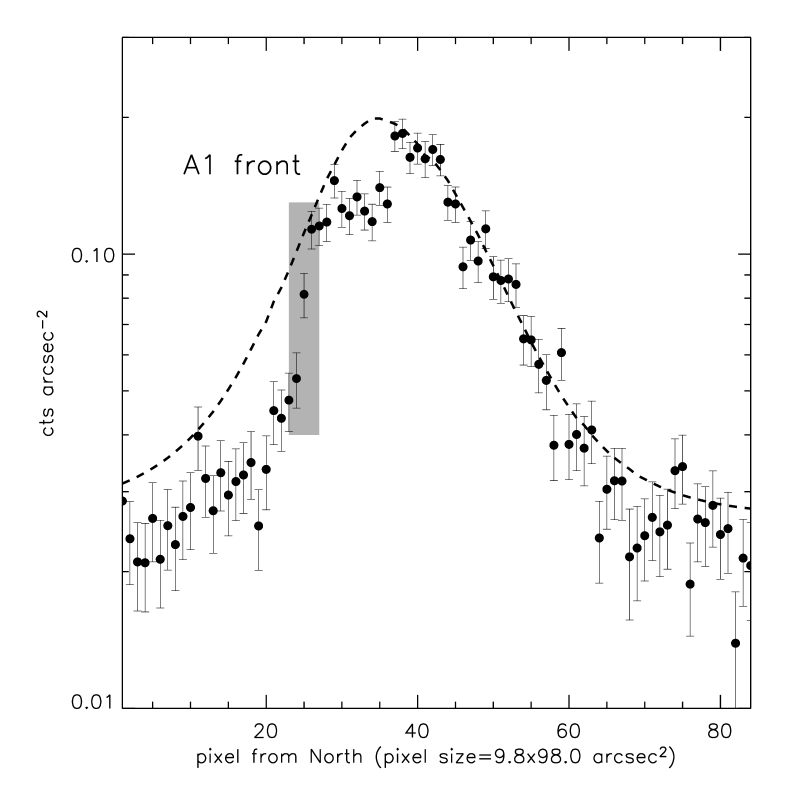
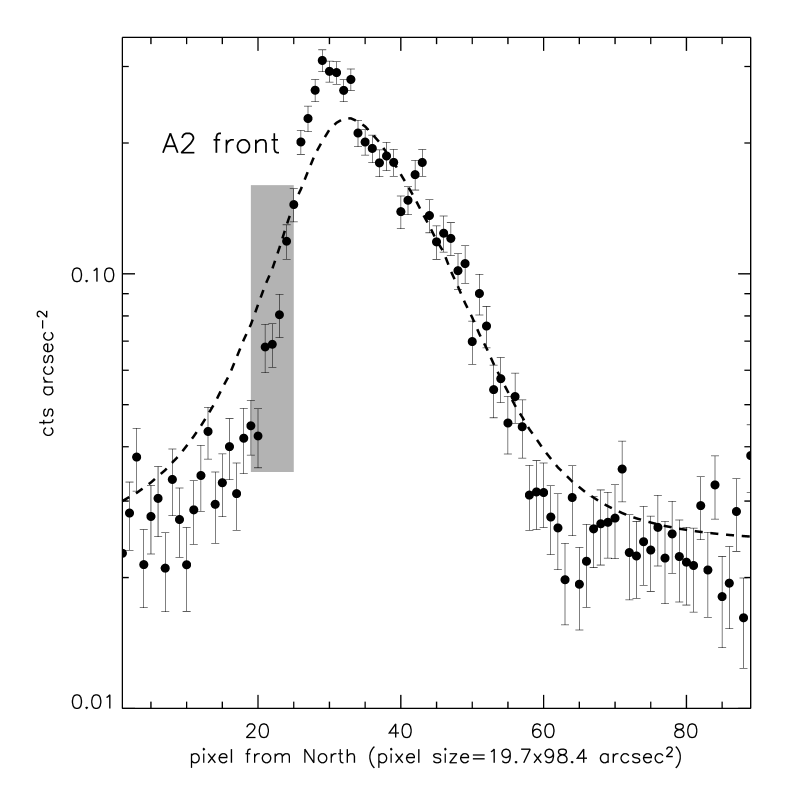
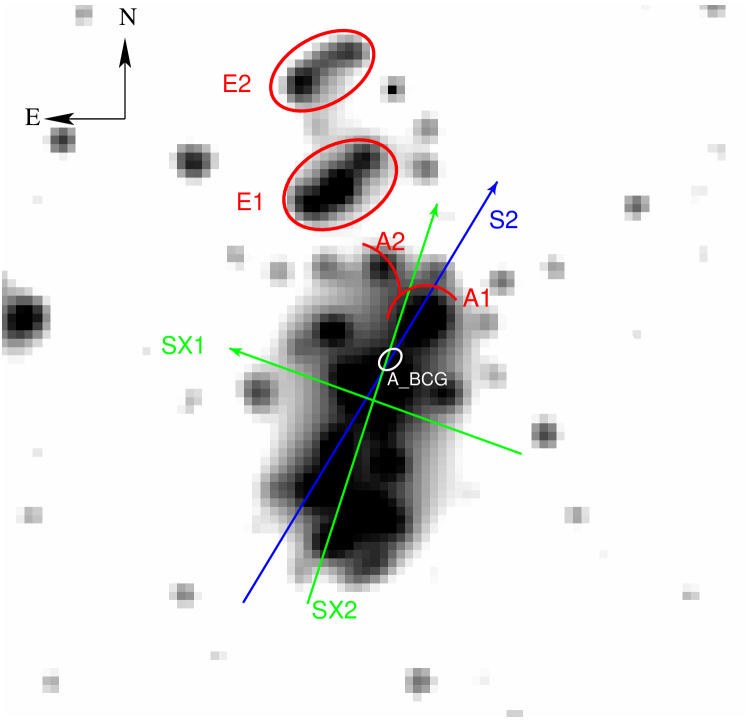
Finally, Chandra observations revealed two sharp edges in the X-ray surface brightness in the region to the North of the BCG (labelled A1 and A2 in Fig. 1), with changes by a factor of 2 over scales shorter than arcsec (see Fig. 5). To emphasise the departure from a smoothed spherically symmetric emission, we modelled the surface brightness of the region with two models, one obtained as best-fit results of the radial profile extracted from the Northern (P.A.=) semicircle centred on the BCG (RA, Dec)=(04:54:06.9, -10:13:20), the second one extracted from the Southern semicircle centred at (RA, Dec)=(04:54:07.9, -10:14:27). Then, we compute the surface brightness profile in two strips crossing the two edges both in the keV exposure-corrected image and in the faked two-dimensional emission obtained by the sum of the two models. The faked profile is indicated by dashed lines in Fig. 5. These edges are located orthogonal to the main X-ray axis SX2 and trace the Northern boundary of the clump A (see Fig. 1).
In summary, we distinguish the following main structures in the X-ray observation of A521:
-
•
clumps A and B: the two main clumps in the X-ray emission of A521. Clump B is the central part of the main cluster, which seems to be nearly unperturbed in the southern region. Clump A is a northern sub-cluster centred on the BCG;
-
•
SX1, SX2, S2: SX2 is the axis connecting the X-ray peaks of the main cluster and of the northern sub-cluster (with a position angle of 163∘111The position angle being defined from North to East.), SX1 its perpendicular direction, S2 the optical main elongation axis;
-
•
A_BCG, A_N and A_g: X-ray structures inside the Northern sub-cluster A. A_BCG is a centred on the BCG galaxy and A_g is associated with one of the optical knots surrounding the BCG;
-
•
W: substructure present at 2.5 arcmin North-West of the X- ray peak of the main cluster;
-
•
NE: substructure located North-East of clump A;
-
•
A1 and A2: two arc-like edges detected as in the X- ray brightness map at the North of the clump A.
The spherical symmetry and hydrostatic equilibrium assumptions are clearly not valid in the case of A521 due to its very disturbed morphology. No gas density and temperature profiles or total mass profiles will therefore be presented in the following.
3.2 Temperature analysis
3.2.1 Temperature map from hardness ratio
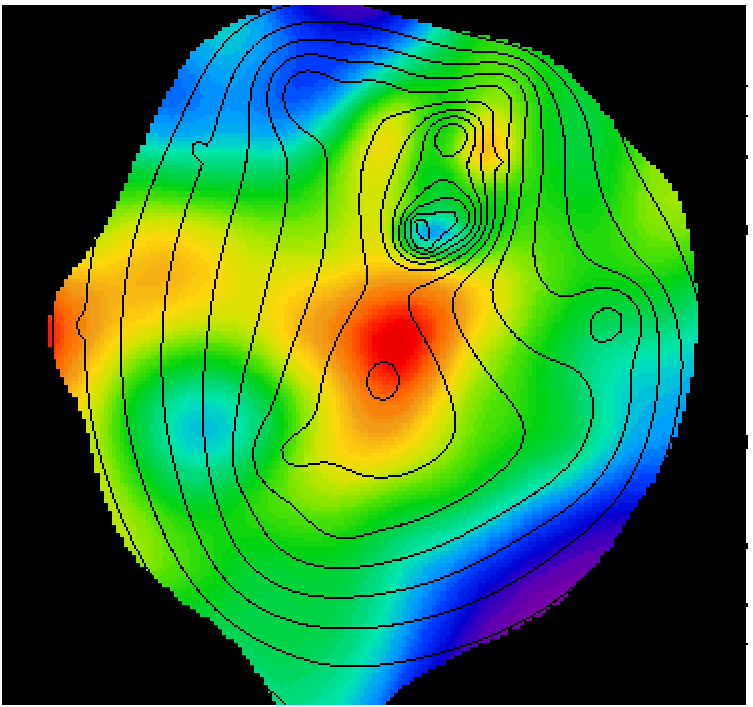
Fig. 6 shows a temperature map of A521 obtained using the hardness ratio technique. Images of the region covered by the ACIS-S3 field of view have been extracted in the energy bands 0.5-2 keV and 2-5 keV from the ACIS-S and ACIS-I event files. Point sources have been detected and removed using the CIAO tools wavdetect and dmfilth. Each image has been background subtracted using blank field data and corrected for vignetting effect and exposure variations. The resulting ACIS-S and ACIS-I count rate images in each energy band have then been added and adaptively smoothed using the CIAO tool csmooth. The smoothing scales were defined from the raw ACIS-(S+I) image in the keV energy band with a minimum significance of and a maximum significance of .
The 2-5 keV smoothed image has been divided by the corresponding 0.5-2 keV image to obtain a hardness ratio map, which has been converted to a temperature map. The theoretical conversion factors have been computed using an absorbed thermal model (tbabs (mekal) in XSPEC 11.3.1) with a column density fixed to the Galactic value of cm-2 , a redshift of 0.247 and an abundance fixed to 0.4, convolved with the instrument responses. Since the images have been corrected for vignetting effects, we used the on-axis Auxiliary Response and Redistribution Matrix files, obtained accordingly to the period and configuration of the observation. An inverse edge to account for the underestimate of the effective area around 2 keV is also applied (see Vikhlinin et al. 2005).
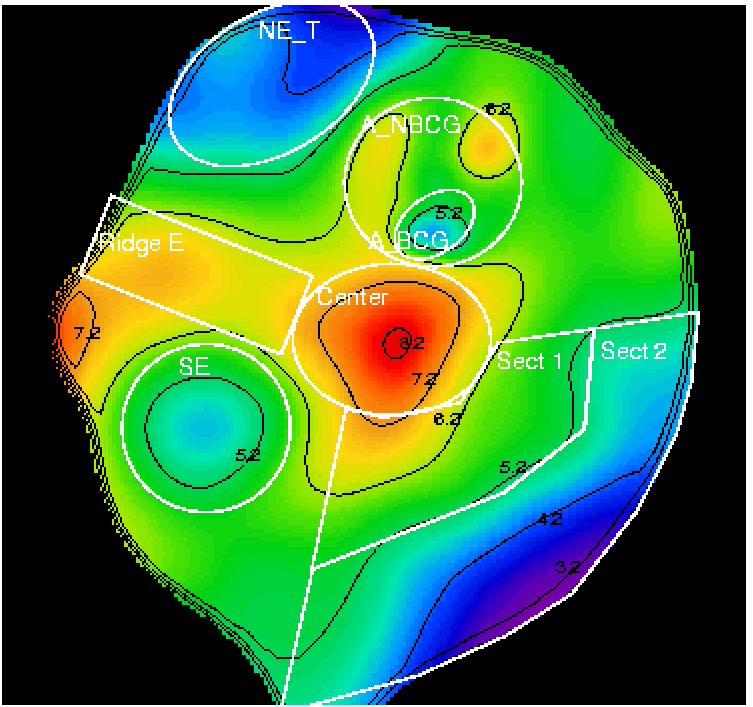
A521 is clearly characterised by a highly sub-structured temperature map, which presents:
-
-
a cold region (5 keV) in the North-East (labelled NE_T) around the NE substructure;
-
-
a cold substructure corresponding to the region of the BCG (A_BCG). It is surrounded by an annulus of warmer gas (A_NBCG), that shows higher temperatures in its northern and eastern parts;
-
-
a central hot region (6 to 8 keV) that, starting from East, runs roughly parallel to the SX1 direction (Ridge E) and reaches a maximum in a very hot central peak (Central);
-
-
a gradual decrease of temperature in the South-West sector (Sect 1 and Sect 2). The temperature gradient is less pronounced in the South-East sector, with a possible cold substructure South-East of the cluster barycentre (SE).
3.2.2 Spectral analysis
| Region | (0.5-2 keV) | (bol) | (0.5-2 keV) | (bol) | ||
|---|---|---|---|---|---|---|
| (keV) | () | ( erg/s/) | ( erg/s/) | ( erg/s) | ( erg/s) | |
| Whole cluster | ||||||
| Clump A | ||||||
| Clump B |
Spectra in different regions of interest were extracted, together with the corresponding Auxiliary Response and Redistribution Matrix files. As above, an absorbed thermal model is used to fit the accumulated spectra in bins with a minimum number of 20 counts, with a column density fixed to the Galactic value. An inverse edge to account for the underestimate of the effective area around 2 keV is also applied (see Vikhlinin et al. 2005).
The temperatures, abundances, fluxes and rest-frame luminosities of the whole cluster (big circle in Fig. 1222The CCD gaps have been masked in doing the spectral analysis of the whole cluster.) and of the two main clumps A and B (smaller circles in Fig. 1) are listed in Table 1. The quoted values have been derived using ACIS-I data, for which a local background can be estimated. They do not show significant variation when blank field background are used, validating the use of blank field data for the temperature map.
The spectroscopic temperatures () of the different regions identified in the temperature map (see previous section) have also been estimated. The ACIS-I and ACIS-S spectra were fitted simultaneously 333We checked that fully consistent results are obtained using the ACIS-I exposure only. These temperatures are compared in Table 2 with the temperatures obtained using the hardness ratio technique. The latter () have been estimated using both the mean value from the temperature map and the ratio of the count rates in the smoothed images used to derive the temperature map, these two methods giving results which always differ by less than keV.
The temperatures derived from the spectral analysis are in good agreement, within 1 error, with the value derived from the hardness-ratio technique (see Table 2), with no systematic differences. The largest discrepancy () is observed for the region around the BCG (A_BCG) which is even colder in the spectroscopic analysis. The spectral analysis clearly confirms: a) the low temperature of the clump centred on the BCG, which is surrounded by a hot region, b) the presence of a hot central bar elongated in a East/West direction with a maximum in the central region, and c) the cold temperature of the North-East part of the cluster.
| Region | ||
|---|---|---|
| (keV) | (keV) | |
| NE_T | 4.5 | |
| A_BCG | 5.1 | |
| A_NBCG | 6.0 | |
| Ridge E | 6.6 | |
| Center | 7.4 | |
| Sect 1 | 5.9 | |
| Sect 2 | 4.6 | |
| SE | 5.3 |
4 Discussion
In agreement with previous results by Arnaud et al. (2000), Maurogordato et al. (2000) and Ferrari et al. (2003), the analysis of Chandra observations confirms that A521 is far from dynamical equilibrium and that it is a particularly complex system, made up by several subclusters in different phases of the merging process. A first evidence that A521 is in a disturbed dynamical state is the slight misalignment between the main axis of X-ray and optical emissions (SX2 and S2 in Fig. 3). This could be due to on-going merging event(s), since we know that in clusters the collisional component (i.e. ICM) and the non-collisional one (i.e. galaxies and DM) have significantly different dynamical time scales (Röttiger et al. 1993).
4.1 BCG group and surrounding regions
While the Southern part of A521 has a quite regular morphology and shows a peak of X-ray emission very close to the second BCG, the Northern region has a much more structured X-ray morphology, rich in sub-clusters. The main feature that appears in its ICM density and temperature maps is a compact cold component (clump A_BCG, Fig. 3), centred on the BCG, which is the highest density region of the principal northern substructure (clump A). The very high angular resolution of Chandra has helped to solve one of the open questions of the previous X-ray analysis of A521 (Arnaud et al. 2000). In the ROSAT observations a compact group in the North of the cluster was also detected, hosting the BCG. Curiously, it was not centred on its brightest galaxy, but on a northern position. Chandra observations show two main X-ray peaks in the subcluster A corresponding to the ROSAT group, one centred on a stellar object (A_N) and one associated to the BCG (A_BCG), which were not resolved by the previous X-ray observations. The A_BCG substructure is perfectly centred on the BCG and it corresponds spatially to the gravitationally bound system of galaxies detected by Ferrari et al. (2003). The gas of this clump, significantly hotter than the diffuse ISM of early type galaxies (0.5-1.5 keV, Forman et al. 1985), is associated to the whole system of galaxies surrounding the BCG. Its temperature, colder than in the rest of the cluster, is in agreement with the lower radial velocity dispersion of this region ( in a circle of 240 kpc around the brightest galaxy, Ferrari et al. 2003). What we need to investigate is the origin of the high gas density in A_BCG, 1.5 times higher than in the centre of the main cluster444The density ratio has been measured as the square root of the surface brightness ratio. The 0.5-5 keV surface brightness maps (ACIS-I and ACIS-S) have been used, considering the A_BCG region and an equivalent region around the X-ray centre of the main cluster..
Similar to 28% of the first-rank galaxies in rich clusters (Hoessel 1980), the brightest galaxy of A521 is clearly a case of BCG with multiple nuclei (see Fig. 8 of Maurogordato et al. 2000). Since all of them are at the same redshift (Ferrari et al. 2003), they are very likely remnants of galaxies “cannibalised” by the most massive object, around which, however, the halo typical of cD galaxies has not been detected (Maurogordato et al. 2000). The formation of the halo in cD galaxies seems to result from the tidal disruption of a large fraction of dwarf galaxies during the early stages of cluster evolution (Merritt 1984; López-Cruz et al. 1997). Subsequently, violent relaxation redistribute the stars from the disrupted objects throughout the cluster’s potential, giving rise to the cD’s halo, while the gas originally confined in the cannibalised galaxies can contribute significantly to the ICM mass (López-Cruz et al. 1997). In A521 we are probably observing the initial phase of the formation of a cD at the centre of a low-mass subcluster, in which galaxy merging is efficient due to the low velocity dispersion of the system, while the extended halo has not yet had time to form. The very high ICM density of the A_BCG group could therefore be due to stripped material related to the cannibalism of the BCG. Galaxy cannibalism occurs very early in a cluster lifetime. If it would happen after cluster virialization, we should expect randomly oriented cD galaxies, while it has been shown that the shape of cD’s aligns with its nearest neighbour, the cluster shape and the filaments of large scale structure (West 1994). The scenario that the BCG of A521 is becoming a cD galaxy in a dynamically young group is therefore supported by the observed alignment of the BCG main axis with the cluster major axis and with the nearest cluster neighbour (Plionis et al. 2003). It is also in agreement with the idea that cD’s form via the merging of galaxies in the centre of poor groups, which then fall into richer clusters (Merritt 1984; Zabludoff & Mulchaey 1998 and references therein). Notice that a similar case of a cold and very dense clump of gas, detected around a BCG with multiple nuclei and aligned along the merging axis of the cluster, has been observed with Chandra in A3266 (Henriksen & Tittley 2002). In that case, the BCG is probably cannibalising galaxies from a merging subcluster.
In agreement with the previous optical analysis, we therefore conclude that the main northern clump A is a group of galaxies in interaction with the main cluster. The subcluster shows a higher density component centred on the BCG, a northern tail of gas, and compression of the X-ray isophotes South of the BCG. All these results are in agreement with the merging scenario suggested by our optical analysis of the cluster (i.e. the group A is infalling toward the main cluster along a North/South direction). By comparing the ICM temperature and density maps of A521 with the numerical simulations of Ricker & Sarazin (2001), we suggest that the group A and the main cluster are in a pre-merger phase (–0.5 Gyr from the closest cores encounter), with a quite low impact parameter () and a merger axis nearly perpendicular to the line of sight.
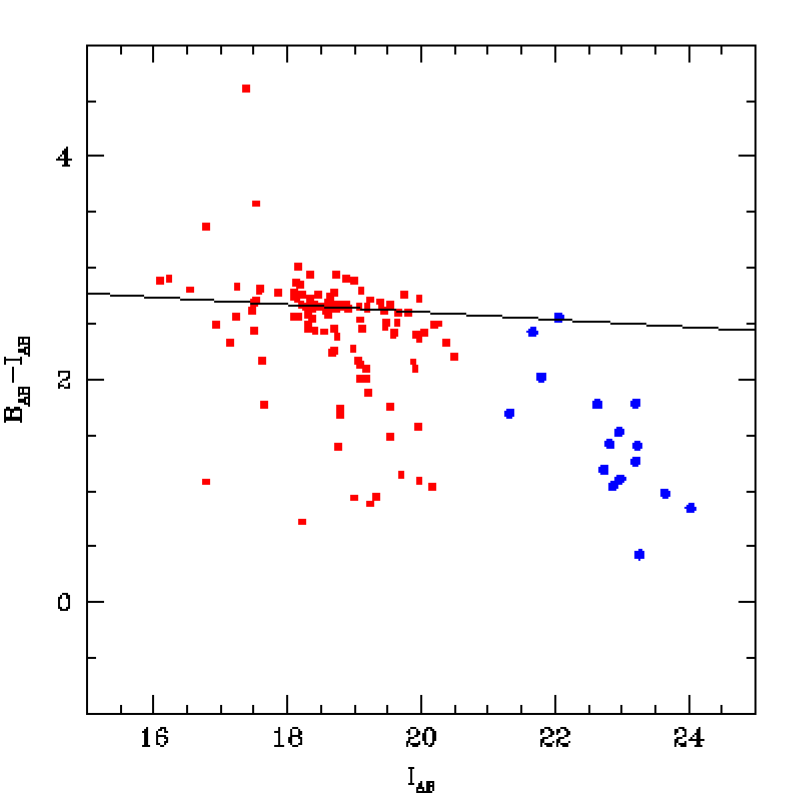
A higher ICM temperature has been observed in the region surrounding the clump A_N, and in particular in its North and North-East sides (see Fig. 6). This higher temperature could be related to the presence of another substructure observed in the ICM density map of A521, i.e. the North-East clump NE. This substructure could be a dynamically separated group of galaxies, since it shows a low gas temperature and it hosts some faint galaxies (Fig. 3). The clump might be: a) another infalling sub-structure at the redshift of A521, or b) a background gravitationally structure, by chance seen in projection nearby the central field of A521. In the first case, the low ICM temperature of this region suggests that the possible interaction would be in its very initial phase. Several galaxies are present in the NE clump, for which we have no redshift information due to their very faint magnitudes (23.5, 21.5). Their positions on the diagram (circles in Fig. 7) do not exclude that the NE clump could actually correspond to a group of galaxies at the distance of A521, since some objects (i.e. the brightest ones, ) lie on the cluster red-sequence. They could therefore be faint ellipticals at the cluster redshift, surrounded by bluer late-type galaxies. It is however not clear why all the galaxies of this group are fainter than the confirmed members of A521 if they are at the same redshift. The low temperature of the gas in the NE region could also be in agreement with the second hypothesis, i.e. the NE clump could be a background group of galaxies. This seems however less probable, since the faint galaxies located in the clump lie on or are even bluer than the cluster red-sequence (Fig. 7), while they should be redder if they were massive ellipticals at higher redshift. They could be a grouping of late-type background galaxies, but in such a case the system would not be massive enough to have such a strong X-ray emission, and therefore it would not be associated to the NE clump detected by Chandra. Due to the faint magnitudes of these galaxies and the consequent bigger errors in their colour and magnitude determination, it is however not possible to exclude that they are elliptical galaxies at a higher but not so different redshift than A521 (0.1). With the optical observations of A521 available at present it is therefore impossible to give a definitive conclusion on the nature of the clump NE.
4.2 Central hot region
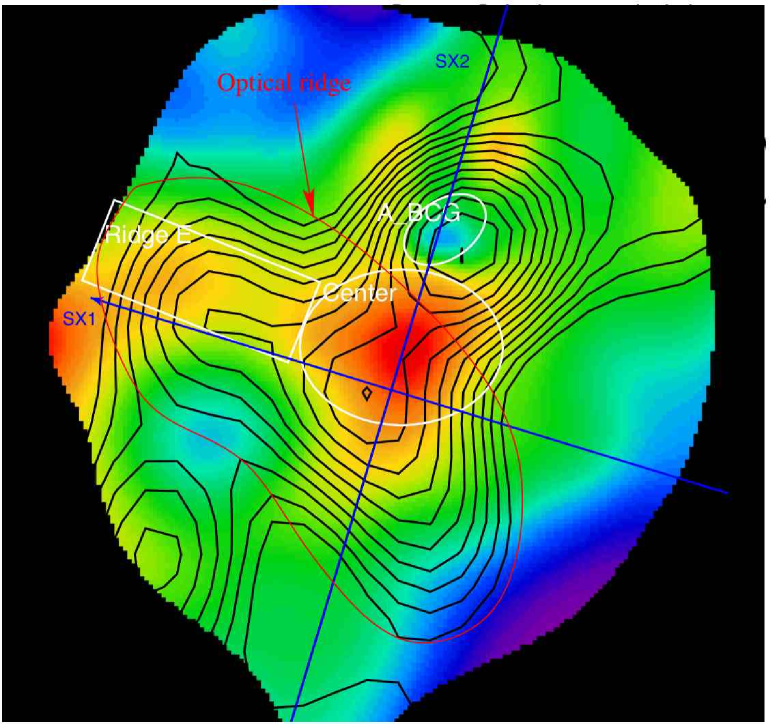
Between the main cluster and clump A we detect a very high temperature bar roughly parallel to SX1 and extending from East to the centre of the cluster, where the ICM temperature reaches its maximum value (Fig. 6). The hot bar corresponds to the eastern part of the over-dense ridge of galaxies detected by Arnaud et al. (2000) and Ferrari et al. (2003) on the galaxy iso-density maps (Fig. 8). In optical, the ridge bends towards South-West on the western side of the cluster centre, while the hot bar does not extend in this western region.
The dynamical properties of this part of the cluster were interpreted as the result of a recent merger in the ridge region with a significant component along the line of sight (Ferrari et al. 2003). The high temperature of the eastern side of the ridge, due to gas compression and heating, could therefore be associated either a) to the on-going infall of the subcluster A toward the centre of the main cluster, or b) to the merging event nearly along the line of sight detected in optical. The first hypothesis is in agreement with the results of numerical simulations, which, in the case of low impact parameters, show a high temperature bar nearly perpendicular to the collision axis during the pre-merger phases (Schindler & Müller 1993; Takizawa 1999; Ricker & Sarazin 2001). Considering hypothesis b), we can exclude that we are observing the central phases of a subclusters’ collision: due to the merging geometry of the substructures in the ridge reconstructed through the optical observations, we should not detect such a high temperature bar (collision axis nearly along the line of sight prevents to observe strong signatures of interactions in the X-ray temperature and density maps, e.g. Schindler & Müller 1993). The high temperature could be explained by the b) hypothesis in the case of a post-merger, since we could then be observing in projection the shock fronts moving outwards. Of course, the hot ridge in the centre of the cluster could be due to a combination of the two merging events, i.e. the pre-merger phase of the clump A and the post-collision nearly along the line of sight along the ridge.
4.3 Other features in the density and temperature maps
Other features have been detected in the northern part of the cluster (i.e. North of the SX1 direction). First of all, the western clump W. Optical observations reveal that it hosts some bright cluster members (bottom panel of Fig. 3); it could therefore be a dynamically bound group of galaxies at some stage of interaction with the main cluster. Since the ICM temperature is higher in the North than in the South of the group, and the map of the residuals (Fig. 4) shows a tail of gas elongated in the SE direction, we could be witnessing a merging event between the main cluster and the clump W, the latter coming from somewhere in the S-SE direction. An off-axis collision could have prevented the total assimilation of the less massive group W in the main component of A521.
Two edges A1 and A2 have been detected in the X-ray surface brightness of A521. They are located orthogonally to, and at opposite directions with respect to, the merging axis SX2 and trace the Northern boundary of the clump A. In the scenario in which the A_BCG group is falling from North onto the main cluster, the edges might be interpreted as residuals of the sloshing activity of the ICM during the merger that is taking place along the SX2 axis. However, due to the very complex optical and X-ray properties of A521, nothing can exclude that A1 and A2 could be alternatively related to other merging events in A521, either in its central field (e.g. the possible collisions of the clumps W or NE with the main cluster), or in its outer regions not covered by our Chandra observations.
In this respect, several other substructures appear at larger scales in the North of the iso-density map of the projected distribution of the red sequence galaxies (see Fig.9). New optical observations (EFOSC2@3.6m ESO) have recently revealed the presence of several galaxies at the cluster redshift in the two Northern clumps E1 and E2 (Fig.9), confirming that they are very likely other merging subclusters at 1.5-2 Mpc from the cluster centre. A radio relic in the South-East region of the cluster has also been discovered through new VLA observations of A521 (Ferrari 2003, see Appendix A for more details).
5 Summary and conclusions
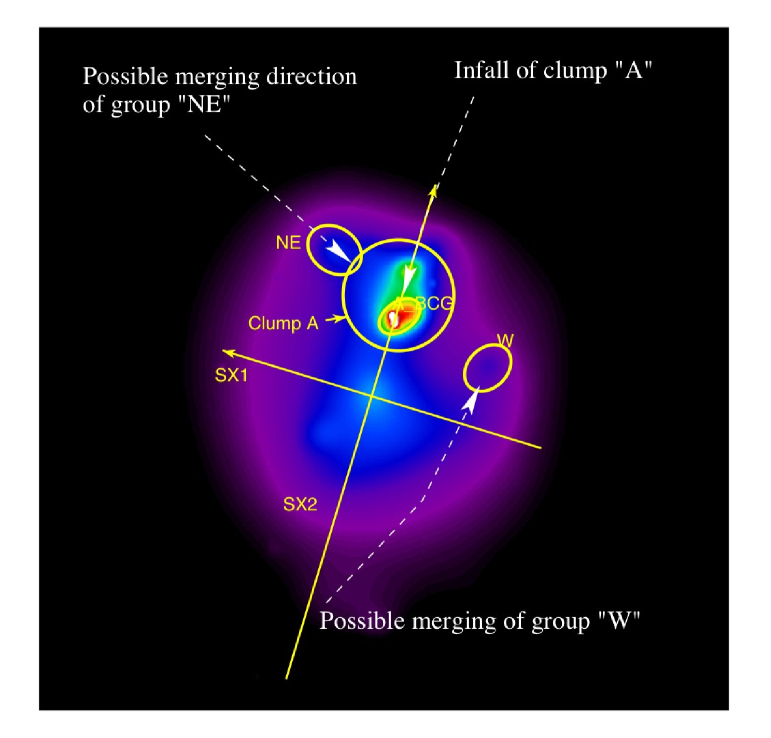
Through our Chandra observations of A521 we have confirmed that this cluster is in a disturbed dynamical state, as shown by previous X-ray and optical analysis (Arnaud et al. 2000; Maurogordato et al. 2000; Ferrari et al. 2003). A sketch of the possible merging scenario in the central field of the cluster covered by our Chandra observations is shown in Fig. 10, in which the following features emerge:
-
-
a main cluster centred on the X-ray/optical barycentre of the system;
-
-
a group of galaxies (clump A) with its ICM density peak centred on the BCG, which is infalling on the main cluster along a NW/SE direction (-0.5 Gyr from the closest cores encounter);
-
-
two other structures possibly interacting with the main cluster (W and NE), the former in the central phases of an off-axis collision coming somewhere from S-SE, the latter at the beginning of the interaction and coming from North-East. The nature of these two substructures, and in particular of NE, is however very uncertain;
-
-
two edges in the ICM density (A1 and A2), probably due to ongoing merging events either in the central field of the cluster observed by Chandra, or in its outer regions.
In conclusion, Chandra observations confirm that A521 is made up by several sub-clusters and groups of galaxies converging towards the centre of the cluster and observed in different phases of their merging process. The higher resolution density and temperature maps allow to corroborate and refine the merging scenario of the group hosting the BCG (i.e. clump A), and to identify new signatures of other possible interactions (i.e. the groups W and NE, the arcs A1 and A2). A deeper and wider optical spectroscopic coverage is now necessary to understand the most puzzling regions of this system and clarify its extremely complex multiple merging scenario.
Appendix A Radio emission in A521
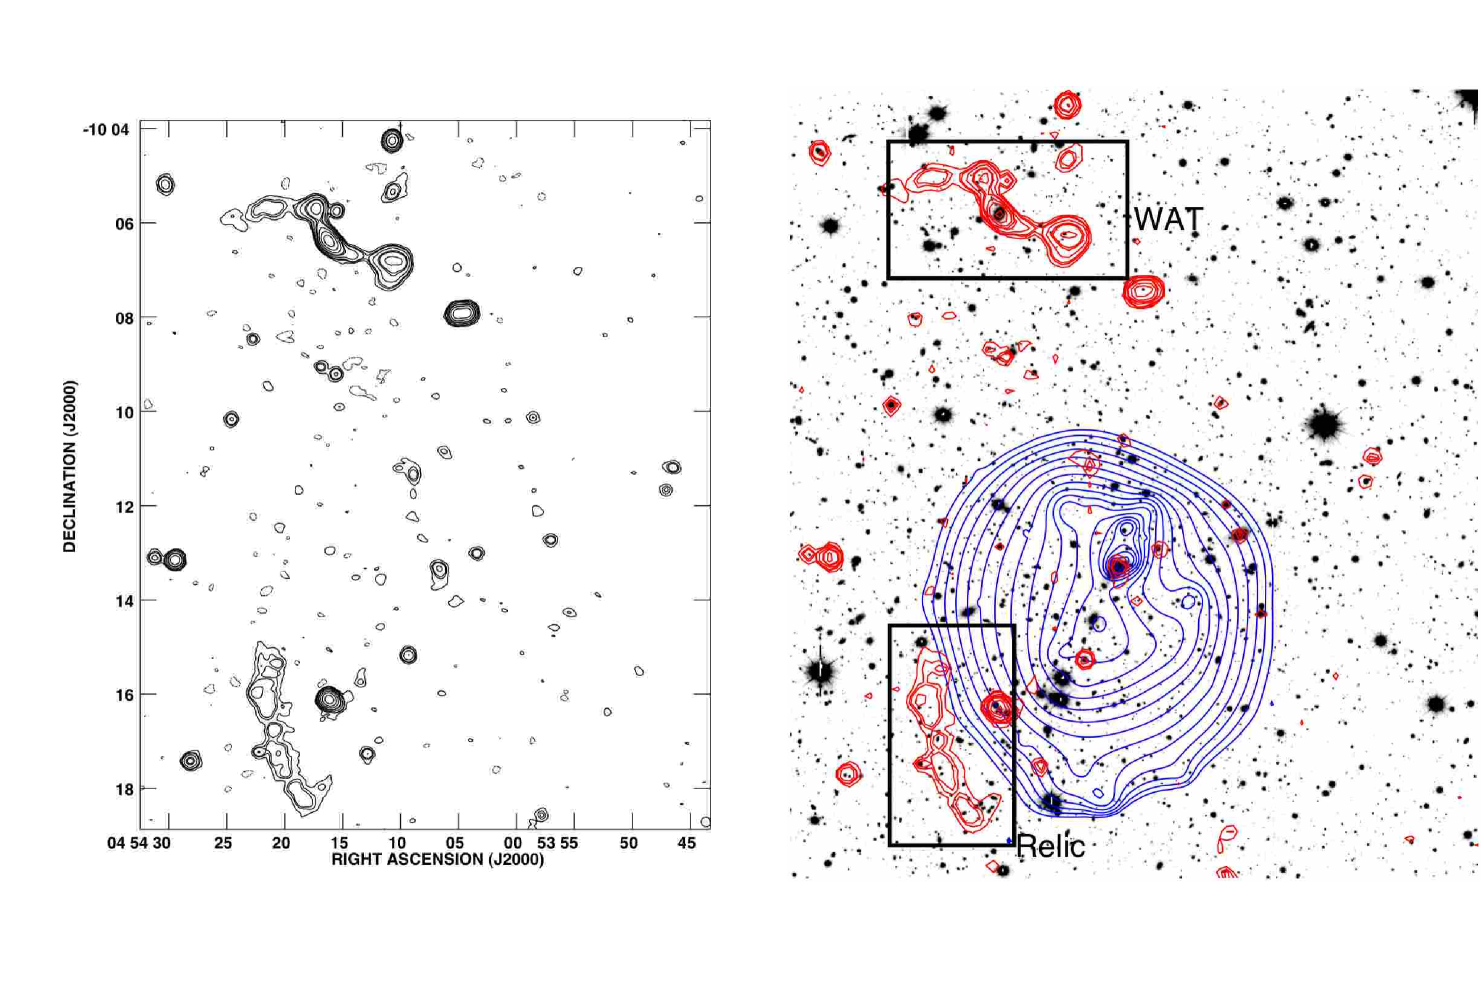
New VLA observations at 1.4 GHz, with angular resolution of 12”12” and sensitivity of 0.025 mJy/beam (1) have revealed the presence of a faint radio relic in the South/East region of the cluster (Fig. 11 and Ferrari 2003), thus supporting the perturbed dynamics of A521. Such low-brightness extended radio sources are indeed only detected in cluster mergers (Feretti 2003). Detailed results on this radio source will be presented elsewhere (Ferrari et al. in preparation).
A Wide Angle Tail (“WAT”) radio source has also been detected in the North of the cluster (Fig. 11 and Ferrari 2003). The WAT is located in the clump E1, which is probably merging with the main cluster (see Sect. 4.3 and Fig. 9). Further spectroscopic observations could reveal if the optical galaxy associated to the WAT is at the cluster redshift. The relative motion between the host galaxy and the ICM, due to the infall of the clump E1 towards the cluster centre, would then be responsible for the observed bend of the radio jets (Feretti and Venturi 2002).
Acknowledgements.
We warmly thank Wolfgang Kapferer, Magdalena Mair and Jean-Luc Sauvageot for intensive and fruitful discussions on the merging scenario of the cluster. We are very grateful to Luigina Feretti for her helpful contribution to the analysis of the radio properties of A521. The authors thank the anonymous referee for his/her suggestions that improved the presentation of the paper. This research was supported in part by Marie Curie individual fellowship MEIF-CT-2003-900773 (CF).References
- (1) Abell, G.O., Corwin, H.G., & Olowin, R.P., 1989, ApJS, 70, 1
- (2) Abell, G.O., 1958, ApJS, 3, 211
- (3) Adami, C., Biviano, A., Durret, F., & Mazure, A., 2005, astro-ph/0507542
- (4) Anders, E., & Grevesse, N., 1989, GeCoA, 53, 197
- (5) Arnaud, M., Maurogordato, S., Slezak, E., & Rho, J., 2000, A&A, 355, 461
- (6) Bardelli, S., Venturi, T., Zucca, E., De Grandi, S., Ettori, S., & Molendi, S., 2002, A&A, 396, 65
- (7) Bardelli, S., Zucca, E., Zamorani, G., Moscardini, L., & Scaramella, L., 2000, MNRAS, 312, 540
- (8) Barrena, R., Biviano, A., Ramella, M., Falco, E.E., & Seitz, S., 2002, A&A, 386, 861B
- (9) Belsole, E., Sauvageot, J.-L., Pratt, G. W., & Bourdin, H., 2005, A&A, 430, 385
- (10) Belsole, E., Pratt, G. W., Sauvageot, J.-L., & Bourdin, H., 2004, A&A, 415, 821
- (11) Bertschinger E., 1998, ARA&A, 36, 599
- (12) Borgani, S., Murante, G., Springel, V., Diaferio, A., Dolag, K., Moscardini, L., Tormen, G., Tornatore, L., Tozzi, P., 2004, MNRAS, 348, 1078
- (13) Boschin, W., Girardi, M., Barrena, R., Biviano, A., Feretti, L., & Ramella, M., 2004, A&A, 416, 839
- (14) Czoske, O., Moore, B., Kneib, J.P., & Soucail, G., 2002, A&A, 386, 31
- (15) Demarco, R., Rosati, P., Lidman, C., et al., 2005, A&A, 432, 381
- (16) Dickey, J.M., & Lockman, F.J., 1990, ARA&A, 28, 215
- (17) Donnelly, R.H., Forman, W., Jones, C., Quintana, H., Ramirez, A., Churazov, E., Gilfanov, M, 2001, ApJ, 562, 254
- (18) Dupke, R., & White, R. E. 2003, ApJL, 583, 13
- (19) Durret, F., Lima Neto, G.B., & Forman, W., 2005, A&A, 432, 809
- (20) Durret, F., Forman, W., Gerbal, D., Jones, C., Vikhlinin, A., 1998, A&A, 335, 41
- (21) Feretti L., 2003, in Texas in Tuscany, XXI Symp. on Relativistic Astrophysics, eds. R. Bandeira, R. Maiolino, F. Mannucci, World Scientif. Publ. Singapore, p. 209
- (22) Feretti L., & Venturi, T., 2003, “Merging Processes in Galaxy Clusters”, edited by L. Feretti, I.M. Gioia & G. Giovannini, (Kluwer, Dordrecht=, pp. 163-195
- (23) Ferrari, C., Benoist, C., Maurogordato, S., Cappi, A., & Slezak, E., 2005, A&A, 430, 19
- (24) Ferrari, C., Maurogordato, S., Cappi, A., & Benoist, C., 2003, A&A, 399, 813
- (25) Ferrari, C., 2003, PhD thesis, University of Nice-Sophia Antipolis, France
- (26) Flores, R.A., Quintana, H., & Way, M. J., 2000, ApJ, 532, 206
- (27) Forman, W., Jones, C., & Tucker, W., 1985, ApJ, 293, 102
- (28) Gavazzi, G., Cortese, L., Boselli, A., Iglesias-Paramo, J., Vílchez, J.M., & Carrasco, L., 2003, ApJ, 597, 210
- (29) Henriksen, M.J., & Tittley, E., 2002, ApJ, 577, 701
- (30) Henriksen, M.J., Donnelly, R.H., & Davis, D.S., 2000, ApJ, 529, 692
- (31) Henry, J.P., Finoguenov, A., & Briel, U.G., 2004, ApJ, 615, 181
- (32) Hoessel, J., 1980, ApJ, 241, 493
- (33) Johnson, M.W., Cruddace, R.G., Wood, K.S., Ulmer, M.P., & Kowalski, M.P., 1983, ApJ, 266, 425
- (34) Kowalski, M.P., Cruddace, R.G., Wood, K.S., & Ulmer, M.P., 1984, ApJS, 56, 403
- (35) López-Cruz, O., Yee, H.K.C., Brown, J.P., Jones, C., & Forman, W., 1997, ApJL, 475, 97
- (36) Lubin L. M., Bahcall, N. A., 1993, ApJ, 415, L17
- (37) Markevitch, M., Govoni, F., Brunetti, G., & Jerius, D., 2005, ApJ, 627, 733
- (38) Markevitch, M., Gonzalez, A. H., David, L., Vikhlinin, A., Murray, S., Forman, W., Jones, C., & Tucker, W. 2002, ApJL, 567, 27
- (39) Markevitch, M., & Vikhlinin, A., 2001, ApJ, 563, 95
- (40) Markevitch, M., Vikhlinin, A., & Mazzotta, P. 2001, ApJL, 562, 153
- (41) Markevitch, M., Ponman, T.J., Nulsen, P.E.J., et al., 2000, ApJ, 541, 542
- (42) Maurogordato, S., Proust, D., Beers, T. C., Arnaud, M., Pelló, R., Cappi, A., Slezak, E., Kriessler, J. R., 2000, A&A, 355, 848
- (43) Mazzotta, P., Markevitch, M., Vikhlinin, A., Forman, W. R., David, L. P., & VanSpeybroeck, L. 2001, ApJ, 555, 205
- (44) Merritt, D., 1984, ApJ, 276, 26
- (45) Plionis, M., Benoist, C., Maurogordato, S., Ferrari, C., Basilakos, S., 2003, ApJ, 594, 144
- (46) Poggianti, B.M., Bridges, T.J., Komiyama, Y., Yagi, M., Carter, D., Mobasher, B., Okamura, S., & Kashikawa, N., 2004, ApJ, 601, 197
- (47) Ricker, P.M., Sarazin, C.L., 2001, ApJ, 561, 621
- (48) Roettiger, K., Burns, J., Loken, C., 1993, ApJ, 407, 53
- (49) Rose, J. A., Gaba, A.E., Christiansen, W.A., Davis, D.S., Caldwell, N., Hunstead, R.W., & Johnston-Hollitt, M., 2002, AJ, 123, 1216
- (50) Schindler, S., & Müller, E., 1993, A&A, 272, 137
- (51) Starck, J.L., Murtagh, F., Bijaoui, A., 1998, ”Image and Data Analysis: The Multiscale Approach”, Cambridge University Press
- (52) Sun, M., Murray, S. S., Markevitch, M., & Vikhlinin, A. 2002, ApJ, 565, 867
- (53) Takizawa, M., 1999, ApJ, 520, 514
- (54) Umeda, K., Yagi, M., Yamada, S.F., et al., 2004, ApJ, 601, 805
- (55) Valtchanov, I., Murphy, T., Pierre, M., Hunstead, R.W., & Lémonon, L., 2002, A&A, 392, 795
- (56) Vikhlinin, A., Markevitch, M., & Murray, S. S. 2001, ApJ, 551, 160
- (57) West, M.J., Jones, C., & Forman, W., 1995, ApJL, 451, 5
- (58) West, M.J., 1994, MNRAS, 268, 79
- (59) Zabludoff, A.I., & Mulchaey, J., 1998, ApJ, 496, 39