2National Astronomical Observatories, Chinese Academy of Sciences, Beijing 100012, China
The relation between X-ray spectral index and the Eddington ratio in AGNs
Abstract
Using the H linewidth, we obtained the virial central supermassive black hole masses and then the Eddington ratios in a sample of broad-line AGNs and NLS1s observed by ASCA. Combined with the data from ROSAT and Chandra observations, We found a strong correlation between hard/soft X-ray photon index and the Eddington ratio. Such a correlation can be understood by a two-zone accretion flow model, in which zone is a thin disk and the inner zone is an advection-dominated accretion flow (ADAF) disk. The relation between X-ray photon index and the Eddington ratio may account for NLS1s with not too steep X-ray photon index founded by SDSS. If this relation is directly related to the accretion disk, it may also exist in the accretion disk of different scales (such as microquasar)
keywords:
galaxies: active — galaxies: nuclei — galaxies: Seyfert — galaxies: X-ray.1 Introduction
With the reverberation mapping technology, there appears a rapid progress on the mass estimate of the supermassive black hole (SBH) in active galactic nuclei (AGNs) and then the Eddington ratio (the ratio of the bolometric luminosity to the Eddington luminosity, ), which boosts our understanding of their central structure and their evolution.
Steep soft X-ray photon index is a character of NLS1s compared with the broad-line AGNs (Boller, Brandt & Fink 1996). A popular model of NLS1 is that they contain less massive black holes, but have higher accretion rates radiating at close Eddington luminosity. Within the Sloan Digital Sky Survey (SDSS) Early Data Release (EDR) 150 NLS1s are founded (Williams, Pogge & Mathur 2002) and the soft X-ray photon index of some NLS1s observed by Chandra are found not too steep compared with that normally observed in NLS1s (Williams, Mathur & Pogge 2004).
Here we suggested that there exists a relation between X-ray photon index and the Eddington ratio in AGNs including broad-line AGNs and NLS1s. The Eddington ratio will lead to smaller soft X-ray photo index in some NLS1s.
2 Relation between X-ray photon index and the Eddington ratio
2.1 Eddington ratio
If we know the broad line region (BLR) size () and BLR velocity (), we can derived the black hole mass () using Newton law, . The BLRs sizes can be derived from the reverberation mapping method or the empirical size-luminosity formula (Kaspi et al. 2000),
| (1) |
where is the monochromatic luminosity at 5100. Assuming the random BLRs orbits, the BLRs velocity can be derived from the H linewidth (),
| (2) |
It is usually suggested there exists accretion disk system in the center of AGNs. We used the Eddington ratio, , as a direct measurement of the accretion rate. is usually calculated by (Kaspi et al. 2000), where is the monochromatic luminosity at 5100.
2.2 X-ray spectral index
In general, the X-ray emission spectra of AGNs can be well fitted by a power law ( , where is the spectral index and is the photon index). The hard X-ray photon indices of AGNs observed by ASCA are determined in the 2-10 keV (rest frame) for each source, excluding the 5-7.5 keV (rest frame) which can contain significant photons from an Fe K line (confusing measurements of the hard X-ray index). For soft X-ray spectral index, it is determined in the 0.1-2.4 keV (rest frame). For very weak X-ray emission, the photon index can be derived using the hardness ratio and other two parameters: response function and column density (Williams et al. 2004).
2.3 Samples
We have assembled a sample of broad-line AGNs and NLS1s to do a research on the X-ray excess variability (Bian & Zhao 2003). The sample consists of 41 AGNs, in which there are 18 NLS1s and 23 broad-line AGNs.
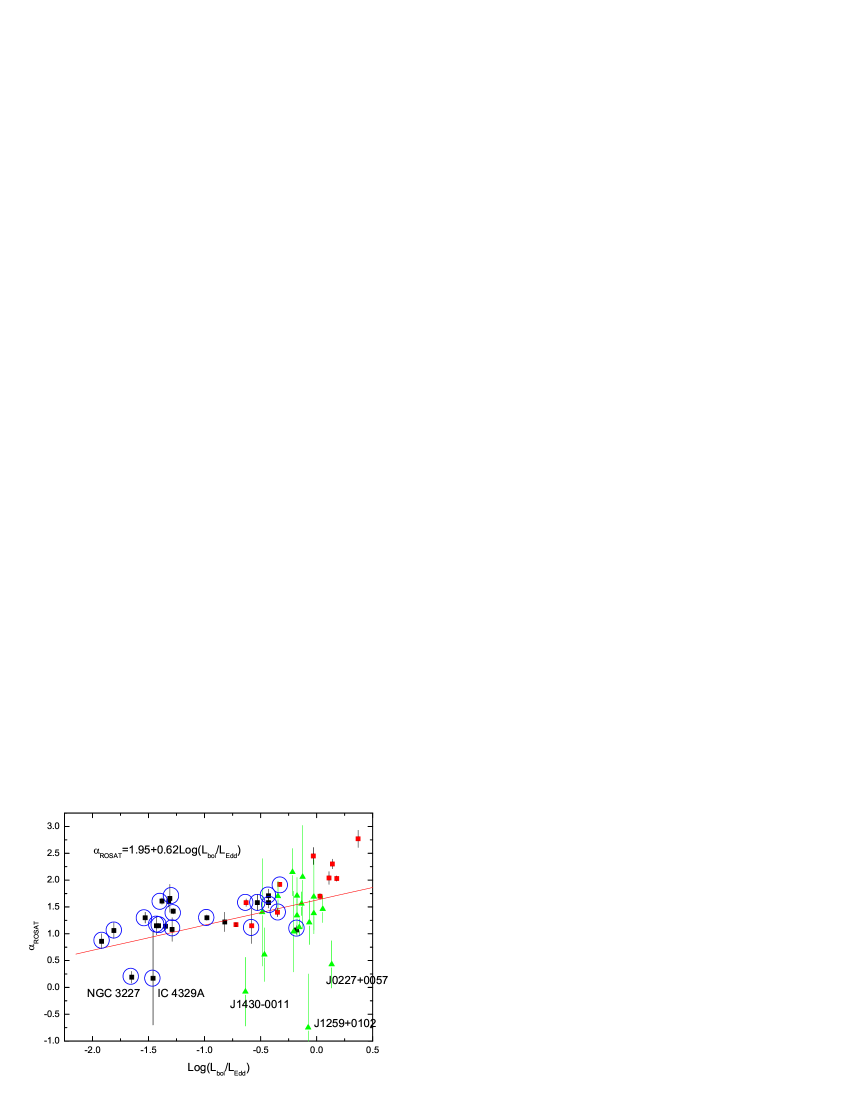
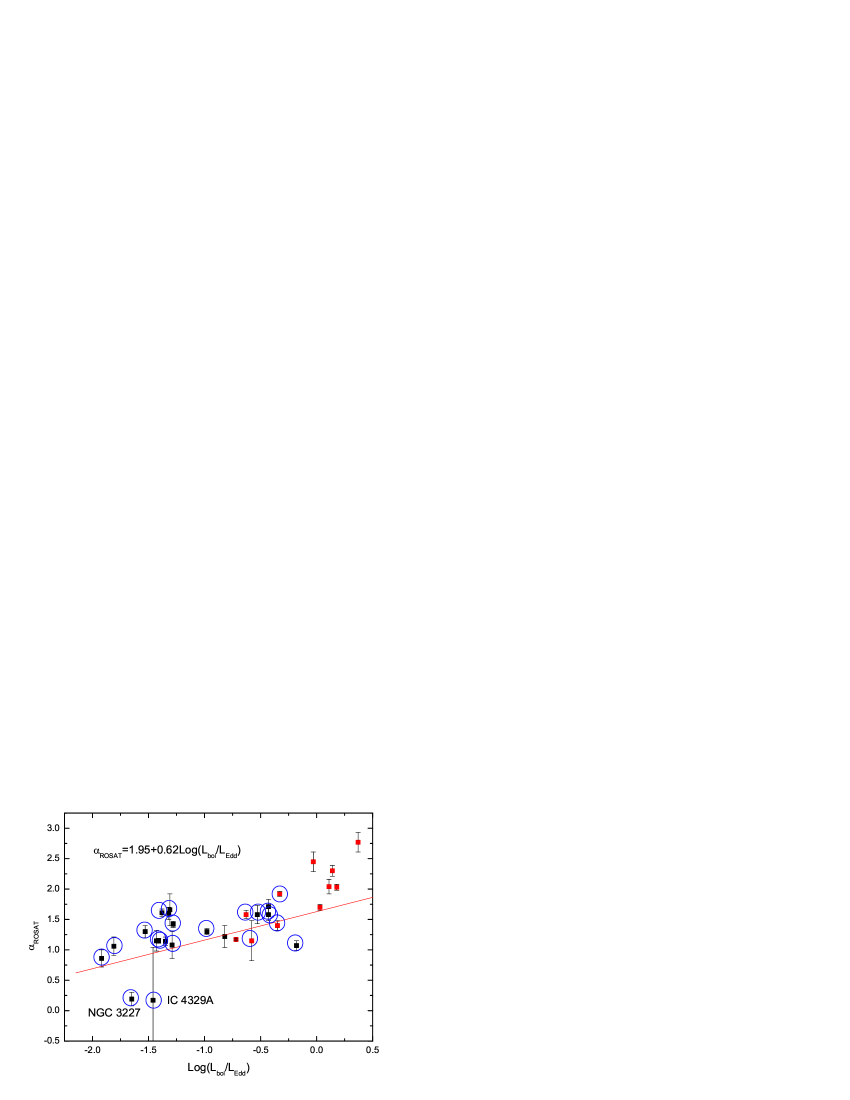
For our sample (Bian & Zhao 2003), the relation between the hard/soft X-ray photon/ spectral index and the Eddington ratio is showed in Fig. 1-2. A simple least-squares linear regression gives with a Pearson correlation coefficient of corresponding to a probability of that the correlation is caused by a random factor. The best fit line is showed in Fig. 2 for all AGNs in our sample.
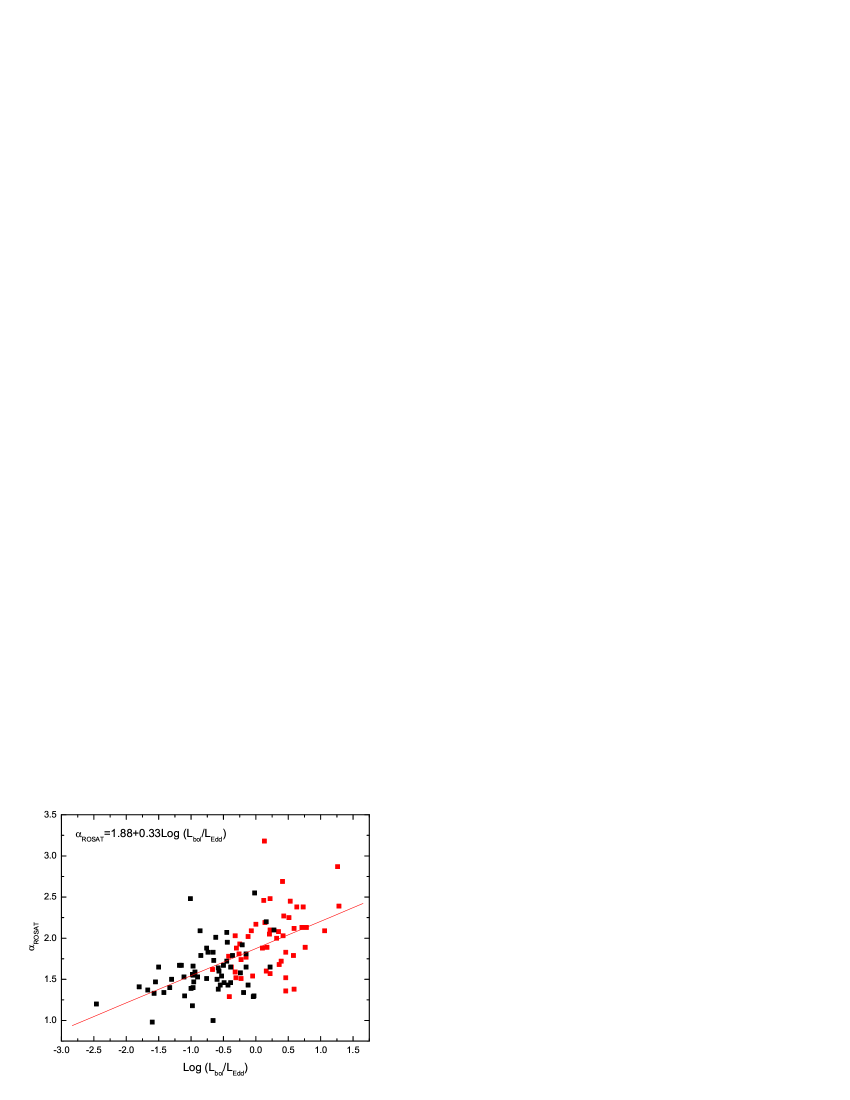
Grupe et al. (2004) presented a complete sample of 110 soft X-ray selected AGNs adopting the criterion of hardness ratio less than zero and found about half of them are NLS1s. Fig. 3 showed the soft X-ray spectral index versus the Eddington ratio for the sample of Grupe et al. (2004) (Grupe 2004). A simple least-squares linear regression gives (, ). The best fit line is also showed in Fig. 3.
Williams et al. (2003) presented a sample of 150 NLS1s found within SDSS EDR, which is the largest sample of NLS1s. Williams et al. (2004) recently present Chandra observations of 17 optically-selected, X-ray weak narrow-line Seyfert 1 (NLS1) galaxies and exhibit a range of 1.1-3.4 for the 0.5-2 keV photon indices, which extend to values far below what are normally observed in NLS1s. From Fig. 2, we found that most of these 17 NLS1s follow the fit line. The calculated Eddington ratios showed that their smaller photon indices are related to their smaller Eddington ratios.
3 Discussion
From Fig. 2, we can find that some AGNs deviated much from the trend. It is possibly due to the uncertainty of the estimate of bolometric luminosity from optical luminosity. Different energy mechanics and/or different accretion state would lead to different energy distribution. It is simple to derive the bolometric luminosity from the monochromatic luminosity at 5100 . There is some uncertainty in the estimate of black hole mass. For NLS1s, the orbits of BLRs is not random, we may make some correction of equation (2). Bian & Zhao (2004) discussed the different methods to estimate black hole masses in NLS1s.
The relation between X-ray spectral index and the Eddington ratio can be understood in the frame of the accretion disk and the corona. For a thin disk, the disk luminosity to irradiate the corona increases as the Eddington rate increases. This can cause the corona to cool efficiently owing to Compton cooling and cooler corona producing few hard X-ray photons leads to large X-ray spectral index. For the ADAF model of low accretion rate, the optical depth increases and causes a correspondent increase in the Compton -parameter when the Eddington ratio increases. Larger optical depth will result in a harder and smoother X-ray spectrum index, which is in conflict with our discussed relation. A accretion disk consisting two zones (outer thin disk and inner ADAF disk) is our preferable interpretation. The truncation radius of the two zones decreases with increasing Eddington ratio. The ADAF X-ray photon index becomes dramatically softer because the radiation from the disk is Compton-scattered by the hot gas in ADAF as the Eddington rate increases. This correlation possibly gives a clue to the formation of corona (Wang et al. 2004).
It seemed that this relation is directly related to the accretion disk, therefore it may also exist in the accretion disk of different scales (such as accretion disk in microquasar).
Acknowledgements.
This work has been supported by the NSFC (No. 10273007; No. 10273011) and NSF from Jiangsu Provincial Education Department (No. 03KJB160060).References
- [] Bian W., Zhao, Y., 2003, MNRAS, 343, 164
- [] Bian W., Zhao, Y., 2004, MNRAS, 352,823
- [] Boller Th., Brandt W. N., & Fink H. 1996, A&A, 305, 53
- [] Grupe D., et al., 2004, AJ, 127, 156
- [] Grupe D. 2004, AJ, 127, 1799
- [] Wang J.M., Watarai K. Y., & Mineshige S., 2004, ApJ, 607, L107
- [] Williams R. J., Pogge R. W., Mathur S. 2002, AJ, 124, 3042
- [] Williams R. J., Mathur S., Pogge R. W. 2004, AJ, in press, astro-ph/0402236