Keck Interferometer observations of classical and weak line T Tauri stars
Abstract
We present observations of the T Tauri stars BP Tau, DG Tau, DI Tau, GM Aur, LkCa 15, RW Aur and V830 Tau, using long baseline infrared interferometry at K band (2.2 m) from the Keck Interferometer. The target sources have a range of mass accretion rates and excess near-infrared emission. The interferometer is most sensitive to extended emission on characteristic size scales of 1 to 5 millarcseconds. All sources show evidence for resolved K band emission on these scales, although a few of the sources are marginally consistent with being unresolved. We calculate the infrared excess based on fitting stellar photosphere models to the optical photometry and estimate the physical size of the emission region using simple geometric models for the sources with a significant infrared excess. Assuming that the K band resolved emission traces the inner edge of the dust disk, we compare the measured characteristic sizes to predicted dust sublimation radii and find that the models require a range of dust sublimation temperatures and possibly optical depths within the inner rim to match the measured radii.
1 Introduction
Circumstellar disks are an established component of the star formation paradigm. The circumstellar disk in the T Tauri stage can have several attributes: a large, cold disk as traced by millimeter emission, a substantial inner disk revealed by excess infrared emission and accretion onto the central star measured by ultraviolet excess or H emission. Young stellar objects are often classified by their infrared spectral index (Class I, II, III; Lada & Wilking, 1984) and by their H line-width (classical T Tauris with Å and weak-line T Tauris with 10 Å). These classifications may represent evolutionary stages, with Class I sources considered the youngest with more massive disks and higher accretion rates, although some recent work has questioned the age-evolution nature of this sequence (White & Hillenbrand, 2004). Accretion onto the central star from the disk is dependent on and influences the inner disk (1 AU) properties. Determination of the temperature and density structure of the inner disk is important for understanding the mechanisms which drive outflows and for establishing the initial conditions for planet formation. By studying disks around stars with a range of stellar and disk properties we can begin to characterize the range of disk properties and their relation to stellar properties.
Until the advent of infrared interferometry, the characteristics of the inner disk were determined through spatially-unresolved photometric or spectroscopic observations. Near-infrared interferometry is ideal for studying the inner disk, as these observations are sensitive to hot material near the star itself and given the milliarcsecond (mas) resolution capability of the current generation of interferometers, these observations can in many cases spatially resolve the emission from the inner disk. Previous studies (Malbet et al., 1998; Millan-Gabet et al., 1999; Akeson et al., 2000; Millan-Gabet, Schloerb, and Traub, 2001; Tuthill et al., 2001) have resolved the emission around Herbig Ae/Be stars, FU Ori objects and T Tauri stars. The initial results for T Tauri and Herbig stars found characteristic sizes larger than expected from geometrically flat accretion disks with power-law temperature and density distributions (Millan-Gabet et al., 1999; Akeson et al., 2000; Millan-Gabet, Schloerb, and Traub, 2001), while more recent observations of some Herbig Be stars (Eisner et al., 2004) have found some objects which are consistent with accretion disk predictions. With the arrival of large aperture interferometers, this technique can be applied to a much larger number of objects covering a larger range of stellar and disk properties and initial results have already appeared (Colavita et al., 2003; Leinert et al., 2004; Eisner et al., 2005; Monnier et al., 2005).
Here we present Keck Interferometer observations of seven classical and weak-line T Tauri stars with a range of inner disk and accretion diagnostic observational signatures. In §2, we describe the source selection and characteristics of the sample and in §, 3 the infrared interferometry and photometry observations. Simple geometric models are fit to the data in §4 and the results are discussed in §5.
2 Sources
Candidate sources were selected with a range of disk properties, as traced by the infrared excess and the H line width, and which could be tracked by the Keck Interferometer in both the visible and infrared bands. All sources are in the Taurus-Aurigae cloud and we assume a distance of 140 pc. Given the visible sensitivity requirement, the sample is biased against edge-on sources, because at high inclinations the outer disk obscures the central region where the visible light originates. The source list with stellar and spectral properties is given in Table 1. For some of these sources, a wide range of luminosities are estimated in the literature. For consistency, the given luminosities are from a single work where possible (White & Ghez, 2001) and from spectroscopic determinations (White & Hillenbrand, 2004) for the other sources.
| Source | Sp Type | Teff | L⋆(L⊙) | M⋆(M⊙) | R⋆(R⊙)aaStellar radius derived from the stellar luminosity and effective temperature | VmagbbAverage V magnitude from Kenyon and Hartmann (1995) | Kmag | F1mm(mJy) | Ref. | |
|---|---|---|---|---|---|---|---|---|---|---|
| BP Tau | K7 | 4060 | 0.83 | 0.77 | 1.9 | 12.2 | 7.7 | 37 | 1,2,4 | |
| DG Tau | K3 | 4775 | 3.62 | 2.2 | 2.8 | 12.4 | 7.0 | 443 | 2,3,4 | |
| DI Tau | M0 | 3850 | 0.62 | 0.4 | 1.79 | – | 12.8 | 8.4 | 35 | 1,4 |
| GM Aur | K3 | 4730 | 1.01 | 1.22 | 1.5 | 12.0 | 8.3 | 253 | 1,2,4 | |
| LkCa15 | K5 | 4350 | 0.74 | 1.05 | 1.5 | 12.4 | 8.2 | 167 | 1,2,5 | |
| RW Aur | K2 | 4955 | 1.7 | 1.34 | 1.7 | 10.5 | 7.0 | 421 | 2,5 | |
| V830 Tau | K7 | 4060 | 0.79 | 0.77 | 1.83 | 12.2 | 8.4 | 9 | 1,2,5 |
3 Observations
3.1 Infrared interferometry
Interferometry data were taken at the Keck Interferometer (KI), a direct-detection infrared interferometer which connects the two 10-meter Keck telescopes. The system includes adaptive optics for each telescope with wave-front sensing in the visible, angle tracking operating at J and H bands and fringe tracking at K band. The fringe tracking camera has a 50 mas FWHM field of view with a Gaussian acceptance pattern. KI is described in detail by Colavita & Wizinowich (2003) and references therein.
Observations were taken from October 2002 to January 2004, over a total of five nights. The DG Tau data were previously presented in the analysis of Colavita et al. (2003). The data presented here are from the wideband channel (=2.14 m and 0.3m). Observations consisted of a series of interleaved integrations on the source and several calibrators. The sequence of calibrations and the standard KI data analysis method, in which the visibility is corrected for the measured flux ratio of the two arms, are described by Colavita et al. (2003). The data are presented as the visibility amplitude squared, normalized such that an unresolved object has V.
The system visibility, the instrumental response to a point source, is measured using the calibrator stars listed in Table 2. Ideally, calibrator stars would match the target star at R (adaptive optics), J (angle tracking) and K (fringe tracking) bands. However, given the colors of young stellar objects, these criteria cannot be simultaneously met by standard stars and in choosing calibrators, the angular distance and K band magnitude were given preference in the matching. Calibrators were shared between targets whenever possible to optimize the observing efficiency. The calibrator angular sizes were estimated by modeling archival photometry from SIMBAD (references in Table 2) and the Two Micron All Sky Survey (2MASS). All of the calibrators have angular diameters less than 0.3 mas and thus are unresolved by the interferometer. The calibrator angular size uncertainties were set to 0.1 mas. Source and calibrator data were corrected for biases using sky calibrations as described by Colavita et al. (1999) and averaged into blocks of 5 seconds each. The data were calibrated by dividing the measured visibility for each target by the system visibility obtained from interpolating the bracketing calibrator measurements, using the standard calibration package from the Michelson Science Center. The calibrated data points for the target source are the average of the 15 to 25 5-second blocks in each integration, with an uncertainty given by the quadrature of the internal scatter and the uncertainty in the calibrator size. As our calibrators were unresolved, the size uncertainties have no significant effect on the target calibrated visibilities. The average calibrated squared visibility, uncertainties and projected baseline spatial frequency components () for each source are given in Table 3.
Given the limited amount of data collected, interpretation of the results depends critically on determining the correct uncertainties in the measurements, particularly for those objects which are marginally resolved. The visibility data presented here were taken during the commissioning phase of the KI, when many system tests were also undertaken. The accuracy of the KI visibility mode was determined through observations of binary targets with known orbits111see http://msc.caltech.edu/KISupport/index.html for details and it was established that during the commissioning phase the systematic uncertainty in V2 for sources at this brightness level was 0.05. Therefore, we add a systematic uncertainty of 0.05 in quadrature with the measurement error. Although any magnitude dependence of the fringe tracker is not yet definitively established, each target source is bracketed in K magnitude by its calibrators, which will minimize any dependencies of the calibrated visibility on magnitude.
| Calibrator | Ang. size | V | K | Sources |
|---|---|---|---|---|
| (mas) | ||||
| HD 282230 | 0.16 | 9.1 | 8.6 | BP Tau, DG Tau, DI Tau, GM Aur, LkCa 15, RW Aur, V830 Tau |
| HD 29050aaSIMBAD spectral type produced bad fit, used G8V template. | 0.18 | 8.9 | 6.8 | DG Tau |
| HD 283668bbSIMBAD spectral type incorrect, used early K dwarf template. | 0.19 | 9.4 | 7.0 | BP Tau, DG Tau, DI Tau, LkCa 15, V830 Tau |
| HD 29334 | 0.12 | 9.0 | 8.6 | DI Tau, GM Aur, LkCa 15, V830 Tau |
| HD 251383 | 0.17 | 9.4 | 7.2 | GM Aur |
| HD 36724 | 0.22 | 7.6 | 6.3 | RW Aur |
| Source | # of ints. aaAn integration includes 125 seconds of fringe data and all necessary internal calibrations. | Avg. V2 | u (meters) | v (meters) | ||
|---|---|---|---|---|---|---|
| BP Tau | 3 | 0.872 | 0.050 | 0.071 | 54.7 | 60.5 |
| DG Tau | 5 | 0.383 | 0.011 | 0.051 | 42.0 | 73.4 |
| DI Tau | 2 | 0.791 | 0.072 | 0.088 | 55.9 | 53.3 |
| GM Aur | 4 | 0.862 | 0.031 | 0.059 | 55.1 | 47.4 |
| LkCa 15 | 2 | 0.895 | 0.018 | 0.053 | 55.2 | 54.1 |
| RW Aur | 3 | 0.609 | 0.018 | 0.053 | 42.5 | 73.5 |
| V830 Tau | 2 | 0.879 | 0.042 | 0.065 | 51.3 | 64.0 |
3.2 Photometry
Visible and infrared photometry data for these sources were obtained at the MDM Observatory 1.3m telescope and are listed in Table 4. The UBVRI photometry was based on Landolt (1983) standards observed on 29 Nov 2004 using Johnson UBVR and Kron-Cousins I filters in the 8k imager. The JHK photometry is based on bright infrared standards observed on 1 Dec 2004 using Barr JHK filters in the TIFKAM instrument.
| Source | U | B | V | R | I | J | H | K |
|---|---|---|---|---|---|---|---|---|
| BP Tau | 13.200.15 | 13.360.03 | 12.320.04 | 11.450.04 | 10.600.04 | 9.100.10 | 8.370.10 | 7.900.10 |
| DG Tau | 13.930.04 | 13.970.03 | 12.790.04 | 11.700.04 | 10.670.04 | — | — | — |
| DI Tau | 16.060.25 | 14.450.03 | 12.960.04 | 11.870.04 | 10.700.04 | — | — | — |
| GM Aur | 13.900.04 | 13.380.03 | 12.190.04 | 11.340.04 | 10.610.04 | — | — | — |
| LkCa15 | 13.980.07 | 13.300.03 | 12.090.04 | 11.260.04 | 10.520.04 | — | — | — |
| RW Aur | 10.860.04 | 11.070.03 | 10.320.04 | 9.780.04 | 9.170.04 | 8.340.10 | 7.660.10 | 7.180.10 |
| V830 Tau | 14.660.15 | 13.520.03 | 12.210.04 | 11.260.04 | 10.440.04 | — | — | — |
4 Geometric models
Given the limited spatial frequency () coverage of the data, we use simple geometric models to characterize the size of the emission region. Only emission within the 50 mas field-of-view will contribute to the measured visibilities. We assume that the compact ( 50 mas) emission comprises the central star, which is unresolved at this resolution, an incoherent contribution if an extended (i.e. completely resolved) component is present and a partially resolved component. Before the geometric models are fit to the data, we first consider the possibility of stellar companions affecting the measured visibilities (§4.1), then attempt to quantify the possible contribution from an extended component (§4.2) and finally quantify the stellar contribution through photometry fitting (§4.3).
4.1 Known companions
We have searched the literature for known companions to our sources. BP Tau, DG Tau, GM Aur, LkCa 15 and V830 Tau have all been included in multiplicity searches with speckle, HST imaging, and spectroscopy and no companions were found (Ghez et al., 1993; Sartoretti et al., 1998; Leinert et al., 1993; Walter et al., 1988). RW Aur and DI Tau have known, but in our case, negligible companions, which are discussed below. Archival radial velocity data from the Center for Astrophysics survey shows no significant variations for any of the sources, except for RW Aur A (Guillermo Torres, private communication). Given the insignificant contributions of the known companions, all targets are treated as single stars in the geometric models.
RW Aur is a binary with a separation of 14 and a K band flux ratio of 4.3 (White & Ghez, 2001). The primary is well separated from the secondary by the adaptive optics system at Keck and the secondary does not contribute any flux because it lies well outside the fringe tracker field-of-view. Gahm et al. (1999) reported spectroscopic variability in RW Aur A and suggested that it may be a single-line spectroscopic binary with a period of 2.8 days, although other causes of the variability have not been ruled out. If RW Aur A is a spectroscopic binary, the measured radial velocity amplitude of 5.7 km/sec leads to a mass function of (Gahm et al., 1999), which suggests a large mass ratio and thus a large flux ratio at K. It is therefore unlikely that the resolved visibility is due to the possible companion.
DI Tau is a binary with a separation of 012 and a K band flux ratio of 8 (Ghez et al., 1993). The secondary has not been detected in the visible and the lower limit to the V band flux ratio is 21 (Simon et al., 1996). The adaptive optics system will track within a few mas of the primary and the incoherent flux contribution from the secondary at K, including the tapering by the fringe tracker field-of-view (FOV), is negligible ().
4.2 Extended components
Current imaging capabilities in the near infrared are not sufficient to establish the distribution of flux on scales of several to 50 mas (the KI FOV), which will contribute incoherently to the measured visibility. Possible sources of extended emission in these systems include thermal or scattered emission from an envelope and scattered light from the disk. In this section, we discuss the limited observational constraints and argue that, with one exception, there is no evidence for substantial extended emission. Any incoherent contribution (which always decreases the measured visibility) not accounted for results in an overestimate of the size of the partially resolved component.
The observational technique which most directly addresses these size scales is lunar occultation, which can probe emission down to several mas. In our sample, two objects, DI Tau and DG Tau have been observed through lunar occultations. Observations of DI Tau revealed the secondary discussed in §4.1 (Chen et al., 1990). The observations of DG Tau by Leinert et al. (1991) revealed extended emission, attributed to scattered light, which they fit with two components of sizes 45 and 850 mas (FWHM) Gaussian. The smaller component had a flux ratio (extended/total) of 0.23. Chen et al. (1992) derived similar results from independent observations. We neglect the 850 mas component as it contributes only 3% of the total flux at K, but include the 45 mas component in the modeling as an extended component (following Colavita et al., 2003). In a compilation of lunar occultation observations, Simon et al. (1995) list 47 young stellar systems in Taurus and Ophiuchus; of these only one (DG Tau) is listed as having resolved emission and two are given as either extended or binary, suggesting that substantial extended components are not common on this size scale.
On larger observational scales, optical and infrared imaging can reveal emission components which may extend into the central 50 mas FOV around the star. Using Hubble Space Telescope optical imaging Krist et al. (1997) reported that LkCa 15 had no detectable reflection luminosity and Ghez et al. (1997) found that RW Aur A was consistent with a point source.
The issue of scattered light from the disk has been modeled in detail for a few class II objects by Akeson et al. (2005) who found that on much larger scales (1 arcsec) the emission beyond 12 mas contributed less than 6% of the total flux at K. These radiative equilibrium models used the dust-size distribution derived through modeling of HH 30 IRS and GM Aur (Wood et al., 2002; Schneider et al., 2003; Rice et al., 2003). Variations of the dust properties with distance from the star, which would affect the scattering properties, are not considered as this has not been studied on the spatial scales probed by the KI observations. For the sources with a substantial infrared excess, an extended component at a level of a few percent is within the error of the excess fraction and the visibility measurement, particularly considering the smaller FOV for KI.
All of these sources have been classified from their infrared SED as class II ( -2 to 0) except V830 Tau, which is class III ( -3) (Kenyon and Hartmann, 1995). In general, Class II sources are thought to have little or no envelope remaining (see e.g. Mundy, Looney, & Welch, 2000). For an envelope to contribute incoherently in these measurements, it would have to have significant emission (compared to the stellar photosphere and thermal disk emission) on size scales less than 7 AU.
Given the lack of detected extended emission, except for DG Tau, and the work on scattering from disks in similar sources, we assume for all sources except DG Tau that there is no extended component. If the measured visibilities were due entirely to a scattered or extended component, the flux ratio (extended/stellar) would range from 0.07 to 0.62 for our sample.
4.3 Spectral energy distribution modeling
Determining the stellar contribution at K-band is essential in interpreting the visibility results. To do this, we modeled optical photometry from the literature and this work with stellar photosphere spectral energy distribution (SED) templates based on the effective temperatures given in Table 1. The synthetic SEDs were taken from the libraries created by Kurucz (2001) and Lejeune et al. (1997), using the solar abundance models with an effective temperature matching that given in Table 1 and for surface gravity , appropriate for young pre-main sequence stars. The synthetic SEDs were integrated over the appropriate passband for comparison to the photometry. In general, we found better fits at optical wavelengths using the Lejeune models, and chose to standardize on that family of templates for the present analysis. The Lejeune models have a correction function applied which yields synthetic colors matching the empirical colors derived from observations of main sequence stars (Lejeune et al., 1997) and these models better fit the optical spectral shape of our targets. For a fixed template/effective temperature, photosphere apparent size and extinction () were used as free parameters in our modeling, and to avoid biases from hot accretion luminosity and cooler circumstellar material we used only the , , and photometry.
Results from the SED fitting are summarized in Table 5 and Figure 1. The fractional K-band excess is estimated by taking the K photometry measurement closest in time to the interferometry data (in all cases this is either 2MASS or from Table 4). Here we define the fractional excess as the non-stellar emission divided by the total emission at K. The uncertainty in the fractional excess is taken to be the combination of the measurement uncertainty and an estimate of the uncertainty in the stellar contribution at K. We considered two possible components to the stellar contribution uncertainty: variations in the optical photometry and therefore in the fit extinction; and variations in the infrared photometry, as the photometry and interferometry data are not contemporaneous. For these sources, the infrared variability is the dominant component and was used to determine the stellar contribution uncertainty. The infrared variability was taken to be the larger of 1) the scatter in infrared excess using K photometry fit to our stellar model or 2) the scatter in K photometry as collected by Kenyon and Hartmann (1995). Our estimated K-band excess and uncertainty are given in Table 5. Note that GM Aur had relatively few measurements in our literature search, and thus our variability estimate may be low.
| Source | Model Teff (K) | Av | Fractional K excess | K excessaaThe uncertainty includes both the measurement error and an estimate of the uncertainty in the stellar component. | Photometry ref |
|---|---|---|---|---|---|
| BP Tau | 4000 | 0.078 | 0.56 | 0.12 | 1,2,3,4 |
| DG Tau | 4750 | 1.57 | 0.67 | 0.19 | 1,2,3 |
| DI Tau | 3750 | 0.54 | 0.07 | 0.10 | 1,2,5 |
| GM Aur | 4750 | 1.21 | 0.12 | 0.02 | 1,2,3 |
| LkCa15 | 4250 | 0.46 | 0.43 | 0.04 | 1,2,6 |
| RW Aur | 5000 | 0.24 | 0.64 | 0.10 | 1,2,7 |
| V830 Tau | 4060 | 0.38 | 0.06 | 0.12 | 1,2,3,8 |

This method assumes that the VRI photometry is due entirely to emission from the stellar photosphere. Problems may arise at the shorter wavelengths with contamination from accretion luminosity and veiling and at the longer wavelengths by emission from the disk itself. DG Tau is known to have significant veiling (Johns-Krull & Valenti, 2001) and is highly variable. We were unable to fit the entire photometry collection on this source with the selected stellar template. To check our method of determining the infrared excess, we compared the values in Table 5 to measurements of the K band veiling (here converted to fractional excess at K) where available. Our determination of the K band excess does agree at the 1 level with veiling estimates from the literature, although for BP Tau, our estimate of 0.56 0.12 is higher than all three veiling estimates: 0.42 0.05 (Johns-Krull & Valenti, 2001), 0.44 0.23 (Folha & Emerson, 1999) and 0.37 0.17 (Muzerolle et al, 2003). The other sources with veiling measurements in the literature are (our fractional excess listed first): DG Tau, 0.67 0.19 vs. 0.59 0.07 (Johns-Krull & Valenti, 2001); GM Aur, 0.12 0.02 vs. 0.23 0.21 (Folha & Emerson, 1999) and RW Aur, 0.63 0.10 vs. (Folha & Emerson, 1999). A smaller fractional excess would result in a larger fit radius for a given visibility.
4.4 Sources without a measured infrared excess
The weak-line T Tauri sources DI Tau and V830 Tau show no significant excess in their SED with our modeling procedure (Figure 1). In our SED modeling, the K band excess for these two sources is 0.070.10 and 0.060.12, respectively, consistent with no near-infrared excess. The lack of simultaneous infrared photometry prevents us from a more accurate measurement of the infrared excess. Our fitting is consistent with a lack of excess determined previously for these sources at both near-infrared and mid-infrared wavelengths (Meyer et al., 1997; Stassun et al., 2001; Metchev et al., 2004). Neither of these sources has been detected at millimeter wavelengths (Table 1) which probe cooler disk material.
The measured visibilities, 0.790.08 and 0.880.07, are within 3 of an unresolved point source. For comparison, we considered the source HD 283798 (RXJ 0441.8+2658) which was mistakenly included as a calibrator. This source was identified as pre-main sequence by Wichmann et al. (1996) based on its x-ray flux and lithium line width, but has no infrared excess. The calibrated V2 for HD 283798 is 0.980.06, consistent with an unresolved source, demonstrating that not all observed sources are resolved.
One possible source of systematic error is that the science sources are all dimmer than the calibrators (and HD 283798 analyzed above) in the visible, where the adaptive optics (AO) wave-front sensing operates. The measured visibility will be reduced if the AO correction is degraded and therefore the visibility may be a function of the visible magnitude. As part of the commissioning tests to determine the system performance of the interferometer (see §3.1) attenuation was introduced in the AO system to artificially dim known calibrators. During one of these tests, the same calibrator (HD 3765) was observed in two consecutive integrations with and without AO attenuation. The true apparent V magnitude of HD 3765 is 7.4 and the attenuated apparent V mag was 11.9. The measured visibility, corrected for the ratio imbalance, was 0.65 0.08 with the AO attenuation and 0.67 0.05 without the AO attenuation. Although our science targets are up to a magnitude fainter than V=11.9, they also have a redder spectrum (V-K = 3.5 to 5.4) than HD 3765 (V-K=2.3) such that the I band magnitudes, still inside the A0 wave-front sensor spectral sensitivity, were more similar. In this limited (few integration) comparison, there is no substantial decrease in the visibility at the fainter V level, suggesting any systematic is minimal.
There are several possible causes for the measured resolved visibilities of DI Tau and V830 Tau: unknown companions within the 50 mas field of view, a small fractional excess in the near-infrared which our modeling procedure is not accurate enough to definitively measure, or an extended component due to scattered light, which, having the same spectrum as the star, would not appear as an excess in our fitting procedure. As there is no photometric evidence for a disk around these sources at any wavelength, we have not fit them with a disk model as we do for the other sources. However, we can quantify the scattered flux or unknown companion possibilities given the measured visibility. For the unknown companion, we assume that the separation is larger than the fringe spacing (as no radial velocity variations are seen) such that the potential companion would contribute incoherently to the visibility. We also assume that any potential scattered light is extended and therefore contributes incoherently. The ratio of scattered or companion flux to stellar flux would be 0.13 0.007 for DI Tau and 0.067 0.003 for V830 Tau to account for the measured visibilities.
4.5 Sources with an infrared excess
The sources BP Tau, DG Tau, GM Aur, LkCa 15 and RW Aur all show a significant near-infrared excess using our fitting method. All of these sources also have a mid-infrared excess (Figure 1) and have been detected at 1 mm (Table 1). These longer wavelength measurements suggest the presence of an extended circumstellar disk and in the case of BP Tau, DG Tau, GM Aur, and LkCa 15 the cooler, outer disk has been mapped at millimeter wavelengths (Kitamura et al., 1996; Simon et al., 2000; Qi et al., 2003).
For each of these sources, we use a model for the compact ( 50 mas) emission which consists of the central star, which is unresolved at this resolution, an incoherent contribution from known scattered light (DG Tau only) and a resolved component. To estimate the size of the resolved component, we use two simple geometric models, a uniform disk and a ring. In each case, the interferometry data is used to measure the emission region size, after accounting for the stellar and scattered components. For the ring model, the width is determined by the excess flux at K, for a blackbody temperature of 1500 K. Given the limited spatial frequency coverage of the observations, the data do not constrain the disk inclination and face-on models are used. This will underestimate the true size if the source emission has a ring-like morphology and is substantially inclined from face-on, but as stated earlier, our sample is biased against highly inclined sources. Estimates have been made for the inclination of some of these sources based on other observations. Using millimeter CO maps, Simon et al. (2000) fit an inclination angle of 303° for BP Tau, 562° for GM Aur and 521° for LkCa 15 and Qi et al. (2003) derived an inclination angle of 575° for LkCa 15. The measured radii for the two geometric models are given in Table 6. The model uncertainty is given for both the uncertainty in the data (scatter and 0.05 systematic component) and for the uncertainty in the K band excess, .
| Uniform Disk | Ring | |||||||||
|---|---|---|---|---|---|---|---|---|---|---|
| Source | Radius | Radius | Radius | Width | Radius | Width | ||||
| (mas) | (mas) | (AU) | (AU) | (mas) | (mas) | (mas) | (AU) | (AU) | (AU) | |
| BP Tau | 0.880 | 0.120 | 0.123 | 0.017 | 0.595 | 0.043 | 0.090 | 0.083 | 0.006 | 0.013 |
| DG Tau | 1.505 | 0.615 | 0.211 | 0.086 | 1.015 | 0.060 | 0.415 | 0.142 | 0.008 | 0.058 |
| GM Aur | 2.320 | 0.180 | 0.325 | 0.025 | 1.580 | 0.003 | 0.240 | 0.221 | 0.001 | 0.034 |
| LkCa 15 | 1.025 | 0.045 | 0.143 | 0.006 | 0.710 | 0.020 | 0.035 | 0.099 | 0.003 | 0.005 |
| RW Aur | 1.660 | 0.165 | 0.232 | 0.023 | 1.145 | 0.015 | 0.115 | 0.160 | 0.002 | 0.016 |
5 Discussion
Previous studies of young stellar objects with infrared interferometry and disk modeling have argued that the resolved component traces emission from the inner edge of the disk (Millan-Gabet, Schloerb, and Traub, 2001; Tuthill et al., 2001; Akeson et al., 2002). On the theoretical side, disk models have been proposed in which the gas component is optically thin, and the infrared emission of the inner disk is dominated by emission at the radius where the dust sublimates (Natta et al., 2001; Dullemond, Dominik, and Natta, 2001; Muzerolle et al, 2003). In some high accretion cases, the emission from the gas may contribute to the infrared emission and therefore to the measured visibility as discussed by Akeson et al. (2005). Najita, Carr, & Mathieu (2003) observed fundamental CO emission from two stars in our sample and derived inner radii for the gas emission of 0.043 AU for BP Tau and 0.093 AU for LkCa 15. The corresponding ring radii from our data are 0.083 AU (BP Tau) and 0.099 AU (LkCa 15). As we have not accounted for possible inclination effects, this is consistent with some gas being present within the inner dust radius.
Several groups have recently worked on the dust sublimation radius in models of circumstellar disks. Monnier & Millan-Gabet (2002) considered the case of no backwarming of the grains (i.e. an optically thin ring), which represents the lower limit to the dust sublimation radius. Dullemond, Dominik, and Natta (2001) developed a physical model for irradiated dust disks, including heating within the disk, and examined the vertical extent of the inner rim. Muzerolle et al (2003) and D’Alessio et al. (2004) extended this model to include the heating due to the accretion shocks. In each of these 3 models, the dust sublimation radius can be parameterized as
| (1) |
where Tdust is the dust sublimation temperature. To calculate the numerical factor we used the dust absorption efficiencies and geometric factors given in each paper as appropriate for T Tauri stars. The values of are 0.047, 0.072 and 0.069 respectively for Monnier & Millan-Gabet (2002); Dullemond, Dominik, and Natta (2001); Muzerolle et al (2003). A somewhat different approach was taken by Whitney et al. (2004) who used a varied grain size model and iteratively solved for the dust sublimation radius in their Monte Carlo radiative transfer disk models. They parameterize Rdust as a function of the stellar radius and temperature, which we converted to luminosity and temperature to compare to the previously discussed models. The luminosity dependence is the same, but the temperature exponent in Whitney et al. (2004) is -2.085 and there is a small dependence on the stellar temperature (R T). To compare this model with the others, we use a single stellar temperature (4500 K) but this introduces only a few percent error. We calculated Rdust for each of these models; with the result that the Monnier & Millan-Gabet (2002) model delineates the lower bound for Rdust as a function of luminosity, while Whitney et al. (2004) traces the upper bound. We note that values of Rdust predicted by the optically thick Dullemond, Dominik, and Natta (2001) and Muzerolle et al (2003) models are within 10% of the Whitney et al. (2004) values for the luminosity range of these sources, and we therefore use the Monnier & Millan-Gabet (2002) (hereafter, optically thin) and Whitney et al. (2004) (hereafter, optically thick) models to represent the range of possible Rdust. In these models, the optically thin and thick designations refer only to the properties of the disk inner rim; in both models, only optically thin material is present interior to the dust sublimation radius. Based on the results of the Monnier et al. (2005) sample of Herbig stars and the Muzerolle et al (2003) sample of T Tauri stars, we use example dust sublimation temperatures of 1000 and 1500 K.
We compare our measured ring radii to Rdust using the combined stellar and accretion luminosities following Muzerolle et al (2003). Accretion luminosities can be difficult to determine for T Tauri stars and estimates for individual sources can have a wide range from different methods. For consistency, we use a derivation of the accretion luminosity from Hartmann et al. (1998),
| (2) |
where the numerical factor of 0.8 assumes dissipation of accretion energy as material falls freely in along the stellar magnetosphere. The mass accretion rate, stellar mass and stellar radius for each source are taken from Table 1. For DG Tau, which has the highest accretion rate in the sample, we used the accretion luminosity of 2.8 L⊙ from White & Hillenbrand (2004). For the other sources, the derived accretion luminosities are 0.13, 0.12, 0.03 and 0.62 L⊙ for BP Tau, GM Aur, LkCa 15 and RW Aur respectively. We note that the stellar parameters for DG Tau used here (taken from White & Hillenbrand (2004) and based on spectroscopy observations) have a significantly higher stellar luminosity than the estimates (L⋆ = 1.4 L⊙, Johns-Krull & Valenti (2001) and L⋆ = 1.7 L⊙, Beckwith et al. (1990)) used for the previous analysis of the DG Tau data (Colavita et al., 2003). Given the variations in luminosity determinations, we assign uncertainties of 25% for the stellar luminosities and 50% for the accretion luminosities. The mass accretion rates in Table 1 agree to within these uncertainties with other estimates where available (Gullbring et al., 1998).
Figure 2 (left panel) shows the measured ring radius against the total (stellar and accretion) luminosity for the 5 KI sources with infrared excesses and 3 additional T Tauri sources from the PTI observations of Akeson et al. (2005). The solid lines represent the predicted dust sublimation radius from the optically thin model using Tdust of 1000 and 1500 K and the dotted lines are the optically thick model at the same two temperatures.
Before discussing the comparison, we note possible issues with some of the individual sources. For RW Aur, other groups have calculated higher stellar luminosities (e.g. 3.5 L⊙; Hartigan, Edwards, & Ghandour, 1995) than used here. The SED of GM Aur (the source with the largest measured radius) has led to models of large inner holes in the disk (Rice et al., 2003) and the resolved visibility could be due to scattering off an inner rim at several AU. However, these groups have calculated lower extinctions and no infrared excess (Rice et al., 2003; Schneider et al., 2003) using older infrared photometry (Cohen & Kuhi, 1979), whereas the 2MASS photometry used here is 0.3 magnitudes brighter in the near-infrared and we found a small but significant infrared excess in our fitting procedure (although as noted in §4.3, our variability estimate may be low). We are also using a spectral temperature of 4730 K from White & Ghez (2001) which is higher than the 4000 K used by previous studies. If there are substantial scattered light components in the central 50 mas (7 AU) for sources other than DG Tau then our radii will be overestimates of the disk radius. However, if the sources have non-face-on inclinations (outer disk inclination estimates are 30° to 60°), then the measured radii are an underestimate of the disk radius. Note that for the PTI sources (Akeson et al., 2005), three separate baselines were used and these sources were fit with an inclined ring.
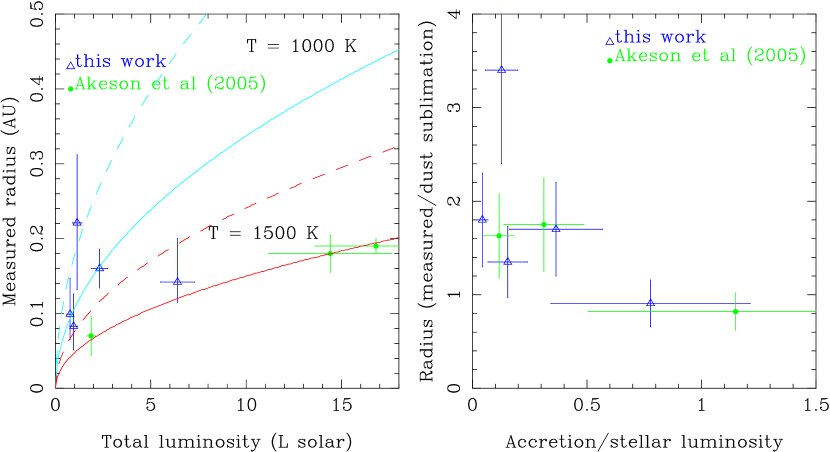
If the resolved visibilities do represent the inner disk radius, a single inner disk model (optically thick vs. optically thin) and dust sublimation temperature does not fit the sample here. If GM Aur is discounted, then the optically thin model (Figure 2, solid lines) with a range of Tdust from 1000 to 1500 K can fit the sample, but the optically thick inner rim does not match all the objects for this range of Tdust and would require substantially higher Tdust to fit the sample. Infrared interferometric sizes have been measured for a larger number of Herbig Ae/Be stars (intermediate mass young stars) which can be compared to our T Tauri sample. For the Herbig Ae and late Be objects, Millan-Gabet, Schloerb, and Traub (2001) and Eisner et al. (2003) found near-infrared disk sizes consistent with an inner disk edge at the dust sublimation radius set by direct exposure to radiation from the central star; while the early Be objects have near-infrared disk sizes which are relatively smaller, implying that some material is present interior to the dust sublimation radius (Monnier & Millan-Gabet, 2002; Eisner et al., 2004; Monnier et al., 2005). The Monnier et al. (2005) Herbig study used the Monnier & Millan-Gabet (2002) dust sublimation (referred to here as the optically thin model, f=0.047 in Eq. 1) and found sizes consistent with dust sublimation temperatures of 1000 to 1500 K, in general agreement with our T Tauri results. Accretion luminosities were not included in the Herbig comparison, but the properties of Herbig stars can be modeled with low accretion rates ( M⊙/yr; e.g. Muzerolle et al, 2004) which would result in very low accretion luminosities compared to their stellar luminosities.
Although the sample in this paper is small with substantial uncertainties in the individual sources, a range of inner dust disk properties is suggested by these results. In the right panel of Figure 2 we explore the discrepancy of the models by plotting Rmeasured/Rdust vs. Laccretion/Lstar, where Rdust is the mean of the two models in the left panel and the error bar is the range between the optically thin and thick models. The sources with low accretion to stellar ratios generally have radius ratios larger than 1 (GM Aur has the highest radius ratio) while the sources with roughly equal accretion and stellar luminosities have radius ratios near 1. If the accretion rate is a proxy for age in young stellar systems (see e.g. Hartmann et al., 1998), this range might be evolutionary in nature. For example, work by Clarke et al. (2001) modeling the interaction of photoevaporation and accretion has shown that the inner disk can dissipate before the outer disk. Observations of more sources are needed to further explore this possibility.
References
- (1)
- Akeson et al. (2000) Akeson, R. L., Ciardi, D. R., van Belle, G. T., Creech-Eakman, M. J., and Lada, E. A. 2000, ApJ, 543, 313, Paper 1
- Akeson et al. (2002) Akeson, R. L., Ciardi, D. R., van Belle, G. T., & Creech-Eakman, M. J. 2002, ApJ, 566, 1124
- Akeson et al. (2005) Akeson, R. L., Walker, C.H., Wood, K., Esiner, J.A., Scire, E., Penprase, B., Ciardi, D. R., van Belle, G. T., Whitney, B., and Bjorkman, J.E., 2005, ApJ, 622, 440
- Beckwith et al. (1990) Beckwith, S. V. W., Sargent, A. I., Chini, R. S., & Guesten, R. 1990, AJ, 99, 924
- Boden et al. (1998) Boden, A. F., Colavita, M. M., van Belle, G. T., and Shao, M. 1998, SPIE proceedings, 3350, 872
- Bouvier et al. (1988) Bouvier, J., Bertout, C., & Bouchet, P. 1988, A&AS, 75, 1
- Calvet, Hartmann, & Strom (1997) Calvet, N., Hartmann, L., & Strom, S. E. 1997, ApJ, 481, 912
- Calvet & Gullbring (1998) Calvet, N. & Gullbring, E. 1998, ApJ, 509, 802
- Chen et al. (1990) Chen, W. P., Simon, M., Longmore, A. J., Howell, R. R., & Benson, J. A. 1990, ApJ, 357, 224
- Chen et al. (1992) Chen, W. P., Howell, R. R., Simon, M., & Benson, J. A. 1992, ApJ, 387, L43
- Clarke et al. (2001) Clarke, C. J., Gendrin, A., & Sotomayor, M. 2001, MNRAS, 328, 485
- Cohen & Kuhi (1979) Cohen, M. & Kuhi, L. V. 1979, ApJS, 41, 743
- Colavita et al. (1999) Colavita M. M. et al 1999, ApJ, 510, 505
- Colavita & Wizinowich (2003) Colavita, M. M., & Wizinowich, P. L. 2003, Proc. SPIE, 4838, 79
- Colavita et al. (2003) Colavita, M., et al. 2003, ApJ, 592, L83
- D’Alessio et al. (2004) D’Alessio, P., Calvet, N., Hartmann, L., Muzerolle, J., & Sitko, M. 2004, IAU Symposium, 221, 403
- Dullemond, Dominik, and Natta (2001) Dullemond, C.P., Dominik, C. and Natta, A., 2001, ApJ, 560, 957
- Eisner et al. (2003) Eisner, J. A., Lane, B. F., Akeson, R. L., Hillenbrand, L. A., & Sargent, A. I. 2003, ApJ, 588, 360
- Eisner et al. (2004) Eisner, J.A., Lane B.F., Hillenbrand, L.A., Akeson, R.L. & Sargent, A.I., 2004, ApJ, 613, 1049
- Eisner et al. (2005) Eisner, J.A., Hillenbrand, L.A., White, R.J. Akeson, R.L. & Sargent, A.I., 2005, ApJ, 623, 952
- Folha & Emerson (1999) Folha, D. F. M., & Emerson, J. P. 1999, A&A, 352, 517
- Gahm et al. (1999) Gahm, G. F., Petrov, P. P., Duemmler, R., Gameiro, J. F., & Lago, M. T. V. T. 1999, A&A, 352, L95
- Ghez et al. (1993) Ghez, A. M., Neugebauer, G., & Matthews, K. 1993, AJ, 106, 2005
- Ghez et al. (1997) Ghez, A. M., White, R. J., & Simon, M. 1997, ApJ, 490, 353
- Gullbring et al. (1998) Gullbring, E., Hartmann, L., Briceno, C., & Calvet, N. 1998, ApJ, 492, 323
- Gullbring et al (2000) Gullbring, E., Calvet, N., Muzerolle, J., & Hartmann, L. 2000, ApJ, 544, 927
- Hartigan, Edwards, & Ghandour (1995) Hartigan, P., Edwards, S., & Ghandour, L. 1995, ApJ, 452, 736
- Hartmann et al. (1998) Hartmann, L., Calvet, N., Gullbring, E., & D’Alessio, P. 1998, ApJ, 495, 385
- Herbig et al. (1986) Herbig, G. H., Vrba, F. J., & Rydgren, A. E. 1986, AJ, 91, 575
- Johns-Krull & Valenti (2001) Johns-Krull, C. M., & Valenti, J. A. 2001, ApJ, 561, 1060
- Kenyon and Hartmann (1995) Kenyon, S.J. and Hartmann, L., 1995, ApJS, 101 117
- Kitamura et al. (1996) Kitamura, Y., Kawabe, R., & Saito, M. 1996, ApJ, 465, L137
- Krist et al. (1997) Krist, J. E., Burrows, C. J., Stapelfeldt, K. R., & WFPC2 Id Team 1997, Bulletin of the American Astronomical Society, 29, 1215
- Kurucz (1994) Kurucz, CD-ROM 19, Solar Abundance Model Atmospheres for 0,1,2,4,8 km/s (Cambridge:SAO)
- Lada & Wilking (1984) Lada, C. J., & Wilking, B. A. 1984, ApJ, 287, 610
- Landolt (1983) Landolt, A.U., 1983, AJ, 88, 439
- Leinert et al. (1991) Leinert, C., Haas, M., Mundt, R., Richichi, A., & Zinnecker, H. 1991, A&A, 250, 407
- Leinert et al. (1993) Leinert, C., Zinnecker, H., Weitzel, N., Christou, J., Ridgway, S. T., Jameson, R., Haas, M., & Lenzen, R. 1993, A&A, 278, 129
- Leinert et al. (2004) Leinert, C., et al. 2004, A&A, 423, 537
- Lejeune et al. (1997) Lejeune, T., Cuisinier, F., & Buser, R. 1997, A&AS, 125, 229
- Malbet et al. (1998) Malbet, F. et al. 1998, ApJ, 507, L149
- Metchev et al. (2004) Metchev, S. A., Hillenbrand, L. A., & Meyer, M. R. 2004, ApJ, 600, 435
- Meyer et al. (1997) Meyer, M. R., Beckwith, S. V. W., Herbst, T. M., & Robberto, M. 1997, ApJ, 489, L173
- Millan-Gabet et al. (1999) Millan-Gabet, R., Schloerb, F. P., Traub, W. A., Malbet, F., Berger, J. P., & Bregman, J. D. 1999, ApJ, 513, L131
- Millan-Gabet, Schloerb, and Traub (2001) Millan-Gabet, R., Schloerb, F. P., and Traub, W. A, 2001, ApJ, 546, 358
- Monnier & Millan-Gabet (2002) Monnier, J. D. & Millan-Gabet, R. 2002, ApJ, 579, 694
- Monnier et al. (2005) Monnier, J.D. et al., 2005, ApJ, 624, 832
- Mundt et al. (1983) Mundt, R., Walter, F. M., Feigelson, E. D., Finkenzeller, U., Herbig, G. H., & Odell, A. P. 1983, ApJ, 269, 229
- Mundy, Looney, & Welch (2000) Mundy, L. G., Looney, L. W., & Welch, W. J. 2000, Protostars and Planets IV, 355
- Muzerolle et al (2003) Muzerolle, J., Calvet, N., Hartmann, L., & D’Alessio, P. 2003, ApJ, 597, L149
- Muzerolle et al (2004) Muzerolle, J., D’Alessio, P., Calvet, N., & Hartmann, L. 2003, ApJ, accepted
- Najita, Carr, & Mathieu (2003) Najita, J., Carr, J. S., & Mathieu, R. D. 2003, ApJ, 589, 931
- Natta et al. (2001) Natta, A., Prusti, T., Neri, R., Wooden, D., Grinin, V.P., and Mannings, V., 2001, å, 371, 186
- Osterloh & Beckwith (1995) Osterloh, M., & Beckwith, S. V. W. 1995, ApJ, 439, 288
- Qi et al. (2003) Qi, C., Kessler, J. E., Koerner, D. W., Sargent, A. I., & Blake, G. A. 2003, ApJ, 597, 986
- Rice et al. (2003) Rice, W. K. M., Wood, K., Armitage, P. J., Whitney, B. A., & Bjorkman, J. E. 2003, MNRAS, 342, 79
- Rydgren & Vrba (1983) Rydgren, A. E., & Vrba, F. J. 1983, AJ, 88, 1017
- Rydgren & Vrba (1981) Rydgren, A. E., & Vrba, F. J. 1981, AJ, 86, 1069
- Sartoretti et al. (1998) Sartoretti, P., Brown, R. A., Latham, D. W., & Torres, G. 1998, A&A, 334, 592
- Schneider et al. (2003) Schneider, G., Wood, K., Silverstone, M. D., Hines, D. C., Koerner, D. W., Whitney, B. A., Bjorkman, J. E., & Lowrance, P. J. 2003, AJ, 125, 1467
- Simon et al. (1995) Simon, M., et al. 1995, ApJ, 443, 625
- Simon et al. (1996) Simon, M., Holfeltz, S. T., & Taff, L. G. 1996, ApJ, 469, 890
- Simon et al. (1999) Simon, M., Beck, T. L., Greene, T. P., Howell, R. R., Lumsden, S., & Prato, L. 1999, AJ, 117, 1594
- Simon et al. (2000) Simon, M., Dutrey, A., & Guilloteau, S. 2000, ApJ, 545, 1034
- Stassun et al. (2001) Stassun, K. G., Mathieu, R. D., Vrba, F. J., Mazeh, T., & Henden, A. 2001, AJ, 121, 1003
- Tuthill et al. (2001) Tuthill, P. G., Monnier, J. D., & Danchi, W. C. 2001, Nature, 409, 1012
- Unruh et al. (2004) Unruh, Y. C., et al. 2004, MNRAS, 348, 1301
- Walter et al. (1988) Walter, F.M., Brown, A., Mathieu, R.D., Myers, P.C. & Vrba, F.J. 1988, AJ, 96, 297
- Whitney et al. (2004) Whitney, B. A., Indebetouw, R., Bjorkman, J. E., & Wood, K. 2004, ApJ, 617, 1177
- White & Ghez (2001) White, R. J. & Ghez, A. M. 2001, ApJ, 556, 265
- White & Hillenbrand (2004) White, R. J., & Hillenbrand, L. A. 2004, ApJ, 616, 998
- Wichmann et al. (1996) Wichmann, R., et al. 1996, A&A, 312, 439
- Wood et al. (2002) Wood, K., Lada, C. J., Bjorkman, J. E., Kenyon, S. J., Whitney, B., & Wolff, M. J. 2002, ApJ, 567, 1183