Constraining the Distribution of L- T-Dwarfs in the Galaxy111Based on observations made with the NASA/ESA Hubble Space Telescope, obtained from the Data Archive at the Space Telescope Science Institute, which is operated by the Association of Universities for Research in Astronomy, Inc., under NASA contract NAS 5-26555.
Abstract
We estimate the thin disk scale height of the Galactic population of L- T-dwarfs based on star counts from deep parallel fields from the Hubble Space Telescope. From these observations, we have identified candidate L- T-dwarfs based on their color and morphology. By comparing these star counts to a simple Galactic model, we estimate the scale height to be pc that is consistent with the increase in vertical scale with decreasing stellar mass and is independent of reddening, color-magnitude limits, and other Galactic parameters. With this refined measure, we predict that less than M⊙ of the Milky Way can be in the form L- T-dwarfs, and confirm that high-latitude, galaxy surveys which use the -band dropout technique are 97-100% free of L- T-dwarf interlopers.
Subject headings:
stars: low-mass, brown dwarfs — Galaxy: structure — Galaxy: stellar content1. Introduction
The method of counting stars to infer the shape and size of the Galaxy is as old as astronomy itself. Earliest efforts using this technique were famously flawed as they often relied on insufficient data or wholly incorrect assumptions (eg. Herschel, 1785; Kapteyn, 1922). Aided by advanced technology, Bahcall & Soneira (B&S; 1980, 1981) demonstrated that the true power of star counts is realized when they are compared to simulations of the fundamental equation of stellar statistics (von Seeliger, 1898). The B&S method relies heavily on the assumed luminosity functions and density distributions, and has been a standard method for many subsequent studies.
The Galaxy is traditionally characterized by having a Population I disk and Population II spheroid. In a series of studies of the exponential disk, Gilmore & Reid (1983) and Gilmore (1984) established the need for a thick and thin disk whose scale heights are inversely proportional to the masses of the studied stars (see Table 1 in Siegel et al., 2002). The standard description of the Galactic halo is a de Vaucouleur or power-law profile, while the Besançon flattened spheroid with (Bahcall & Soneira, 1984; Robin, Reylé, & Crézé, 2000; Larsen & Humphreys, 2003; Robin et al., 2003) being the currently favored parameters. Thorough discussions of star counts and their relevance to Galactic structure are given in the Annual Reviews by Bahcall (1986), Gilmore, Wyse, & Kuijken (1989), and Majewski (1993).
Many of the Galactic models and the majority of the literature examine on relatively luminous dwarf and/or giant stars and rarely address sub-stellar objects. The discovery of the first extra-solar, sub-stellar object, Gliese 229B (Nakajima et al., 1995; Oppenheimer et al., 1995) motivated the creation of the L and T spectral classes. With surface temperatures ranging from 750–2200 K (Burgasser, 1999), the L- T-dwarfs can contaminate searches for , -band dropout objects (Yan, Windhorst, & Cohen, 2003) by mimicking the extremely red broad-band colors. This effect has remained largely unquantified due to insufficient knowledge of the L- T-dwarf IMF, Galactic distribution, and local number density. Previous work on their IMF and local number density (Reid et al., 1999; Chabrier, 2001, 2002; Liu et al., 2002) has suffered from limited statistics. With the deep imaging of Hubble Space Telescope (HST) Advanced Camera for Surveys (ACS) parallel fields, this study increases the number of faint dwarfs by adding to the growing list. Little work has been done on the scale height of L- T-dwarfs; Liu et al. (2002) and Pirzkal et al. (2005) estimated 100–400 pc as based on a single object or a 3–4 objects in a single field. Therefore the primary goal of this work is to estimate the scale height of the L- T-dwarf population by comparing the surface densities from the ACS parallel fields to the Galactic structure models.
2. Observations
The L- T-dwarf candidates were selected from HST/ACS parallel fields covering a broad range in Galactic latitudes and longitudes (see Table 1). All ACS fields have at least three independent exposures in F775W (SDSS-) and F850LP (SDSS-) with a total exposure time of 2–10 ks per bandpass. All fields are 90% complete at (AB)26.0 mag (Yan & Windhorst, 2004a). We adopt the AB magnitude system (Oke & Gunn, 1983).
After combining the individual ACS frames into final stacks using the PyRAF-based script multidrizzle (Koekemoer et al., 2002), the SExtractor package (Bertin & Arnouts, 1996) was used in double-input mode to perform the matched-aperture photometry. The F850LP stack was used to define the optimal apertures for the flux measurements in both stacks. For source detection, we used a 55 Gaussian smoothing kernel with a FWHM of 2.0 pixels, which is approximately the same as the FWHM of the ACS point-spread function (PSF) on both image stacks. We used total magnitudes (corresponding to the MAG_AUTO option in SExtractor) for the photometry and adopted the zero points published in HST ACS Instrument Science Report (De Marchi et al., 2004).
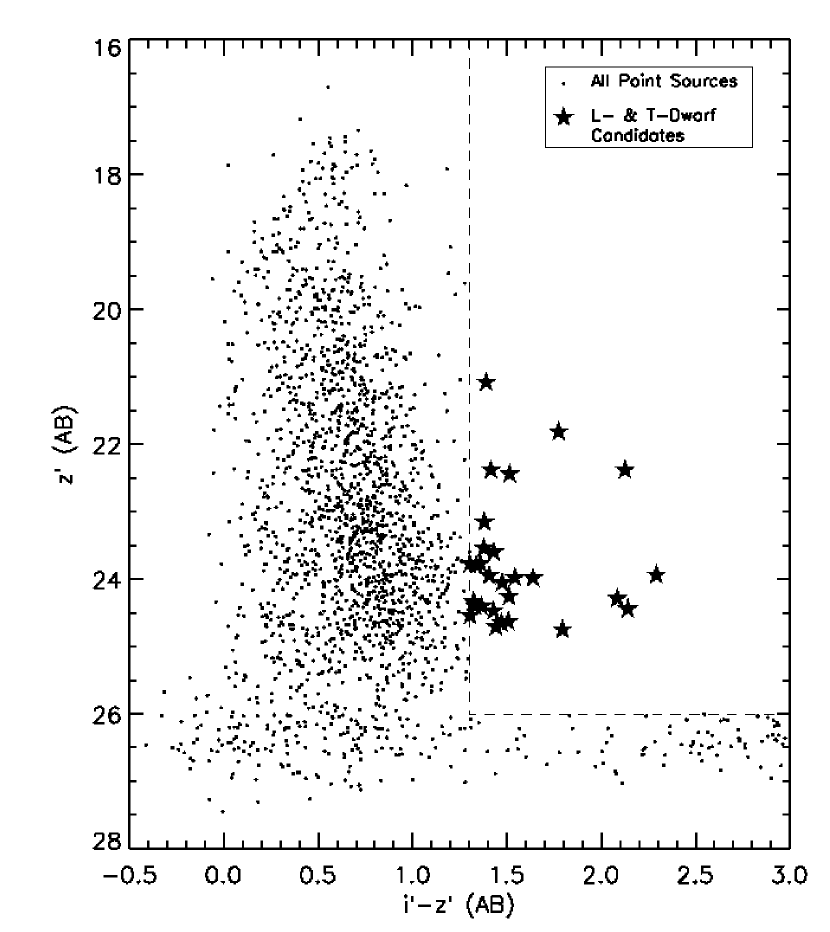
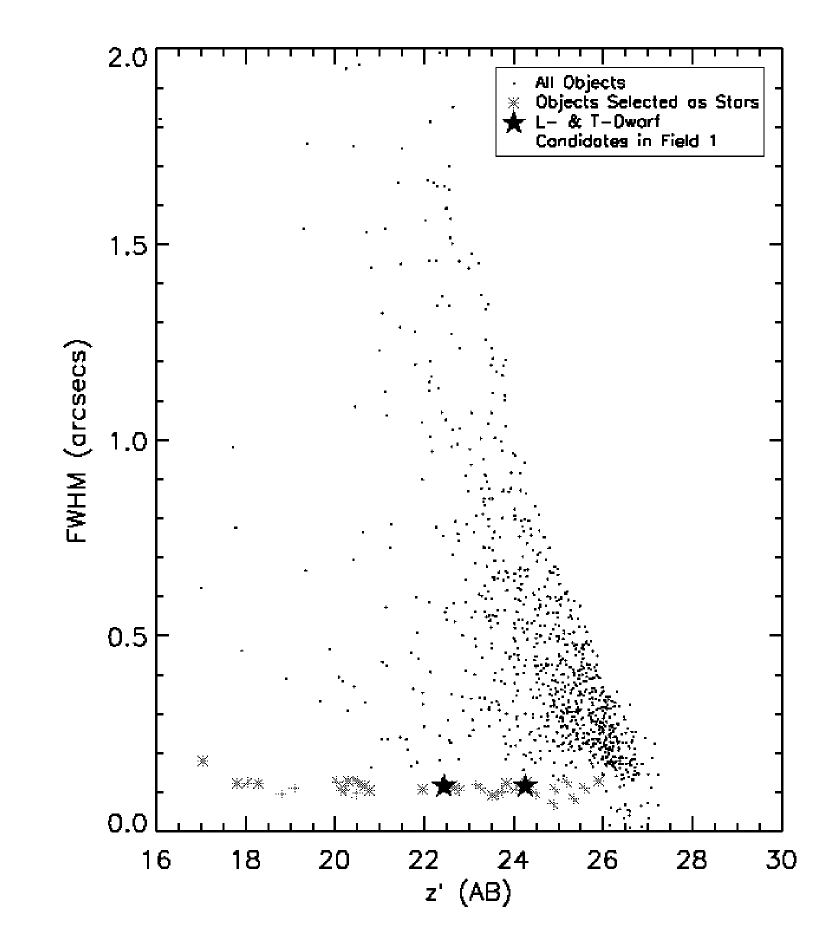
As a cursory selection, all objects with 1.3 mag and 26.0 mag were considered. 1 is the color-magnitude diagram for all point sources detected in all fields. Dashed lines indicate the imposed color-magnitude limits and the large, filled stars represent the candidate L- T-dwarfs. For the five fields for which the F475W (SDSS-) band was available, we required candidates to have 0 mag. Objects near the detector edges were not considered, yielding an effective area of 9 arcmin2 per ACS field. Extended objects were eliminated from the analysis by using the FWHM parameter of SExtractor. In 2, we plot the FWHM as a function of apparent magnitude for each object in Field 1 as small dots. The locus of points at FWHM and mag (hereafter the “stellar locus”), represented as asterisks, are the unresolved objects with the minimum possible FWHM. In addition to the above color-magnitude criterion, we required all L- T-dwarf candidates to lie within this locus. Sources of contamination to these criteria are discussed in § 4.1.
| Field | Number | ||
| No. | (deg) | (deg) | (per 9 arcmin2) |
| 1 | 115.018 | 46.681 | 2 |
| 2 | 164.056 | 75.750 | 1 |
| 3 | 169.188 | 59.664 | 0 |
| 4 | 279.934 | 19.990 | 3 |
| 5 | 165.876 | 36.396 | 0 |
| 6 | 280.782 | 68.293 | 0 |
| 7 | 113.107 | 28.548 | 2 |
| 8 | 293.996 | 41.466 | 0 |
| 9 | 316.829 | 40.490 | 1 |
| 10 | 105.103 | 7.075 | 11 |
| 11 | 298.138 | 13.885 | 6 |
| 12 | 92.666 | 46.378 | 1 |
| 13 | 70.106 | 62.876 | 0 |
| 14 | 251.327 | 41.444 | 0 |
| 15 | 216.142 | 54.561 | 1 |
Typically Galactic structure studies examine star counts from one or many shallow fields with large surveyed areas (eg. Siegel et al., 2002; Larsen & Humphreys, 2003). Thus the data of the 2MASS (Burgasser, 1999; Kirkpatrick et al., 1999), DENIS (Delfosse, 1999), and/or SDSS (Strauss et al., 1999; Tsvetanov et al., 2000; Hawley et al., 2002) are natural choices to study the Galactic distribution of the L- T-dwarfs. These surveys have significantly more detection area than our HST dataset and their L- T-dwarfs are typically closer to the Sun than pc or 1 disk scale height. Therefore to avoid extrapolating the vertical scale height beyond this distance, we chiefly analyzed the HST dataset where all sample stars are likely more distant than 1 -folding length.
3. The Simple Galactic Model
The Galactic structure models were made by distributing 1010 points according to an exponential disk that was motivated by the light profiles of edge-on galaxies (de Grijs, Peletier, & van der Kruit, 1996): , where = pc is the radial scale length found by Porcel et al (1998), =0.12 pc-3 is the local space density L- T-dwarfs taken from Chabrier (2002), and =8 kpc and =15 pc (Yamagata & Yoshii, 1992) are the solar radius and height, respectively. The vertical scale height, , is the free parameter and found by minimizing the squared difference between the number counts from the model and the HST data. Altering the assumed coordinates of the Sun and the radial scale length have little effect on the vertical scale height estimate. To generate absolute magnitudes, we adopted the -band luminosity function of Cruz et al. (2003) and the colors of Hawley et al. (2002) over the appropriate range of spectral type.
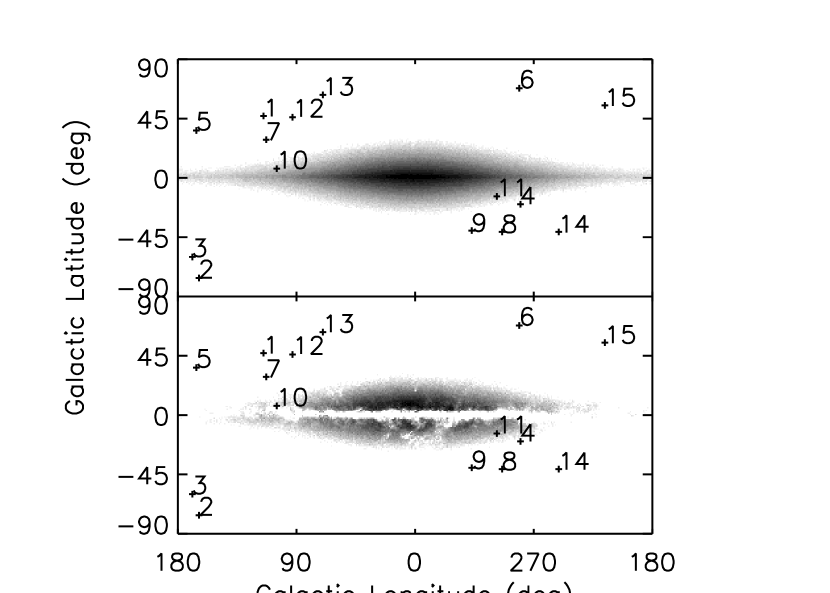
The effects of interstellar extinction were included into the model using the COBE dust maps of Schlegel et al. (1998) in two ways. First, we assumed that each point was located beyond the dust, establishing a lower bound on the model counts. Alternatively, an upper bound is reached by assuming that the Galaxy has no dust whatsoever. Since an overwhelming majority of the dust is localized to (see 3) and only two of our observed ACS fields are in this range, either approach yielded the same result within the uncertainties, therefore we adopted the third method for simplicity. 3 is a representative realization the model with a scale height of pc, the with locations of the observed fields are indicated with plus signs.
The canonical disk/spheroid Galaxy likely has additional components (Bahcall, 1986), the models used here did not contain any contribution from the Galactic bulge or a two-component disk (Gilmore & Reid, 1983; Gilmore, 1984) for the following reasons. First, a bulge distribution was not modeled since its radius is 1–2 kpc or 7–14, and every field is well beyond 14 of the Galactic center, hence we do not require a bulge component in the model. Second, this sample contains only L- T-dwarfs which are likely within 1000 pc (based on the luminosity function) of the Sun. Since the thick disk has a scale height of 1000 pc, we expect the star counts to be dominated by a single disk population. Moreover, With only candidates the models and analyses must remain simple and straightforward.
4. Analysis
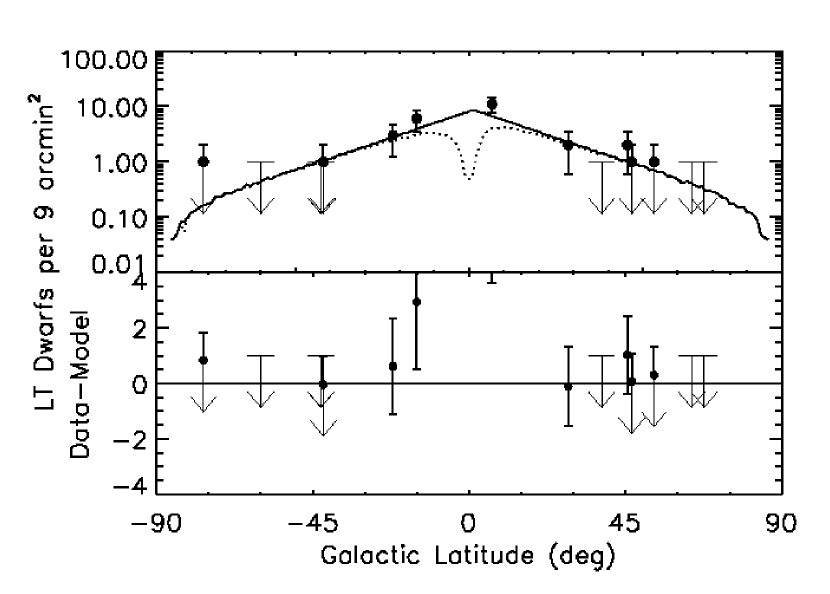
Despite this work utilizing the largest dataset of L- T-dwarfs compiled from HST observations, the star counts remain very sparse requiring a simple analysis scheme. Using the grid of Monte Carlo models described in § 3, we sought the scale height which minimizes the squared difference between the integrated star counts of the model and those from the HST/ACS dataset. For the fields where no L- T-dwarf candidates were found, we assumed an upper limit of one object (per field) could have been detected and perform this minimization technique simultaneously on all fields. This procedure yielded a vertical scale height of pc. In the upper panel of 4, we plot the modeled surface density averaged over Galactic longitude as a function of Galactic latitude as computed from the model with a scale height of pc, with the HST data points from Table 1 over-plotted for comparison. The residuals in the lower panel clearly demonstrate that the model with a scale height of pc reproduces the HST star counts for where dust extinction is minimal.
4.1. Sources of Contamination
While all L- T-dwarf candidates were systematically found by color and FWHM criteria, each was visually confirmed as a point source. However, the color-magnitude rules outlined in § 2 potentially find three classes of contaminates:
(1) The primary motivation of this study is to reliably correct the , -band dropout galaxy surveys for interloping L- T-dwarfs (Yan et al., 2002; Yan, Windhorst, & Cohen, 2003; Yan & Windhorst, 2004a, b). Since our method is similar to the -band dropout technique, we expect possible contamination to the star counts from the galaxies. In a recent study of the Hubble Ultra-Deep Field (HUDF), Yan & Windhorst (2004b) find 108 -band dropouts using the 1.3 mag color selection. Their sample has a median -band magnitude of 28.5 mag, and contains only three objects brighter than our limit of 26.0 mag. Each of these three objects is considerably extended and could not be mistaken for a point-source. Since the majority of unresolved galaxies will be 2.5 mag too faint, we conclude their contamination in our sample must be negligible.
(2) Another known source of possible contaminates comes from dusty, elliptical galaxies with redshifts , whose 4000 Å break occurs between the and bands (Yan, Windhorst, & Cohen, 2003). With a typical color of 1.0 mag, many of these objects would appear too blue in the absence of extreme internal reddening. Moreover the visual identification confirms only point-like objects populate the “stellar locus” in the lower left of 2. Hence, extended elliptical galaxies could not grossly corrupt our sample.
(3) In addition to the above extragalactic sources, we anticipated contamination from galactic M-dwarfs for two different reasons. First, the color criterion of mag was primarily motivated by the galaxy surveys and is 0.5 mag too blue (Hawley et al., 2002) to have included only L- T-dwarfs. When we repeated the above analysis for 1.8 mag (Hawley et al., 2002) the star counts were reduced by 50% and the inferred vertical scale height was pc. While there is a significant contribution from late M-dwarfs, the vertical scale height was unaffected by the 0.5 mag color difference. Second, an appreciably reddened M-dwarf could have an color of an unreddened L- or T-dwarf. This scenario requires considerable reddening, only the two fields with have mag. This effect could account these fields lying more than above the best-fit line in 4, however we cannot be certain without more broad-band filters or spectroscopy. We investigated this effect’s contribution by removing the two suspect fields and repeated the analysis. While this procedure reduced the observed star counts by 50%, it resulted in a vertical scale height of 360180 pc. Without further observations it is difficult to definitively remove highly reddened M-dwarfs, however their contribution should not grossly affect our main goal.
5. Discussion
Using a suite of Monte Carlo simulations and HST/ACS parallel fields, we find a vertical scale height of pc for the L- T-dwarf population based on faint candidates. This estimated scale height is consistent with the known trend of increasing scale height with decreasing stellar mass, independent of reddening, color selections, and other Galactic parameters and is within the uncertainties of and is largely a refinement of previous work (Liu et al., 2002; Pirzkal et al., 2005). Using our value of the scale height, and the parameters given in § 3, we predict a total of L- T-dwarfs and a total mass of M⊙ in the Milky Way.
This improved understanding of the L- T-dwarf Galactic distribution will aide high-redshift surveys in better estimating the contamination of L- T-dwarfs in their samples. In the recent HUDF pointed at =(3h32m390,–27°47’291) and a depth of 29 mag, we predict 2 L- T-dwarfs in its 11 arcmin2 field of view, which has been confirmed by Pirzkal et al. (2005) who have spectroscopically identified three L- T-dwarfs. We confirm that Galactic L- T-dwarfs cannot significantly corrupt the surveys in high-latitude fields (the HUDF for example), however low-latitude fields will find a modest number of interloping L- T-dwarfs. With only candidates from fields, our statistics remain sparse and ideally require further observations.
References
- Bahcall (1986) Bahcall, J. N. 1986, ARA&A, 24, 577
- Bahcall & Soneira (1980) Bahcall, J. N. & Soneira, R. M. 1980, ApJS, 44, 73
- Bahcall & Soneira (1981) Bahcall, J. N. & Soneira, R. M. 1981, ApJ, 246, 122
- Bahcall & Soneira (1984) Bahcall, J. N. & Soneira, R. M. 1984, ApJS, 55, 67
- Bertin & Arnouts (1996) Bertin, E. & Arnouts, S. 1996, A&AS, 117, 393
- Burgasser et al. (2003) Burgasser, A., Kirkpatrick, D., Burrows, A., Liebert, J., Reid. N., Gizis, J., McGovern, M., & Prato, L. 2003, ApJ, 592, 1186
- Burgasser (1999) Burgasser, A. J., et al. 1999, ApJ, 522, L65
- Chabrier (2001) Chabrier, G. 2001, ApJ, 554, 1274
- Chabrier (2002) Chabrier, G. 2002, ApJ, 567, 304
- Cruz et al. (2003) Cruz, K. C., Reid, I. N., Liebert, J., Kirkpatrik, J. D., Lowrance, P. J. 2003, AJ, 126, 2421
- de Grijs, Peletier, & van der Kruit (1996) de Grijs, R., Peletier, R., & van der Kruit, P. 1997, A&A, 327, 966
- Delfosse (1999) Delfosse, X., Tinney, C. G., Forveille, T., Epchtein, N., Borsenberger, J., Fouqué, P., Kimeswenger, S., & Tipène, D. 1999, A&AS, 135, 41
- De Marchi et al. (2004) De Marchi, G. et al. 2004, Detector Quantum Efficiency and Photometric Zero Points of the ACS, Instrument Science Report, (STScI, Baltimore)
- Gilmore (1984) Gilmore, G. 1984, MNRAS, 207, 223
- Gilmore & Reid (1983) Gilmore, G & Reid, N. 1983, MNRAS, 202, 1025
- Gilmore, Wyse, & Kuijken (1989) Gilmore, G., Wyse, R., & Kuijken, K. 1989, ARA&A, 27, 555
- Hawley et al. (2002) Hawley, S. et al. 2002,ApJ, 123, 3409
- Herschel (1785) Herschel W. 1785, RSPT, 75, 213
- Kapteyn (1922) Kapteyn, J. C. 1922, ApJ, 55, 302
- Kirkpatrick et al. (1999) Kirkpatrick, J. D., et al. 1999, ApJ, 519, 802
- Kirkpatrick (2000) Kirkpatrick, J. D. 2000, AJ, 120, 447
- Koekemoer et al. (2002) Koekemoer, A. M., Fruchter, A. S., Hook, R., & Hack, W. 2002 “The 2002 HST Calibration Workshop” Space Telescope Science Institute, 2002
- Larsen & Humphreys (2003) Larsen, J. A. & Humphreys, R. M. 2003, AJ, 125,1958
- Liu et al. (2002) Liu, M., Wainscoat, R., Martín, E. L., Barris, B., & Tonry, J. 2002, ApJ, 568, L107
- Majewski (1993) Majewski, S. R. 1993, ARA&A, 31, 575
- Nakajima et al. (1995) Nakajima, T., Oppenheimer, B. R., Kulkarni, S. R., Golimowski, D. A., Matthews, K., & Durrance, S. T. 1995, Nature, 378, 463
- Oke & Gunn (1983) Oke, J. B. & Gunn, J. E. 1983, ApJ, 266,713
- Oppenheimer et al. (1995) Oppenheimer, B. R., Kulkarni, S. R., Matthews, K., & Nakajima, T. 1995, Science, 270, 1478
- Porcel et al (1998) Porcel, C., Garzón, F., Jimenénez-Vicente, J., & Battaner, E. 1998, A&A, 330, 136
- Pirzkal et al. (2005) Pirzkal N., et al. 2005, ApJ, 622, 319
- Reid & Majewski (1993) Reid, I. N. & Majewski, S. R. 1993, ApJ, 409, 635
- Reid (2003) Reid, I. N. 2003, AJ, 126, 2449
- Reid et al. (1999) Reid, I. N., et al. 1999, ApJ, 521, 613
- Robin, Reylé, & Crézé (2000) Robin, A., Reylé, C., & Crézé M. 2000, A&A 359, 103
- Robin et al. (2003) Robin, A., Reylé, C., Derrière, S., & Picaud, S. 2003, A&A, 409, 523
- Schlegel et al. (1998) Schlegel, D. J., Finkbeiner, D. P., & Davis, M. 1998, AJ, 500, 525
- Siegel et al. (2002) Siegel, M. H., Majewski, S. R., Reid, I. N., & Thompson, I. B. 2002, ApJ, 578, 151
- Strauss et al. (1999) Strauss, M. A., et al. 1999, ApJ, 522, L61
- Tsvetanov et al. (2000) Tsvetanov, Z. I., et al. 2000, ApJ, 531, L61
- von Seeliger (1898) von Seeliger, H. 1898, Abh. Bayerische Akad. Wiss., Math.-Phys. KI, 19, 564
- Yan & Windhorst (2004a) Yan, H. & Windhorst, R. A. 2004a, ApJ, 600, L1
- Yan & Windhorst (2004b) Yan, H. & Windhorst, R. A. 2004b, ApJ, 612, L93
- Yan, Windhorst, & Cohen (2003) Yan, H., Windhorst, R. A., & Cohen S. H. 2003, ApJ, 585, L93
- Yan et al. (2002) Yan, H. et al. 2002, ApJ, 580, 725
- Yamagata & Yoshii (1992) Yamagata, T., & Yoshii, Y. 1992, AJ, 103, 117