An Observational Pursuit for Population III Stars in a Ly Emitter at =6.33 through Heii Emission11affiliation: Based on data collected at the Subaru Telescope, which is operated by the National Astronomical Observatory of Japan.
Abstract
We present a very deep near-infrared spectroscopic observation of a strong Ly emitter at , SDF J132440.6+273607, which we used to search for Heii1640. This emission line is expected if the target hosts a significant number of population III stars. Even after 42 ksec of integration with the Subaru/OHS spectrograph, no emission-line features are detected in the band, which confirms that SDF J132440.6+273607 is neither an active galactic nucleus nor a low- emission-line object. We obtained a 2 upper-limit of ergs s-1 cm-2 on the Heii1640 emission line flux, which corresponds to a luminosity of ergs s-1. This upper-limit on the Heii1640 luminosity implies that the upper limit on population III star-formation rate is in the range if population III stars suffer no mass loss, and in the range if strong mass loss is present. The non-detection of Heii in SDF J132440.6+273607 at may thus disfavor weak feedback models for population III stars.
1 INTRODUCTION
Population III stars, i.e., the first generation of stars, have been intensively investigated from the theoretical point of view. They are expected to have unique and distinct physical properties and to exhibit very different evolutionary processes compared with metal-enriched stars (e.g., Ezer & Cameron 1971; Fujimoto et al. 1990; Bromm et al. 1999; Nakamura & Umemura 2001; Abel et al. 2002; Omukai & Palla 2003). Recent progress in the observational studies on the cosmic reionization have greatly increased the interests in the population III stars, as a possible important ionization source (e.g., Haiman & Loeb 1997; Ciardi et al. 2003). Population III stars have also been investigated within the context of the chemical evolution of galaxies and quasars in their very early stages (e.g., Venkatesan et al. 2004; Matteucci & Pipino 2005). Given these theoretical interests, the detection and the observational investigation of population III stars will be one of the main concerns of observational astronomy in the next decade.
It should be noted that galaxies that contain a significant fraction of population III stars may have been already observed in the high- universe. Although the WMAP data suggest that the cosmic reionization occurred at (Bennett et al. 2003), this does not rule out the possibility of the existence of population III stars in the redshift range currently accessible (i.e., ). Indeed Scannapieco et al. (2003) calculated the evolution of population III stellar systems and showed that these objects may exist even at , depending on the fundamental parameters of population III stars such as the initial-mass function and outflow efficiency. Therefore it is of interest to search for observational signatures from population III stars in the currently known very high- galaxies.
Recently it has been recognized that the Heii1640 emission is a good tracer for population III stars (e.g., Tumlinson & Shull 2000; Oh et al. 2001; Schaerer 2002). The population III stellar clusters are expected to have very high effective temperature up to K (e.g., Ezer & Cameron 1971; Bromm et al. 2001) as a result of both their top-heavy mass function and of small opacity of their atmosphere, due to the lack of heavy elements. Therefore population III stars emit a large fraction of photons at eV, resulting in large regions of doubly ionized helium. Moreover, since the ionized gas around population III stars does not contain heavy elements which are efficient coolants, Heii is one of the main coolants and therefore the emissivity of Heii lines is strongly enhanced. Among the Heii lines, Heii1640 is very important because this transition does not suffer from resonant absorption effects. Schaerer (2003) showed that the rest-frame equivalent width of Heii1640 can reach as much as a few tens if a galaxy contains a large number of population III stars, which suggests that the detection of Heii1640 from population III stars at a high redshift may be feasible with current observational facilities (see also Tumlinson et al. 2003). Dawson et al. (2004) investigated the spectra of 17 Ly emitters (LAEs) at and found no Heii1640 signal, implying that population III stars should form at .
Motivated by these expectations, we performed a deep near-infrared spectroscopic observation of a recently discovered LAE in the Subaru Deep Field (SDF; Kashikawa et al. 2004), SDF J132440.6+273607 at (Nagao et al. 2004) to search for the signature of population III stars through Heii1640. In this Letter, we present the result of our observation and give some observational constraints on the presence of population III stars. We adopt a cosmology with (, , ) =(1.0, 0.3, 0.7) and = 70 km s-1 Mpc-1 throughout this Letter. We use the AB photometric system for the magnitude notation.
2 OBSERVATIONS
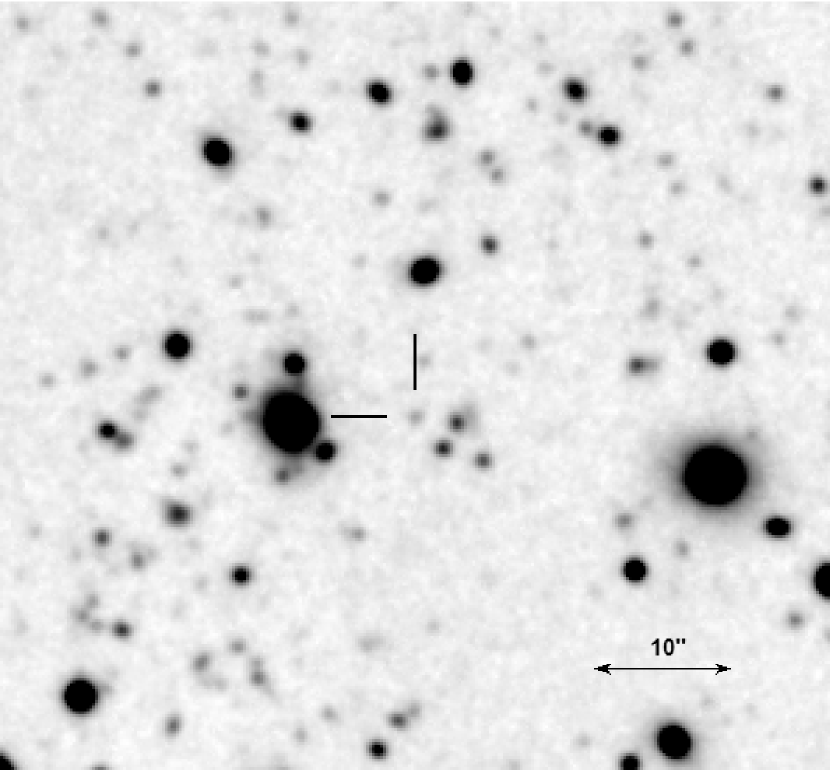
To search for population III stars through Heii1640, we carried out a deep near-infrared spectroscopic observation of a LAE at , SDF J132440.6+273607 (Nagao et al. 2004), by using the OH-airglow suppressor (OHS; Iwamuro et al. 2001) with the Cooled Infrared Camera and Spectrograph for OHS (CISCO; Motohara et al. 2002) installed on the Nasmyth focus of the 8.2m Subaru Telescope (Iye et al. 2004), on 22–24 April 2005 (UT). This object was selected because it shows a relatively large Ly luminosity (1.8 ergs s-1), high equivalent width [], and because it is close to a relatively bright object ( and 90 east from the target) that helps a secure acquisition of the target onto the slit. This object has also the advantage that the redshifted Heii1640 line does not fall on the wavelength of a strong OH-airglow line, which will be highly suppressed by OHS. The finding chart is shown in Figure 1. Thanks to the OH-airglow suppression technique, OHS can achieve a very high sensitivity level for -band spectroscopy. The spatial and spectral samplings are 0105 and 8.5 per pixel on the HAWAII 1K1K array. The -band spectra were acquired using a 095 slit with a single exposure time of 1000 sec, which results into a wavelength resolution of for the wavelength coverage of and . During the observation, the telescope was nodded with a dithering of 45 or 55 for background subtraction. Although the total integration time was 54,000 sec, we removed some low-quality frames (e.g., bad seeing) and thus used only 42,000 sec data in the following analysis and discussion. The adopted position angle was 935, so that the target and the reference bright object were observed simultaneously (note that the effective slit length is ). Though the position angle was not parallactic during the observation, the effect of the atmospheric dispersion is negligible in the observed wavelength range. We also obtained the spectra of HIP 66935, HIP 68767, HIP 71468, HIP 75911 and HIP 83063 for the correction of telluric and instrumental transmission curves. The data were reduced following the standard procedure of dark subtraction, flat fielding, sky subtraction, bad-pixel correction, residual sky subtraction, and correction for the atmospheric and instrumental transmission curves. Spectrophotometry was carried out using the spectra of FS 138 taken after the observation.
3 RESULTS
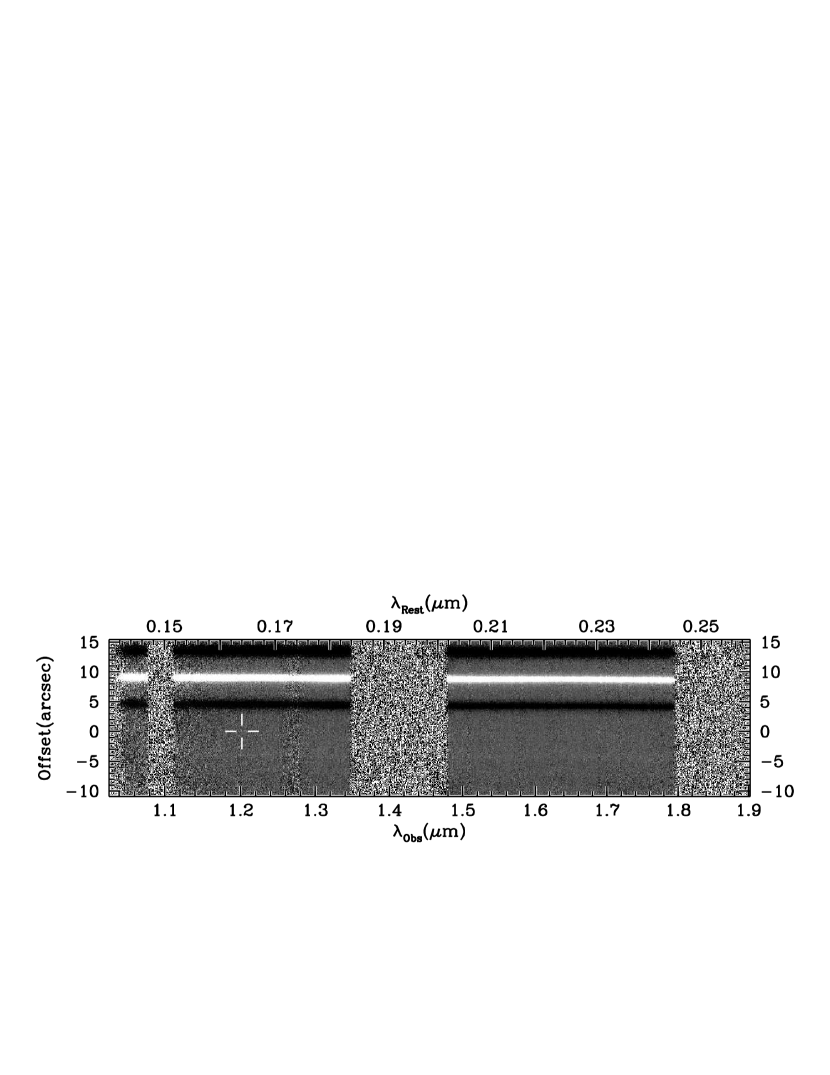
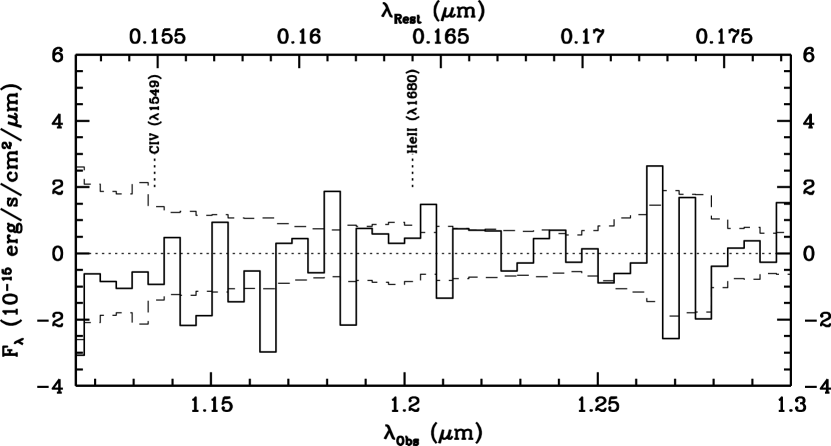
The final two-dimensional spectrum is shown in Figure 2. Three very strong continuum features (one is positive and two are negative) are seen, which are the spectra of the reference star observed simultaneously with the scientific target. Although the redshifted Heii1640 is expected at m, no emission-line feature is seen at the expected place on the two-dimensional spectrum as shown in Figure 2. The aperture size for spectral extraction is 9 pixels (095). In Figure 3, the one-dimensional spectrum around the expected wavelength of the Heii1640 emission is shown, adopting a 5 pixel binning. The spectral extraction of the target is performed by tracing the reference star. If we assume that the Heii line is unresolved, or equivalently, that the Heii emission-line width is less than 2000 km s-1, the estimated 2 upper limit on the Heii1640 flux from SDF J132440.6+273607 is ergs s-1 cm-2, which corresponds to a luminosity of ergs s-1. Since the Ly flux of the galaxy is ergs s-1 cm-2 (Nagao et al. 2004), the 2 upper-limit on the Heii1640/Ly ratio is 0.23. This upper limit would become significantly smaller if taking into account the absorption by intergalactic matter on the Ly flux, as discussed in §4.
In the discovery paper of SDF J132440.6+273607 (Nagao et al. 2004), the possibility that this object is a [Oii] emitter at was not rejected completely because the spectral resolution was too low to resolve the [Oii] doublet. However, a [Oii] emitter at should exhibit H emission at 1.159m and a [Oiii] doublet at m and m. Since the spectrum of SDF J132440.6+273607 shows neither the Heii1640 emission nor any other emission-line features, the idea that this target is not a low- emission-line galaxy but an object at is further supported. Also, the non-detection of Civ1549 at 1.135m suggests that SDF J132440.6+273607 is not an active galactic nucleus (AGN) at since Civ1549 is one of the strongest UV emission lines seen in AGNs. The estimated 2 upper-limit flux on Civ1549 is ergs s-1 cm-2 with the same extraction aperture adopted for the measurement of Heii1640.
Not only emission-line features, but any continuum emission of SDF J132440.6+273607 is also undetected. The 2 upper-limit flux densities are ergs s-1 cm-2 at m and ergs s-1 cm-2 at m. Here the same spectrum extraction aperture (095) is adopted. These upper-limit values are consistent with the flux density measured by NB921 filter (centered at 9196; see Kashikawa et al. 2004; Taniguchi et al. 2005), ergs s-1 cm-2 (Nagao et al. 2004), assuming a flat UV continuum.
4 DISCUSSION
Due to the very hard spectral energy distribution (SED) of population III stars, a strong Heii1640 emission should be seen if population III stars exist in the observed system. We can estimate an upper limit on the number of population III stars by means of the obtained upper limit on the Heii1640 flux. Once a SED of a stellar cluster is given, the Heii1640 luminosity is given by the following relation;
| (1) |
where is the Heii1640 emission coefficient for Case B ( ergs), is the escape fraction of the ionizing photon, is the He+ ionizing photon flux, and is defined as . Assuming that the escape fraction is negligibly small, the expected Heii1640 luminosity is determined only by the shape of the SED, which depends on the initial-mass function (IMF) and on the evolutionary processes of population III stars. Schaerer (2002) computed detailed evolutionary models for population III stars and presented their SEDs for given IMF and two extreme evolutionary cases, i.e., with and without strong mass loss. The evolution of the SED is strongly affected by mass loss because the effective temperature of population III stars increases if strong mass loss occurs (e.g., El Eid et al. 1983) while it is much cooler without (e.g., Castellani et al. 1983; Chieffi & Tornambe 1984). The calculated by Schaerer (2002) and the derived upper limits on are summarized in Table 1. The investigated IMFs are Salpeter’s ones (i.e., ) with lower-mass cut off at or and with upper-mass cut off at , or . Although a very large (and nearly meaningless) upper limit is derived from the model with , this model seems far from describing the actual situation for population III stars. Recent theoretical studies suggest that the formation of population III stars is characterized by a much larger , at least a few hundreds (e.g., Bromm et al. 2002; Omukai & Palla 2003). Therefore, the upper limit on is estimated to be in the range for the cases without mass loss and for the cases with strong mass loss, depending on and . On the other hand, the total SFR (including population III population I/II stars) estimated through the Ly flux is yr-1 (Nagao et al. 2004). However, this is likely a lower limit since the absorption due to intergalactic medium on the Ly flux is not taken into account. For high- LAEs, more than half of the Ly flux could be absorbed due to high opacity of intergalactic matter (e.g., Haiman 2002). Therefore, our non-detection of the Heii1640 emission suggests that the star-forming activity in SDF J132440.6+273607 is not dominated by population III but by normal population I/II stars, unless is very low () and mass loss does not occur during the evolutionary process of population III stars. Some theoretical studies suggest that strong mass loss is expected due to electron-scattering opacity, because population III stars are expected to be radiating near to their Eddington limit (e.g., El Eid et al. 1983).
Although it is impossible to derive general conclusions on the nature of population III stars based only on this case study of SDF J132440.6+273607, we will now consider the possible implications of our result. Scannapieco et al. (2003) computed , the probability that the star formation occurring in a high- galaxy is dominated by population III stars as a function of redshift and efficiency of metal-enriched outflow from high- starburst. Since population III star formation cannot occur once the primeval gas is polluted by metal-enriched outflow from a neighboring system, strongly depends on the metal-ejection efficiency of the population III stars. However, the metal ejection from population III stars takes place only in a narrow mass range () by pair instability supernovae (SNeγγ; e.g., Heger & Woosley 2002), since population III stars with and collapse to black holes and thus no metal ejection occurs. Therefore also depends on the initial-mass function (IMF) of population III stars. Scannapieco et al. (2003) parameterized the feedback effects with the parameter , “energy input per gas mass”, defined as where , , and are, respectively, the explosion energies of SNeγγ, the fraction of gas converted into stars, the fraction of channeled into galaxy outflows, and the number of SNeγγ per unit stellar mass. Scannapieco et al. (2003) reported that the population III star formation could continue to only in the case of weak feedback models (i.e., small ). Our non-detection of population III stars at would disfavor the models with ergs , which corresponds to population III IMFs with a narrow Gaussian peak at or .
To make the above discussion more general, Heii emission should be investigated in many more galaxies at and, indeed, the most recent observational facilities have allowed us to find some galaxies in this redshift redshift range with spectroscopically confirmed redshifts (e.g., Hu et al. 2002; Kodaira et al. 2003; Kurk et al. 2004; Rhoads et al. 2004; Nagao et al. 2004, 2005; Stern et al. 2005; Taniguchi et al. 2005). Among them, galaxies with a large (Ly) are good targets because galaxies hosting a significant number of population III stars are expected to present very large equivalent widths [; e.g., Schaerer 2002; Scannapieco et al. 2003]. However, it may be more promising to search for population III stars at much higher redshifts because the probability that galaxies are dominated by population III stars increases dramatically as a function of , as demonstrated by Scannapieco et al. (2003). Recently, the near-infrared excess of the cosmic background radiation (Wright & Reese 2000; Cambrésy et al. 2001; Matsumoto et al. 2005) has been interpreted to be the integrated emission from population III stars in their final phase of formation at (e.g., Santos et al. 2002; Salvaterra & Ferrara 2003). This implies that the most promising way to observationally detect and investigate population III stars is surveying strong Ly emitters at and examine their Heii emission. Although a recent Ly emitter survey failed to find such objects (Willis & Courbin 2005), forthcoming infrared cameras with a large FOV such as MOIRCS (Tokoku et al. 2003) will be powerful tools to detect Ly emitters in the very high- universe.
We thank the Subaru Telescope staffs for their invaluable assistance. We also thank F. Iwamuro for the useful discussion on the OHS data reduction, and K. Omukai and R. Schneider for their valuable comments. TN and MA are JSPS fellows.
References
- (1) Abel, T., Bryan, G. L., & Norman, M. L. 2002, Science, 295, 93
- (2) Bennett, C. L., et al. 2003, ApJS, 148, 1
- (3) Bromm, V., Coppi, P. S., & Larson, R. B. 1999, ApJ, 527, L5
- (4) Bromm, V., Coppi, P. S., & Larson, R. B. 2002, ApJ, 564, 23
- (5) Bromm, V., Kudritzki, R. P., & Loeb, A. 2001, ApJ, 552, 464
- (6) Cambrésy, L., Reach, W. T., Beichman, C. A., & Jarrett, T. H. 2001, ApJ, 555, 563
- (7) Castellani, V., Chieffi, A., & Tornambe, A. 1983, ApJ, 272, 249
- (8) Dawson, S., et al. 2004, ApJ, 617, 707
- (9) Chieffi, A., & Tornambe, A. 1984, ApJ, 287, 745
- (10) Ciardi, B., Ferrara, A., & White, S. D. M. 2003, MNRAS, 344, L7
- (11) El Eid, M. F., Fricke, K. J., & Ober, W. W. 1983, A&A, 119, 54
- (12) Ezer, D., & Cameron, A. G. W. 1971, Ap&SS, 14, 399
- (13) Fujimoto, M. Y., Iben, I., Jr., & Hollowell, D. 1990, ApJ, 349, 580
- (14) Haiman, Z. 2002, ApJ, 2002, 576, L1
- (15) Haiman, Z., & Loeb, A. 1997, ApJ, 483, 21
- (16) Heger, A., & Woosley, S. E. 2002, ApJ, 567, 532
- (17) Hu, E. M., et al. 2002, ApJ, 568, L75; Erratum, ApJ, 576, L99
- (18) Iwamuro, F., Motohara, K., Maihara, T. Hata, R., & Harashima, T. 2001, PASJ, 53, 355
- (19) Iye, M., et al. 2004, PASJ, 56, 381
- (20) Kashikawa, N., et al. 2004, PASJ, 56, 1011
- (21) Kennicutt, R. C., Jr. 1983, ApJ, 272, 54
- (22) Kodaira, K., et al. 2003, PASJ, 55, L17
- (23) Kurk, J. D., Cimatti, A., di Serego Alighieri, S., Vernet, J., Daddi, E., Ferrara, A., & Ciardi, B. 2004, A&A, 422, L13
- (24) Matteucci, F., & Pipino, A. 2005, MNRAS, 357, 489
- (25) Motohara, K, et al. 2002, PASJ, 54, 315
- (26) Nagao, T., et al. 2004, ApJ, 613, L9
- (27) Nagao, T., et al. 2005, ApJ, in press (astro-ph/0508179)
- (28) Nakamura, F., & Umemura, M. 2001, ApJ, 548, 19
- (29) Oh, S. P., Haiman, Z., & Rees, M. J. 2001, ApJ, 553, 73
- (30) Omukai, K., & Palla, F. 2003, ApJ, 589, 677
- (31) Rhoads, J. E., et al. 2004, ApJ, 611, 59
- (32) Salvaterra, R., & Ferrara, A. 2003, MNRAS, 339, 973
- (33) Santos, M. R., Bromm, V., & Kamionkowski, M. 2002, MNRAS, 336, 1082
- (34) Scannapieco, E., Schneider, R., & Ferrara, A. 2003, ApJ, 589, 35
- (35) Schaerer, D. 2002, A&A, 382, 28
- (36) Schaerer, D. 2003, A&A, 397, 527
- (37) Stern, D., et al. 2005, ApJ, 619, 12
- (38) Taniguchi, Y., et al. 2005, PASJ, 57, 165
- (39) Tokoku, C., et al. 2003, SPIE, 4841, 1625
- (40) Tumlinson, J., & Shull, M. J. 2000, ApJ, 528, L65
- (41) Tumlinson, J., Shull, M. J., & Venkatesan, A. 2003, ApJ, 584, 608
- (42) Venkatesan, A., Schneider, R., & Ferrara, A. 2004, MNRAS, 349, L43
- (43) Willis, J. P., & Courbin, F. 2005, MNRAS, 357, 1348
- (44) Wright, E. L., & Reese, E. D. 2000, ApJ, 545, 43
| ModelaaParameters adopted by Schaerer (2002). | bbFrom Schaerer (2002). | cc2 upper-limit on SFR of population III stars derived by our upper limit on (Heii1640). | |
|---|---|---|---|
| IMF | Mass Loss | (ergs s-1) | (M⊙ yr-1) |
| no | 215.2 | ||
| no | 41.2 | ||
| no | 4.9 | ||
| yes | 13.2 | ||
| yes | 1.8 | ||