MORPHOLOGICAL DEPENDENCE OF STAR FORMATION PROPERTIES FOR THE GALAXIES IN THE MERGING GALAXY CLUSTER A2255
Abstract
The merging cluster of galaxies A2255 is covered by the Sloan Digital Sky Survey (SDSS) survey. The physical parameters of 184 bright member galaxies derived from the SDSS data analyses by Brinchmann et al. (2004b) allow a detailed study on the star formation properties of the galaxies within a merging cluster at intermediate redshift. In this paper we perform a morphological classification on the basis of the SDSS imaging and spectral data, and investigate the morphological dependence of the star formation rates (SFRs) for these member galaxies. As we expect, a tight correlation between the normalized SFR by stellar mass (SFR/M∗) and the H equivalent width is found for the late-type galaxies in A2255. The correlation of SFR/M∗ with the continuum break strength at 4000 Å is also confirmed. The SFR/M∗ - M∗ correlation is found for both the early- and late-type galaxies, indicating that the star formation activity tends to be suppressed when the assembled stellar mass (M∗) increases, and this correlation is tighter and steeper for the late-type cluster galaxies. Compared with the mass range of field spiral galaxies, only two massive late-type galaxies with M are survived in A2255, suggesting that the gas disks of massive spiral galaxies could have been tidally stripped during cluster formation. Additionally, the SFR variation with the projected radial distance are found to be heavily dependent upon galaxy morphology: the early-type galaxies have a very weak inner decrease in SFR/M∗, while the inner late-type galaxies tend to have higher SFR/M∗ values than the outer late-types. This may suggest that the galaxy-scale turbulence stimulated by the merging of subclusters might have played different roles on early- and late-type galaxies, which leads to a suppression of the star formation activity for E/S0 galaxies and a SFR enhancement for spiral and irregular galaxies.
1 INTRODUCTION
To study the star formation history of the universe is one of the major tasks of extragalactic astronomy. The current star formation rates (SFRs) of galaxies and the variation with morphology, environment and some physical properties of galaxies are crucial in our understanding of the evolution of galaxies (Kennicutt 1998; Brinchmann et al. 2004a). Some studies show that the galaxy-scale turbulence plays a key role on star formation of galaxies (e.g. MacLow & Klessen 2004; and references therein). However, the origin and consequence of this turbulence are still unclear, it is reasonable to expect that the star formation activity should be a function of many variables. A large number of investigations focus on finding the possible correlations of the SFRs of galaxies with some global quantities, such as stellar mass (Kauffman et al. 2003a,b), morphological classification (Kennicutt, Tamblyn, & Congdon 1993; Kennicutt 1983; Kennicutt 1998), metallicity (Brinchmann et al. 2004a; Tremonti et al. 2004), luminosity (e.g., Bell 2003), and redshift (Butcher & Oemler 1984; Finn, Zaritsky, & McCarthy 2003).
It is widely accepted that above-mentioned physical properties of galaxies are fundamentally linked with their gravitational environment (e.g., Dressler 1980; Butcher & Oemler 1984). Of great concern is whether the star formation properties of cluster galaxies are similar to those of field galaxies. With the traditional H spectroscopy (Kennicutt 1983), the star formation rates (SFRs) for nearby galaxies () are estimated by many investigators. The main advantages of this approach are direct measurements of ionizing flux from young stars and insensitivity to extinction than the [O II] measurements. Based on the H data, Kennicutt et al. (1983, 1984) study four nearby clusters, and they find that the cluster and field spirals with the same morphological type have similar SFRs in three of four clusters. However, the difference between field and cluster spiral galaxies is found by Moss & Whittle (1993), and such difference is likely to be dependent upon morphology (Moss & Whittle 2000).
The SFRs in late-type galaxies are found to be closely related to their gas content (Kennicutt 1998). To look at which environmental processes have actually affected the gas content of the spiral galaxies within a nearby cluster, Koopmann et al. (2004) compare the H morphologies of the spiral galaxies in the Virgo cluster with those of isolated field spirals, and find obout half of the Virgo spiral galaxies having truncated H disks. Considering that the truncated H disks are relatively rare in isolated spiral galaxies, this result suggests that many Virgo spiral galaxies could have experienced intracluster medium (ICM) - interstellar medium (ISM) stripping and significant tidal effects. Gavazzi et al. (2002) investigate the star formation properties as a function of the clustercentric projected distance for 369 late-type galaxies in the Virgo, Coma and A1367 clusters, and they find that the bright spirals in the Virgo cluster tend to decrease their SFRs inward, and the fainter late-types show no or reverse trend. Additionally, convincing evidence of the star formation suppression of the cluster galaxies has been found in some rich clusters with higher redshifts (Couch et al. 2001; Balogh & Morris 2000; Balogh et al. 2002; Finn et al. 2004).
This paper explores the properties of star formation for the merging cluster of galaxies A2255 that is covered by the Sloan Digital Sky Survey (SDSS) and the Beijing-Arizona-Taiwan-Connecticut (BATC) multicolor photometric survey. There are 132 early-type galaxies and 52 late-types in this cluster with their absolute magnitudes in the SDSS band () brighter than , which provides a good sample for studying the SFR variation of cluster galaxies with morphology and projected radial distance. Another main motivation of this study is to find possible links among the physical properties of cluster galaxies. For a better understanding of the environmental effects of the star formation properties of galaxies at different evolutional stages, it is illuminating to compare our results with those of field galaxies and the high- cluster galaxies.
We start in §2 with describing the relevant physical parameters for the galaxies in A2255. The star formation properties for these cluster galaxies, as a function of other physical parameters of galaxies, are shown in §3. We then compare the properties with nearby field galaxies and high- cluster galaxies, and discuss their implications in §4. Finally, the conclusions are given in §5. A Friedmann-Robertson-Walker cosmology with and km/s/Mpc is assumed throughout this paper.
2 Physical parameters for cluster galaxies
A2255 is a cluster of galaxies with an intermediate redshift of (Struble & Rood 1999, giving a distance modulus of 37.8), and richness class 2 (Abell 1958). Using the data from the the SDSS Data Release 2 (DR2) and the BATC multicolor photometric survey, we have explored the color-magnitude relation, luminosity function and dynamics of the member galaxies, and a direct dynamical evidence for an on-going merger has been found for this cluster (Yuan et al. 2003).
The SDSS aims at targeting galaxies with -band magnitude for spectroscopy (Strauss et al. 2002). Based on a large sample of spectroscopically-confirmed galaxies provided by the SDSS DR2 (Abazajian et al. 2004) and the new models of stellar population synthesis (Bruzual & Charlot 2003; Charlot et al. 2002; Charlot & Longhetti 2001), Brinchmann et al. (2004b) have derived and compiled the physical quantities concerning the star-formation properties for more than galaxies, including stellar mass, current SFRs, gas-phase metallicity, absorption line indices, the emission line measurements, and so on.
The parameters relevant to this work are estimated mainly by following investigations: (i) Kauffmann et al. (2003a,b) develop a method to constrain the star formation history, dust attenuation and stellar mass () of the specified galaxy on the basis on the continuum break at 4000 Å () and the absorption line. The strength of continuum break at 4000 Å is a prominent feature in galaxy spectra resulted from a large number of metal lines. This can be treated as a powerful age estimator since the young and hot stellar population show a very weak 4000Å break. The strength of continuum break is also defined in Tremonti (2002). (ii) Brinchmann et al. (2004a) make use of the methodology in Charlot et al. (2002) and the emission line models in Charlot & Longhetti (2001) to derive the SFRs inside the fibre aperture. Then, the total SFRs in galaxies are derived by the aperture correction.
We select all the SDSS galaxies with in the BATC-targeting sky region of 59 59 arcmin2, defined by a right ascension range from to , and a declination range from to (J2000.0) (Yuan et al. 2003). As a result, we obtain 184 spectroscopically-confirmed member galaxies with , of which the physical properties are publicly released at http://www.mpa-garching.mpg.de/SDSS/ by Brinchmann et al. (2004b). The completeness of this sample reaches at least 90% down to a -band absolute magnitude () of . This should be an ideal sample for investigating the star formation properties of the galaxies within a merging cluster at intermediate redshift.
3 Results
3.1 Morphological classification
In order to classify the cluster galaxies into early- and late-type galaxies, we have collected their SDSS imaging and spectral data, as well as some photometric parameters relevant to the morphology, such as the likelihoods for radial profile fitting with the de Vaucouleurs (1948) model () and the exponential model (), the concentration index characterized by the ratio between two galaxy radii which contain 90% and 50% of Petrosian flux respectively (), the color index (), and the continuum break strength at 4000Å ().
Though the concentration index and fitting likelihoods parameterize the light profiles of galaxies, the eye-ball inspecting should be the most straightforward way for finding some morphological characteristics (e.g., spiral arms, bars, rings, dust lane, etc.). For a secure morphological classification, it is important to directly inspect the SDSS images of galaxies. For about half of galaxies in A2255, the eye-ball classification is quite confident. It can be understood that the regular elliptical galaxies have and/or , while the disk-dominated spiral galaxies have and/or . For the galaxies with significant likelihood difference (i.e., ) and one of profile-fitting likelihoods greater than (i.e., ), it is completely unambiguous to classify the galaxies with larger as the early-types, whereas the late-types for the galaxies with larger .
Nevertheless, the spatial resolution (0.396”/pixel) of SDSS images is not high enough for a secure classification of some faint galaxies. Furthermore, some late-type bulge-dominated (Sa-Sb) galaxies are likely to be misclassified as the early-type galaxies because their light profiles cannot be distinguished from the early-types (Scodeggio et al. 2002). The template spectra of nearby normal galaxies (Kennicutt 1992) show that the Sa-Sb spiral galaxies usually have week H emission feature which should be present in their SDSS spectra (). Therefore, it is necessary to inspect the spectral feature for further classification, particularly for the galaxies with low fitting likelihoods for both profile models. For ease to compare with the spectrophotometric atlas of nearby normal and peculiar galaxies with known morphologies (Kennicutt 1992), we transform the SDSS spectra to the rest frame defined by the given redshifts, and then normalize the spectra by the flux at rest-frame wavelength 5500Å . For the majority of cluster galaxies, the spectral classification into the early- and late-types is unambiguous, and their images and relevant morphological parameters (i.e., , , and ) are consistent with each other. For small number of ambiguous cases in the S0/Sa separation, we classify the galaxies with the H equivalent widths (EWs) greater than 1.0 Å as the late-types in practice.
Finally, We obtain 132 early-type galaxies and 52 late-type galaxies in A2255. It should be noted that there are 5 early-type galaxies with strong emission lines (i.e., EW(H)5Å) in our sample. Their morphology-relevant parameters are given in Table 1. According to the diagnostics of the emission lines in spectra (Baldwin et al. 1981), four of these five early-type galaxies are found to be the active galactic nuclei (AGNs), and one is a star-forming (SF) galaxy.
| Object Name | Remark | |||||
|---|---|---|---|---|---|---|
| SDSS J171315.45+642418.3 | 17.0 | -10.744 | -263.037 | 2.573 | 1.4729 | SF Galaxy |
| SDSS J171429.16+641656.3 | 16.6 | -71.789 | -369.118 | 2.367 | 1.4852 | BLAGN |
| SDSS J171221.14+643418.1 | 17.2 | -0.666 | -188.854 | 2.498 | 1.4749 | NLAGN |
| SDSS J171302.13+634758.8 | 17.3 | -0.038 | -223.167 | 2.842 | 1.6238 | NLAGN |
| SDSS J171052.51+633917.2 | 16.3 | -74.485 | -1529.74 | 2.872 | 1.6591 | AGN(LINER) |
The criterion of is adopted for selecting the elliptical galaxies by many investigators (e.g., Shimasaku et al. 2001; Padmanabhan et al. 2004). In addition, Kauffmann et al. (2003a) use a cut of to pick up the elliptical galaxies. It is interesting to check the efficiency of these criteria of morphology classification. Fig. 1 shows the continuum break strengths () of the galaxies in A2255 as a function of the radius ratios (). The early-type galaxies are denoted with solid points, while the late-types with open circles. Two criteria used in the literature are also marked in Fig. 1. It can be easily seen that is a better morphology indicator for the nearby cluster galaxies. With the criterion , we can pick up 128 ( 97% of 132) early galaxies, and 12 late-type galaxies are misclassified as the early-types. However, if we simply adopt to construct a sample of the early-type galaxies in A2255, nearly 30% of the early-types will be lost.
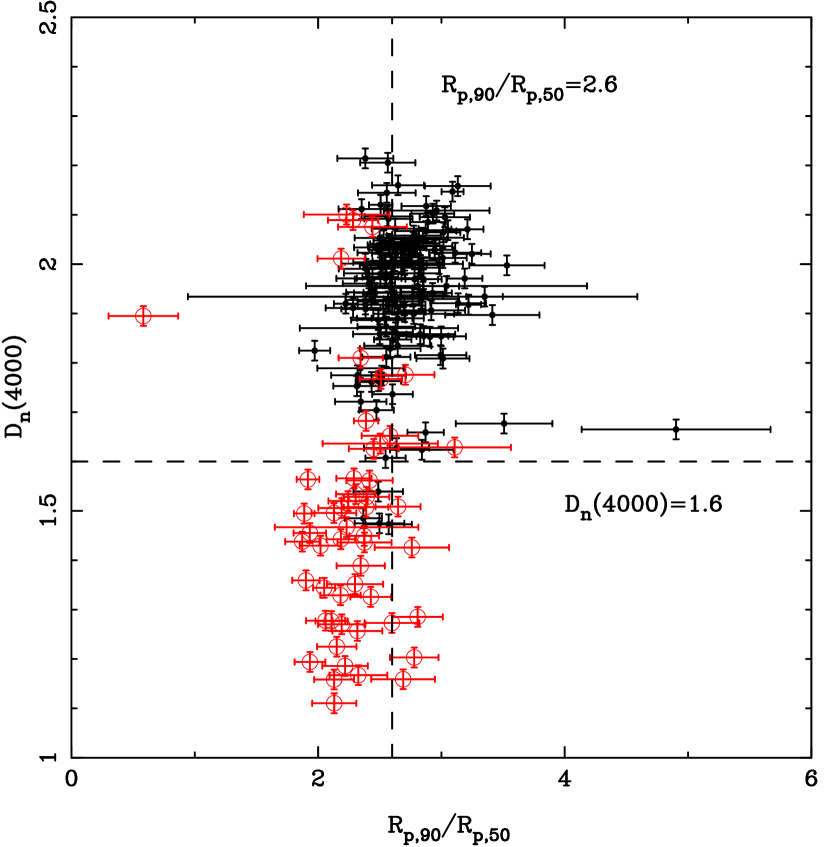
It should be pointed out that the relation is heavily dependent upon gravitational environment. The slope at which increases with tends to be flat for the galaxies in low-density regions (see figure 7 in Kauffmann et al. 2004). Therefore, for selecting the field elliptical galaxies, concentration parameter becomes more effective than the continuum break strength . Both criteria are taken by Shimasaku et al. (2001) to ensure their sampling of elliptical galaxies from the SDSS galaxies.
3.2 The SFR tracers
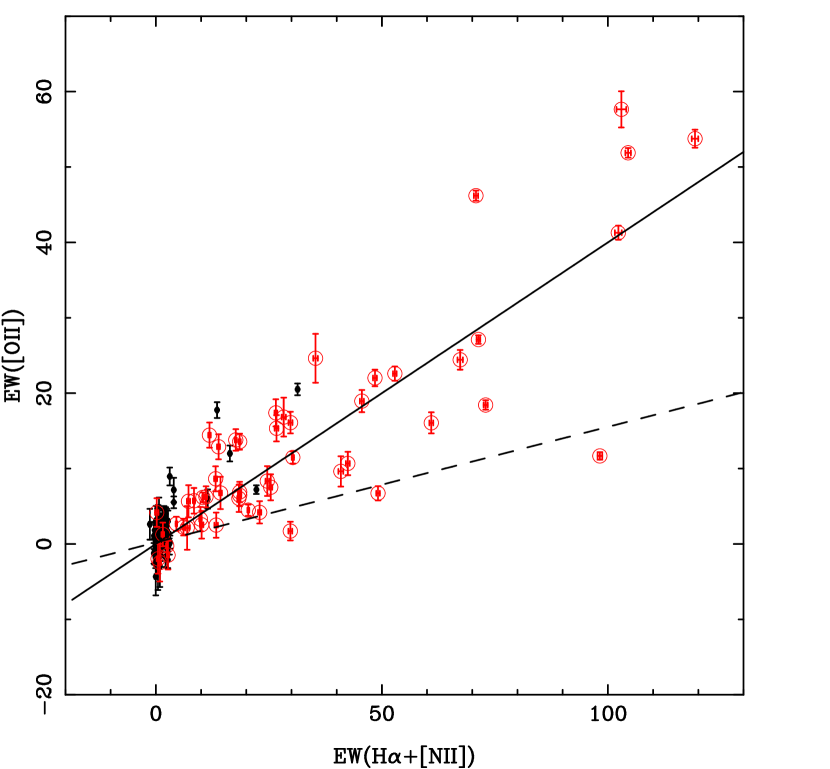
There are different indicators of galaxy SFR at different wavelengths. In optical band, the traditional SFR calibration uses the H emission line luminosity. The [O II] emission is also an important tool for estimating current SFRs for the galaxies with (Kennicutt 1998), which is based on the fact that there is a good correlation between observed [O II] line fluxes and observed H fluxes (i.e., prior to any obscuration corrections). Kennicutt (1992) sets up the SFR calibration with the [O II] fluxes by using a sample of 90 nearby () galaxies, and obtains the empirical ratio EW([O II])/EW(H+[N II]) = 0.4.
To avoid the additional uncertainties produced by the aperture corrections of the emission line fluxes, we sketchily observe the correlation between the equivalent widths (EWs) of these two lines. For compatibility, we give the plot of the [O II] EWs versus the composite EWs of H+[N II] for 184 member galaxies in Fig. 2. The Kennicutt’s relation (solid line in Fig. 2) can be used to fit the EW correlation for 184 A2255 galaxies very well. Jansen et al. (2001) point out that the flux ratio [O II]/H should be luminosity and metallicity dependent. Therefore, the appropriate flux ratio should be influenced by the selection effects of various samples of galaxies. The median flux ratio [O II]/H = 0.23 is derived by Hopkins et al. (2003) with a sample of 752 SDSS SF galaxies. Our result does not coincide with this flux ratio, denoted with dashed line in Fig. 2 when [N II]/H=0.5 (Kennicutt 1992) is assumed. This is probably because our sample only contains the cluster galaxies predominated by the early-type galaxies.
3.3 The SFR variation with morphology
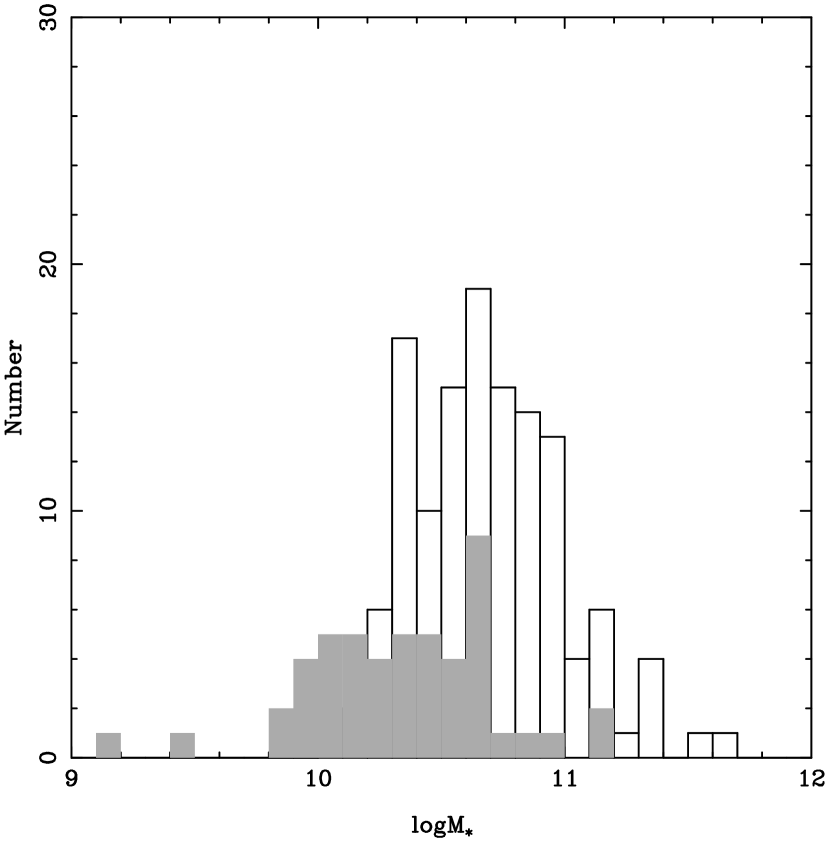
Fig. 3 shows the distributions of the stellar masses () for the early-type galaxies (open histogram) and the late-types (filled histogram). The early-type galaxies occupy a broader range (i.e., more than two orders of magnitude) in stellar mass, while the late-type galaxies cover a range of about one order of magnitude. We can find a significant trend towards old stellar populations for the galaxies with larger stellar masses. The typical stellar mass of the late-type galaxies is less by 0.4 dex than that of the early-types. This histogram supports the finding by Kauffmann et al. (2003b) that there is a rapidly increasing fraction of galaxies with old stellar populations for the massive galaxies with . In our sample there are only two late-type cluster galaxies having their stellar masses larger than .
The specific SFR, defined as SFR/, is a key parameter for measuring the rate that new stars add to the assembled mass of a galaxy. It is common to use this normalized SFR by stellar mass to investigate the relationship between the star formation activity and the physical properties (e.g., Brinchmann et al. 1997). Brinchmann et al. (2004a) find a strong correlation between the SFR and stellar mass over a significant range in / from to (see the figure 17 therein). Fig. 3 shows that a vast majority of the galaxies in A2255 have their stellar masses larger than , so the SFR- correlation breaks down for our sample.
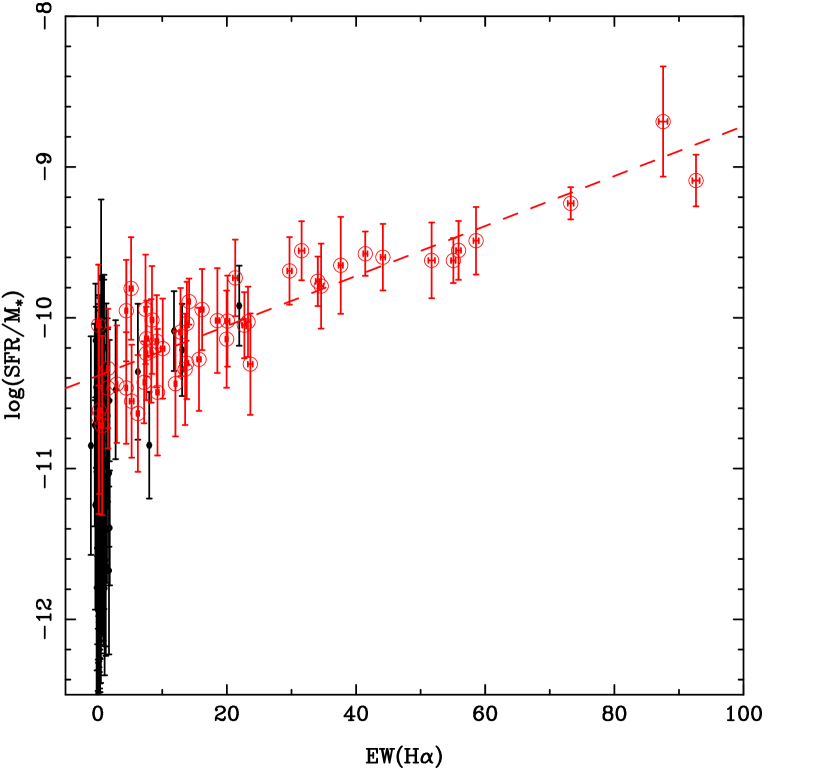
Since the EW is defined as the emission-line luminosity normalized to the adjacent continuum flux, the EW of H emission line is also a direct measure of the SFR per unit red luminosity (Kennicutt 1998). It can be expected that there should be a tight correlation between the H EW and SFR/M∗, when a fixed mass-to-luminosity ratio is assumed for the late-type galaxies. This SFR/M∗-EW(H) correlation is well shown in Fig. 4. A linear fitting is performed for the late-type galaxies with a wide range of the H EWs, and we obtain . This correlation is so tight that its correlation coefficient reaches 0.877 and the dispersion in log(SFR/M∗) is 0.20. Meanwhile, this correlation demonstrate the reliability of the specific SFRs derived by Brinchmann et al. (2004a) and Kauffmann et al. (2003a,b).

Fig. 5 shows the relation between the specific SFR and the stellar mass for the galaxies in A2255. The late-type galaxies tend to have higher SFR/ values than the early-types. Most of the early-type galaxies have lower fraction of the newly-formed stellar masses, with respect to their large assembled masses. The early-type galaxies in A2255 cover a range from to in the SFR/ domain, and the specific SFRs decline slightly when their stellar masses grow. The weak SFR/- correlation can be expressed by a linear fit of , which is shown in Fig. 5 with the dotted line. The correlation coefficient is only , and the dispersion of log(SFR/) is 0.52. For the late-type galaxies, however, one can see a clear trend that the star formation activity decreases when the stellar mass increases (see the dashed line), with a linear fit of . The correlation coefficient is , and the dispersion is 0.33. Keep in mind that there is a significant difference between the slopes of these two relations, and its implication will be addressed in §4.
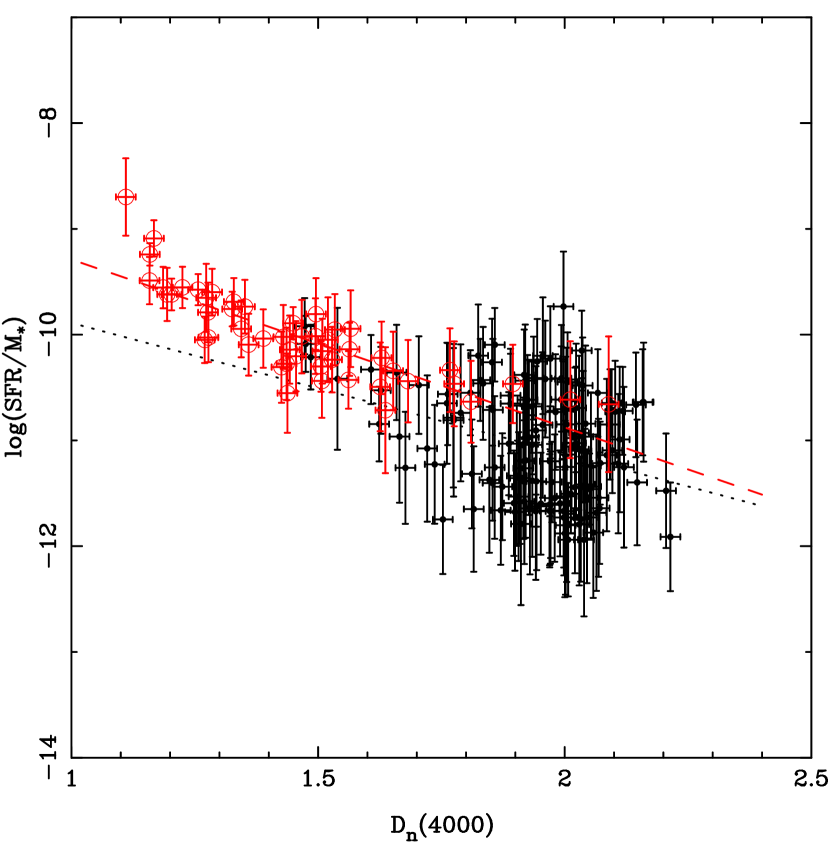
Brinchmann et al. (2004a) find a tight correlation between the specific SFR (SFR/M∗) and the 4000Å break strength () for the SDSS SF galaxies with the signal-to-noise ratio in the emission lines H, H, [O III] and [N II]. Because the SF galaxies with strong emission lines become rare in the rich clusters, this correlation has been extended to the non-SF galaxies for estimating the specific SFRs. We plot the relation between SFR/M∗ and for the galaxies in A2255 in Fig. 6. A very tight correlation can be easily found for the late-type galaxies (open circles) with smaller continuum break strengths. A linear fitting is given for the late-type galaxies, with an expression of (dashed line). The correlation coefficient is , and the dispersion is 0.24.
The SFR/M∗ - correlation becomes weak for the early-type galaxies with a larger dispersion of 0.49 and a similar slope of (). The continuum break strengths for the majority of early-type galaxies are greater than 1.6. The distribution in the - space for the early-type galaxies in A2255 is in good accordance with the contour map shown in the figure 11 of Brinchmann et al. (2004a), suggesting that the majority of the SDSS SF galaxies with strong continuum break at 4000 Å are the early-type galaxies within the dense environment.
3.4 The radial distribution of
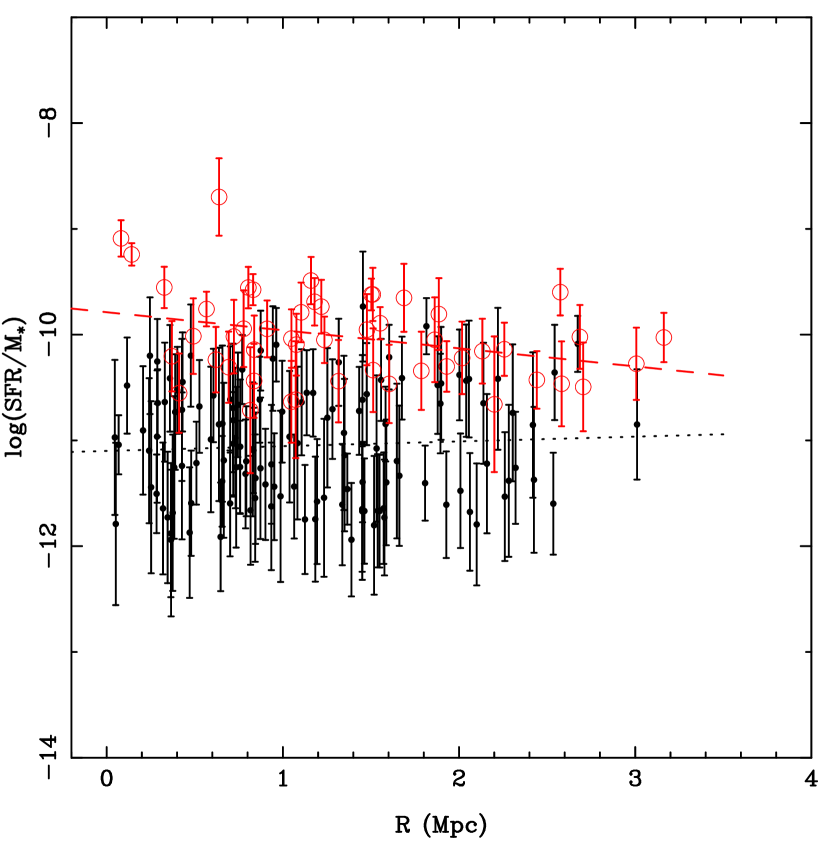
The star formation properties are fundamentally related with the local environment. It is interesting to observe how the star formation activities of the galaxies in a cluster vary with the distances to the cluster center. Fig. 7 shows the normalized SFR by stellar mass as a function of projected distances () to the cluster center. We adopt the center of A2255 as (, ; J2000.0) which is given by the NASA/IPAC Extragalactic Database (NED). At first glance, the striking feature in Fig. 7 is that the cluster galaxies with various morphologies behave significantly different tendencies about how the specific SFRs vary with the locations. For the early-type galaxies, there is a very weak trend that the inner galaxies have lower SFR/ values, with a linear fitting of . The corresponding correlation coefficient is 0.058, and the dispersion of is 0.522. This trend suggests a slight suppression of the star formation activity when these cluster galaxies become massive and concentrated. The inner early-type galaxies might have higher probability to be near the end point of their star formation activities when the internal gas reservoir is run out.
As a sharp contrast, the late-type galaxies follow a clear trend that the inner galaxies have higher rate of mass supplement from new stars (relative to the assembled stellar mass). The correlation between SFR/ and the projected radial distance is more significant for the late-type galaxies. We obtain a linear fit of . Its correlation coefficient is , and the dispersion in is 0.392. The different behaviors in radial distribution of the specific SFRs between the early- and late-type galaxies in A2255 might indicate that the galaxy-scale turbulence has played different roles on the star formation process for different types of galaxies, which lead to a suppression of the star formation activity for E/S0 galaxies and a SFR enhancement for spiral and irregular galaxies.
4 Discussion
A2255 is a merging cluster with an intermediate redshift (), which provides an ideal laboratory for studying the SFR variation of the galaxies within a merging cluster with morphology and projected radial distance. There are 52 late-type cluster galaxies with the -band absolute magnitude brighter than . On the one hand, the rich clusters with smaller redshifts are expected to have smaller number of blue late-type member galaxies in cluster cores (Butcher & Oemler 1984). On the other hand, for the rich clusters with higher redshifts, a lot of late-type member galaxies will be fainter than , and thus beyond the limit of the SDSS spectroscopy.
According to the hierarchical model of large-scale structure formation in the picture of cold dark matter, clusters grow in mass by accreting galaxies from the surrounding field. After the galaxies are involved into the dense environment (e.g., a cluster of galaxies), the further star formation activity within the galaxies is expected to be suppressed by some important processes, such as tidal stripping and “harassment” (Moore et al. 1996), ram pressure stripping of the gas disk (Abadi, Moore, & Bower 1999; Quilis, Moore, & Bower 2000), and removal of gas reservoir surrounding each galaxy (Balogh et al. 1999). These galaxies then evolve to be the early-type galaxies with red color and little gas. This hierarchical model can be used to interpret why a higher fraction of the early-type galaxies appear in nearby galaxy clusters rather than in the high- clusters and in the field (Dressler 1980; Whitmore et al. 1993).
The correlation between SFR/ and stellar mass () has been found for both the early- and late-type galaxies in A2255, with a trend that the star formation activity declines as the assembled stellar mass increases. Brinchmann & Ellis (2000) constructed a sample of 321 field galaxies with known morphologies in a large redshift range of , and found the same trend for both E/S0 and spiral disk galaxies. This SFR/ correlation can be extended to some dwarf early-type galaxies in the field (with ), and the slope for early-type disk galaxies () is much steeper than that for the E/S0 galaxies in A2255 (). The late-type galaxies in a cluster seem to have similar behavior in SFR/ relation as compared with the field spiral and peculiar galaxies. It should be noted that there are only two massive late-type galaxies (i.e., ) survived in A2255, which might indicate that the massive late-type galaxies have greater probability to collide with other galaxies as they are falling into a cluster, and their gas disks could be tidally stripped. Considering the fact that about half of spiral galaxies in the Virgo cluster show the truncated H disks (Koopmann et al. 2004), a certain fraction of the late-type galaxies in A2255 might have also experienced the ICM-ISM stripping and strong tidal interaction. As a result, some massive spiral galaxies have died out their star formation activities, and then evolved into the early-type galaxies.
The correlation between the SFR/ and the projected radial distance is marginally found for the early-type galaxies in A2255. This slight trend of inner decrease in their specific SFRs can be well interpreted with the hierarchical model: once the galaxies enter the denser environment (i.e., the core region of a cluster), their star formation activities have been reduced by the above-mentioned physical processes, and their appearances tend to become more concentrated. However, some spiral/irregular galaxies in A2255 have survived from those processes, which means that the overall cluster tidal field or high speed “harassment” interaction between galaxies should have not stripped their gas disks during the formation of this cluster (via accreting and merging of subunits). Of great interest is that these late-type galaxies are found to possess a contrary trend that the inner late-type galaxies are likely to have more violent star formation activities.
Is the morphological dependence of the SFR/ relation universal for the galaxies in rich clusters? This tendency has also been found in some nearby and high- clusters of galaxies. Moss & Whittle (2000) use an objective prism technique to survey the H emission from the late-type galaxies in the regions of eight nearby Abell clusters (), and they find that the frequency of starburst emission in spiral galaxies increases from the regions of lower to higher local galaxy density. For the nearby galaxy cluster A1367 at =0.0214, a much larger fraction of spiral galaxies are detected with compact H emission in the cluster core region (Moss, Whittle, & Pesce 1998). The similar radial distribution of the SFRs is found for the high- galaxy cluster CLJ0023+0423B (): a high fraction of the late-type galaxies (characterized by the small index given by the Sersic profile fittings) with strong H emission are found in the cluster core (Finn, Zaritsky, & McCarthy 2004). The radial trend of the SFR distribution for the late-type galaxies in the Virgo, Coma and A1367 cluster is studied by Gavazzi et al. (2002), and no clear trend is found for these three local clusters. Only the sample of bright Virgo galaxies shows an inner decrease in SFR, which is inconsistent with our finding for the late-type galaxies in A2255.
What physical processes may lead to an enhancement of star formation activity for the inner late-type galaxies? This question is important for understanding the evolution of cluster galaxies. Lavery & Henry (1988) first proposed that the star formation can be triggered by galaxy-galaxy interactions in clusters with intermediate redshifts, which could be used to explain why the fraction of blue galaxies in cluster core increases with redshift (Butcher & Oemler 1984). Numerical simulations by Gnedin (1999) have shown that the time-varying cluster potential could cause a sequence of strong tidal shocks on individual galaxies. The shocks probably take place over a wide region of the cluster, and enhance the galaxy-galaxy merger rates. The tidal perturbation in a short range may lead to a triggering of star formation.
Recent observations from the radio (e.g., Feretti et al. 1997, Miller & Owen 2003) and X-ray bands (Burns et al. 1995, Davis & White 1998) show some features indicative of an ongoing merger event in A2255. Based on dynamical analysis of the member galaxies, we also find a direct evidence showing that A2255 possesses a cluster/group merger (Yuan et al. 2003). An ordered magnetic field on large scales is recently detected in A2255 by Govoni et al. (2005), which strongly supports the merging scenario. We would like to point out that the subcluster mergers might be the main mechanism to drive a time-varying cluster potential and an accelerated rate of galaxy-galaxy merger, which may have played different roles on the star formation activities for present-day early- and late-type galaxies in A2255. It is worthwhile to carry out the similar studies to check this effect with the large and complete samples of the galaxies in the clusters at different stages of dynamical evolution.
5 Conclusion
On the basis of the physical parameters derived by Brinchmann et al. (2004b) for the SDSS galaxies, this paper explores the star formation properties of the galaxies in A2255, a merging cluster of galaxies with the intermediate redshift of 0.0806. The main conclusions can be summarized as follows:
1. The continuum break strength at 4000Å () is a better morphology indicator for the cluster galaxies. For selecting the early-type galaxies in high-density regions, the criterion is more effective than the concentration parameter .
2. For the late-type galaxies in A2255, a strong correlation between the EW of H emission line and the normalized SFR by stellar mass is confirmed. This correlation demonstates the reliability of the SFR and stellar mass estimates by the SDSS spectral data.
3. We have investigated the specific SFRs for the early- and late-type galaxies in A2255 as a function of stellar mass () and continuum break strength at 4000 Å (). Generally speaking, the early-type member galaxies have lower SFRs per unit stellar mass than the late-types do. Only two massive late-type galaxies (with ) are found in A2255. The late-type galaxies possess tighter correlations of SFR/ with the assembled stellar mass () and the continuum break strength ().
4. We have observed the morphological dependence in radial distribution of the specific SFRs. The E/S0 galaxies are likely to have an inner decrease in their star formation activities. On the contrary, the inner late-type galaxies tend to have more violent star formation activities. The merging scenario might be the main mechanism to lead to different influences on the star formation activities of present-day early- and late-type galaxies in A2255.
References
- (1) Abadi, M. G., Moore, B., & Bower, R. G. 1999, MNRAS, 308, 947
- (2) Abazajian, K., et al. 2004, AJ, 128, 502
- (3) Abell, G. O. 1958, ApJS, 3, 211
- (4) Baldwin, J., Phillips, M. M., & Terlevich, R. 1981, PASP, 93,5
- (5) Balogh, M. L., & Morris, S. L. 2000, MNRAS, 318, 703
- (6) Balogh, M. L., et al. 2002, MNRAS, 335, 10
- (7) Bell, E. 2003, ApJ, 586, 794
- (8) Brinchmann, J., & Ellis, R. S. 2000, ApJ, 536, L77
- (9) Brinchmann, J., et al. 2004a, MNRAS, 351, 1151
- (10) Brinchmann, J., et al. 2004b, astro-ph/0406220
- (11) Burns, J. O., et al. 1995, ApJ, 446, 585
- (12) Butcher, H., & Oemler, A. 1984, ApJ, 285, 426
- (13) Couch, W. J., et al. 2001, ApJ, 549, 820
- (14) Davis, S. D., & White, R. E. 1998, ApJ, 492, 57
- (15) de Vaucouleurs, G. 1948, Ann. d’Astrophys., 11, 247
- (16) Dressler, A. 1980, ApJ, 236, 351
- (17) Feretti, L., Böhringer, H., Giovannini, G., & Neumann, D. 1997, A&A, 317, 432
- (18) Finn, R. A., Zaritsky, D., & McCarthy D. W. 2004, ApJ, 604, 141
- (19) Gavazzi,G., Boselli, A., Pedotti, P., et al. 2002, A&A, 396, 449
- (20) Gnedin, O. Y., 1999, PhD thesis, Princeton Univ.
- (21) Govoni, F., Murgia, M., Feretti, L., Giovannini, G., Dallacasa, D., & Taylor, G. B. 2005, A&A, 430, L5
- (22) Jansen, R. A., Franx, M., Fabricant, D. 2001, ApJ, 551, 825
- (23) Hopkins, A. M., Miller, C. J., Nichol, R. C., et al. 2003, ApJ, 599, 971
- (24) Koopmann, R. A., & Kenney, J. D. 2004, ApJ, 613, 866
- (25) Lavery, R. J., & Henry, J. P. 1994, ApJ, 426, 524
- (26) MacLow, M. M., & Klessen, R. S. 2004, Rev. Mod. Phys., 76, 125
- (27) Miller, N. A., & Owen, F. N. 2003, AJ, 125, 2427
- (28) Moore, B., Katz, N., Lake, G., Dressler, A., & Oemler, A. 1996, Nature, 379, 613
- (29) Moss, C., & Whittle, M. 1993, ApJ, 407, L17
- (30) Moss, C., Whittle, M., & Pesce, J. E. 1998, MNRAS, 300, 205
- (31) Moss, C., & Whittle, M. 2000, MNRAS, 317, 667
- (32) Kauffmann, G., et al. 2003a, MNRAS, 341, 33
- (33) Kauffmann, G., et al. 2003b, MNRAS, 341, 54
- (34) Kauffmann, G., et al. 2004, MNRAS, 353, 713
- (35) Kennicutt, R. C. 1983, ApJ, 272, 54
- (36) Kennicutt, R. C. 1992, ApJS, 79, 255
- (37) Kennicutt, R. C. Tamblyn, P., & Congdon, C. E. 1993, ApJ, 435, 22
- (38) Kennicutt, R. C. 1998, ARA&A, 36, 189
- (39) Quilis, V., Moore, B., & Bower, R. G. 2000, Science, 288, 1617
- (40) Scodeggio, M., et al. 2002, A&A, 384, 812
- (41) Shimasaku, K., et al. 2001, AJ, 122, 1238
- (42) Strauss, M. A., et al. 2002, AJ, 124, 1810
- (43) Tremonti, C. A., et al. 2004, ApJ, 613, 898
- (44) Whitmore, B. C., Gilmore, D. M., & Jones, C. 1993, ApJ, 407, 489
- (45) Yuan, Q., Zhou, X., & Jiang, Z. J. 2003, ApJS, 149, 53