The effect of non-isothermality on the gravitational collapse of spherical clouds and the evolution of protostellar accretion
Abstract
We investigate the role of non-isothermality in gravitational collapse and protostellar accretion by explicitly including the effects of molecular radiative cooling, gas-dust energy transfer, and cosmic ray heating in models of spherical hydrodynamic collapse. Isothermal models have previously shown an initial decline in the mass accretion rate during the accretion phase of protostellar evolution, due to a gradient of infall speed that develops in the prestellar phase. Our results show that: (1) in the idealized limit of optically thin cooling, a positive temperature gradient is present in the prestellar phase which effectively cancels out the effect of the velocity gradient, producing a near constant (weakly increasing with time) in the early accretion phase; (2) in the more realistic case including cooling saturation at higher densities, may initially be either weakly increasing or weakly decreasing with time, for low dust temperature ( K) and high dust temperature ( K) cases, respectively. Hence, our results show that the initial decline in seen in isothermal models is definitely not enhanced by non-isothermal effects, and is often suppressed by them. In all our models, does eventually decline rapidly due to the finite mass condition on our cores and a resulting inward propagating rarefaction wave. Thus, any explanation for a rapid decline of in the accretion phase likely needs to appeal to the global molecular cloud structure and possible envelope support, which results in a finite mass reservoir for cores.
keywords:
dust - hydrodynamics - ISM: clouds - ISM: molecules - stars: formation1 Introduction
There is good reason to believe that the central regions of gravitationally bound prestellar cores are somewhat cooler than their outer parts. This is implied by the recent far-infrared observations of starless cores (Ward-Thompson, André, & Kirk WardThompson 2002). Furthermore, dust radiative transfer calculations by Zucconi, Walmsley, & Galli (Zucconi 2001) predict that there should be a positive radial dust temperature gradient, with values ranging from K at the core center to K at the core edge. Since the temperature of the gas is coupled to that of the dust for gas densities cm-3 (see e.g. Galli, Walmsley, & Gonçalves Galli 2002), one may expect that the radial distribution of the gas temperature in dense prestellar cores is also characterized by a positive temperature gradient. This implies that an effective polytropic index of the gas may be less than unity, certainly during the prestellar phase.
A positive temperature gradient in the prestellar phase, and continued non-isothermality of a protostellar envelope during the accretion phase may have important consequences for protostellar evolution. Consider the distinct differences in self-similar solutions of spherical protostellar accretion. Although the mass accretion rate onto a protostar is time-independent in isothermal similarity solutions (Shu Shu 1977; Hunter Hunter2 1977), the similarity solutions for gravitational collapse of polytropic spheres (Yahil Yahil 1983; Suto & Silk Suto 1988) show that should increase with time if and decrease with time if . The numerical modeling of the collapse of polytropic spheres by Ogino, Tomisaka, & Nakamura (Ogino 1999) also shows this tendency. If the cooling in an envelope due to direct emission of photons or frequent gas-dust collisions is efficient enough to reduce the effective value of below unity, then the mass accretion rate on to the protostar is expected to increase with time. However, in this case, it is difficult to explain the observations of Bontemps et al. (Bontemps 1996), who have suggested that the mass accretion rate of Class I objects (i.e. protostars in the late accretion stage) falls off by an order of magnitude compared to that of Class 0 objects (i.e. protostars in the early accretion phase). One may then need to appeal to other effects that limit the mass infall, such as a finite mass reservoir (see Vorobyov & Basu VB 2005, hereafter paper I). Conversely, the thermal balance of a protostellar envelope may be dominated by the compressional heating of matter rather than by radiative cooling of gas or dust-gas energy transfer. This could raise the effective value of above unity and perhaps lead to a declining . In this case, at least some of the inferred decline in during the accretion phase may be attributed to non-isothermal effects.
Our motivation for this paper is to model the details of radiative cooling, cosmic-ray heating, and gas-dust energy transfer in a model of hydrodynamic collapse, in order to settle the above issues. In paper I, we studied spherical isothermal collapse and found that although an initially declining is present, due to the gradient of infall speed in the pre-stellar phase, the observational tracks of envelope mass versus bolometric luminosity could only be explained by the effect of an inwardly propagating rarefaction wave due to a finite mass reservoir. In fact, the class I phase of protostellar evolution was identified with the period of rapidly declining occuring after the rarefaction wave reaches the protostar. Here, we investigate whether non-isothermality can change this conclusion in any way. Specifically, can non-isothermality explain any part (or even all) of the inferred drop in during the accretion phase (Bontemps et al. Bontemps 1996)?
The paper is organized as follows. The numerical code used to model the gravitational collapse, as well as the initial and boundary conditions, are briefly discussed in § 2. The temporal evolution of the mass accretion rate for an assumption of optically thin gas is studied in § 3.1. The influence of the radiative cooling saturation and the gas-dust energy transfer (Goldsmith Gold 2001) on the mass accretion rate are investigated in § 3.2. Our main results are summarized in § 4.
2 Model assumptions
We consider the gravitational collapse of spherical non-isothermal clouds composed of molecular hydrogen with a admixture of atomic helium. The evolution is calculated by solving the hydrodynamic equations in spherical coordinates:
| (1) | |||||
| (2) | |||||
| (3) | |||||
where is the gas density, is the radial velocity, is the enclosed mass, is the internal energy density and is the gas pressure. We use the ratio of specific heats to link pressure and internal energy density and modify the energy equation for the effects of cooling and heating. The details of the radiative cooling rate , gas-dust energy transfer rate , and cosmic ray heating are given in § 3. The gas dynamics of a collapsing cloud is followed by solving the usual set of hydrodynamic equations in spherical coordinates using the method of finite-differences with a time-explicit, operator split solution procedure similar to that of the ZEUS-1D numerical hydrodynamics code described in detail in Stone & Norman (Stone 1992). Because the time scales of cooling and heating are usually much shorter than the dynamical time, the energy equation update due to cooling and heating requires an implicit scheme. Explicit schemes usually fail due to a strict limitation on the numerical time step set by the Courant-Friedrich-Lévy condition. Therefore, cooling and heating of gas are treated numerically using Newton-Raphson iterations, supplemented by a bisection algorithm for occasional zones where the Newton-Raphson method does not converge. In order to monitor accuracy, the total change in the internal energy density in one time step is kept below . If this condition is not met, the time step is reduced and a solution is again sought. When the gas number density in the collapsing core exceeds cm-3, we gradually reduce the cooling and heating so as to establish adiabatic evolution with for cm-3. This simplified treatment of the transition to an opaque protostar misses the details of the physics on small scales. Specifically, a proper treatment of the accretion shock and radiative transfer effects is required to accurately predict the properties of the stellar core (see Winkler & Newman Winkler 1980 for a detailed treatment and review of work in this area). However, our method should be adequate to study the protostellar accretion rate, and has been used successfully by e.g. Foster & Chevalier (FC 1993) and Ogino et al. (Ogino 1999) for this purpose. The numerical grid has 600 points which are initially uniformly spaced, but then move with the gas until the central core is formed. This provides an adequate resolution throughout the simulations.
We impose boundary conditions such that the gravitationally bound cloud core has a constant mass and constant volume. The assumption of a constant mass appears to be observationally justified. For instance, the observations by Bacmann et al. (Bacmann 2000) have shown that in at least some cases, such as L1544 in Taurus, individual pre-stellar clouds are characterized by sharp edges defining typical outer radii pc, implying that these prestellar clouds represent finite reservoirs of mass for subsequent star formation. Physically, this assumption may be justified if the core decouples from the rest of a comparatively static, diffuse cloud due to a shorter dynamical timescale in the gravitationally contracting central condensation than in the external region. A specific example of this, due to enhanced magnetic support in the outer envelope, is found in the models of ambipolar-diffusion induced core formation (see, e.g. Basu & Mouschovias Basu95 1995). The constant volume condition of a collapsing cloud core is mainly an assumption of a constant radius of gravitational influence of a subcloud within a larger parent diffuse cloud.
The radial gas density distribution of a self-gravitating isothermal cloud that is in hydrostatic equilibrium can be conveniently approximated by a modified isothermal sphere, with gas density
| (4) |
(Binney & Tremaine BT 1987), where is the central density and is the radial scale length. We choose a value , so that the inner profile is close to that of a Bonnor-Ebert sphere, is comparable to the Jeans length, and the asymptotic density profile is twice the equilibrium singular isothermal sphere value ). The latter is justified on the grounds that core formation should occur in a somewhat non-equilibrium manner (an extreme case is the Larson-Penston flow, in which case the asymptotic density profile is as high as ), and also by observations of protostellar envelope density profiles that are often overdense compared to (André, Motte, & Belloche Andre 2001). We also add a (moderate) positive density perturbation of a factor (i.e. the initial gas density distribution is increased by a factor of 1.7) to drive the cloud (especially the inner region which is otherwise near-equilibrium) into gravitational collapse. For the purpose of comparison with isothermal simulations, we determine the size of the central flat region assuming a constant temperature K, which yields pc.
The choice of central density , the size of the central flat region , the amplitude of density perturbation , and outer radius determines the cloud mass and the radial density distribution. The initial gas temperature distribution is then obtained by solving the equation of thermal balance . We study many different cloud masses - six models are presented in this paper. Table 1 shows the parameters for these model clouds. The adopted central number density cm-3 is roughly an order of magnitude lower than is observed in prestellar cores (Ward-Thompson et al. WT 1999). Considering that the observed cores may already be in the process of slow gravitational contraction, our choice of is justified for the purpose of describing the basic features of star formation. In all six models, the outer radius is chosen so as to form gravitationally unstable prestellar cores with central-to-surface density ratio (since our initial states are similar to Bonnor-Ebert spheres). In models NI1, NI3, and NI5, and by implication , whereas in models NI2, NI4, and NI6 and . Models NI2, NI4, and NI6 thus represent very extended prestellar cores; the ‘NI’ stands for nonisothermal.
| Model | 1 | |||||
|---|---|---|---|---|---|---|
| NI1 | 0.13 | 19.4 | 4.3 | 5 | – | |
| NI2 | 0.4 | 173 | 13.2 | 20 | – | |
| NI3 | 0.13 | 19.4 | 4.3 | 5 | 10 | |
| NI4 | 0.4 | 173 | 13.2 | 20 | 10 | |
| NI5 | 0.13 | 19.4 | 4.3 | 5 | 6 | |
| NI6 | 0.4 | 173 | 13.2 | 20 | 6 |
-
1
All densities are in units of cm-3, scales in pc, masses in , and temperatures in K. is the cloud mass, and is the dust temperature.
3 Results of cloud collapse
In this section we study how the non-isothermality of gas can affect the temporal evolution of the mass accretion rate. Our results should be interpreted in the context of models of one-dimensional radial infall. Hence, our calculated mass accretion rates really represent the infall onto the inner protostellar disk that would be formed due to rotation. Since disk masses are not observed to be greater than protostellar masses, it is likely that the protostellar accretion is at least proportional to the mass infall on to the disk. The mass accretion rate is computed at a radial distance 600 AU=0.003 pc.111We note that the accretion rate is not expected to vary significantly in the range 0.1 AU -1000 AU, according to radiation hydrodynamic simulations of spherical collapse by Masunaga & Inutsuka (MI 2000). We neglect heating due to the central source at this distance. First, we consider a simplified assumption of optically-thin gas heated only by the cosmic rays. We further take into account the saturation of the radiative cooling of gas at cm-3 and the gas-dust energy transfer (Goldsmith Gold 2001).
3.1 Optically thin limit
Our optically thin model serves as an example limiting case that builds our intuition about the effect of temperature gradients in a cloud core and serves as a comparison to the more realistic cooling models presented in § 3.2. In this idealized limit, the radiative cooling of gas can be expressed as
| (5) |
where is the radiative cooling rate in ergs cm3 s-1 and is the number density. For the temperature dependence of the radiative cooling rate we have implemented the cooling function of Wada & Norman (WN 2001) (their Fig. 1) for solar metallicity and gas temperature K. The cooling function simplifies the implementation of cooling by collecting the effects of various coolants. The cooling processes taken into account are: (1) vibrational and rotational excitation of ; (2) atomic and molecular cooling due to fine-structure emission of C and O; (3) rotational line emission of CO. We do not consider cooling due to C+, since the complete conversion of C+ to CO in cloud cores occurs when the number density rises beyond cm-3 (Nelson & Langer NL 1997). Moreover, this chemical change appears to have little effect on the dynamics of self-gravitating cloud cores. This is because the cooling rate of C+ is similar to that of CO, particularly in the density-temperature region typical for the cloud cores (Nelson & Langer NL 1997).
Since we are interested in well-shielded regions, we can ignore the direct photoelectric heating of gas by the incident ultraviolet radiation. The cosmic-ray heating is thus the only process that heats the gas directly. We adopt the cosmic-ray heating per unit volume (Goldsmith Gold 2001)
| (6) |
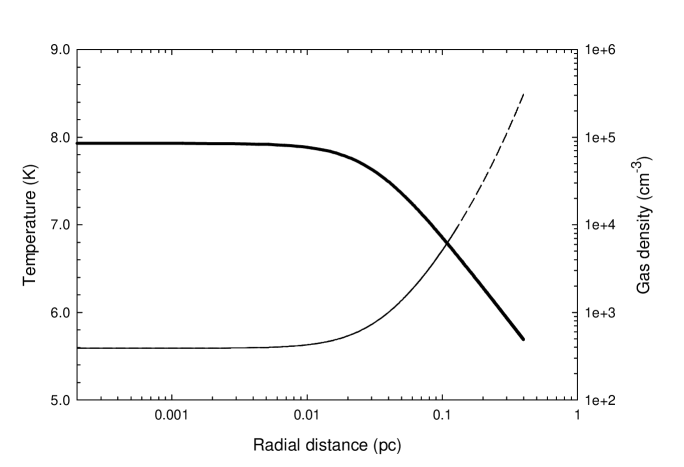
The initial gas temperature distribution is obtained by solving the equation of thermal balance for the adopted radial gas density profile of model NI1. The solid line in Fig. 1 shows the resulting gas temperature . It varies from 5.6 K in the cloud’s center to 7 K at the outer edge for the cloud with pc. For a larger cloud of radius pc (model NI2), the temperature grows from 5.6 K in the center to 8.5 K at the outer edge, as shown by the dashed line in Fig. 1.
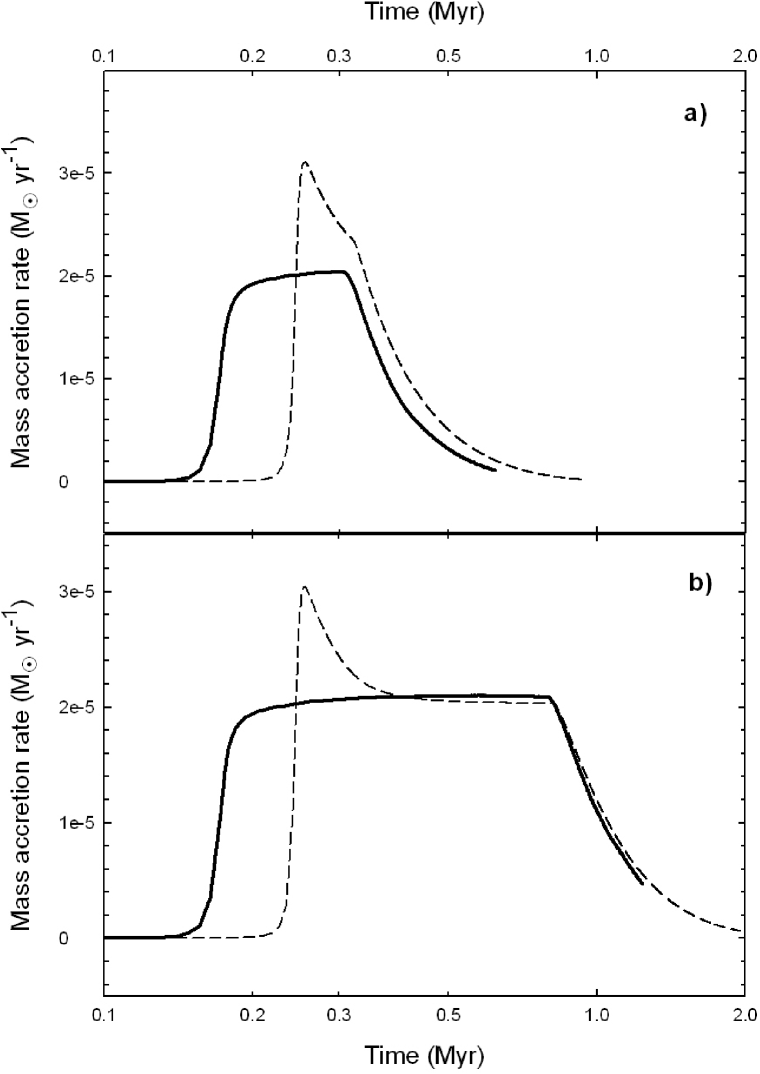
After the collapse is initiated, some aspects of the temporal evolution are shown in Fig. 2. The solid lines in Figs. 2a and 2b show the evolution of the mass accretion rate at a radial distance of 600 AU from the center for models NI1 and NI2, respectively. The accretion rates of the corresponding isothermal clouds ( K) are plotted by the dashed lines for comparison. An obvious difference is seen in the behaviour of of the non-isothermal clouds as compared to that of the isothermal ones: no peak in the mass accretion rate is seen at the time of the hydrostatic core formation ( Myr). This is because the effect of progressively warmer layers falling onto the protostar cancels the effect of inner mass shells having greater initial infall speeds; we discuss this effect again in § 3.2.2. Instead, of the non-isothermal clouds grows monotonically and appears to stabilize at yr-1 if the size of the cloud is sufficiently large (model NI2). Note that the positive temperature gradient developing in the non-isothermal pre-collapse clouds shortens the duration of the pre-core-formation phase by Myr as compared to that of the isothermal clouds. A sharp drop of the mass accretion rate at Myr in model NI1 (at Myr in model NI2) is due to a rarefaction wave propagating inward from the cloud’s outer edge (see Vorobyov & Basu VB 2005 for details). In case of a larger cloud of pc (model NI2), it takes a longer time of Myr for the rarefaction wave to reach the innermost regions. As a consequence, model NI2 exhibits a longer period of nearly-time-independent mass accretion rate than model NI1. At the time when the rarefaction wave reaches the radius of AU, roughly half of the envelope mass has accreted on to the central hydrostatic core.
3.2 Cooling saturation at higher densities
Calculations of thermal balance in dark, well-shielded molecular cores by Goldsmith & Langer (Gold2 1978) and Goldsmith (Gold 2001) have shown that the cooling from main coolants such as CO, , , C, and others, is proportional to only at low densities of molecular hydrogen, i.e. cm-3. At cm-3, the cooling from these species saturate (see e.g. Goldsmith Gold 2001). This is because the transitions that can contribute to the cooling are thermalized due to the combination of a higher collision rate and radiative trapping. Noticeable exceptions are the cooling from and CS, which do not saturate even at densities cm-3 due to a sufficiently large spontaneous decay rate. As a result, the total cooling has a complicated dependence on the temperature and density of molecular hydrogen, expressed by Goldsmith (Gold 2001) as
| (7) |
where and are given in Table 2 of Goldsmith (Gold 2001) for the undepleted (standard) molecular abundances.
As in § 3.1, we assume that the cosmic-ray heating is the only mechanism that heats the gas directly. The dust grains heated by the diffuse visual-IR radiation field may be an additional source of indirect gas heating/cooling depending on the difference between the gas and dust temperatures. For the gas-dust energy transfer, we adopt the expression given in Goldsmith (Gold 2001),
| (8) | |||||
where and are the temperatures of gas and dust, respectively. When the dust temperature is greater than that of the gas, the dust heats the gas and vice versa.
3.2.1 Initial gas temperature profile
The radial distribution of the gas temperature depends on the adopted temperature of dust. As demonstrated by Zucconi et al. (Zucconi 2001), the dust temperature in the prestellar cores is sensitive to the center-to-edge visual extinction of a parent cloud. We consider a simple model in which the dust temperature is constant throughout the pre-stellar core and equal to 6 K or 10 K. These two limits correspond to cores that are heavily shielded () or only moderately shielded () from the external radiation.
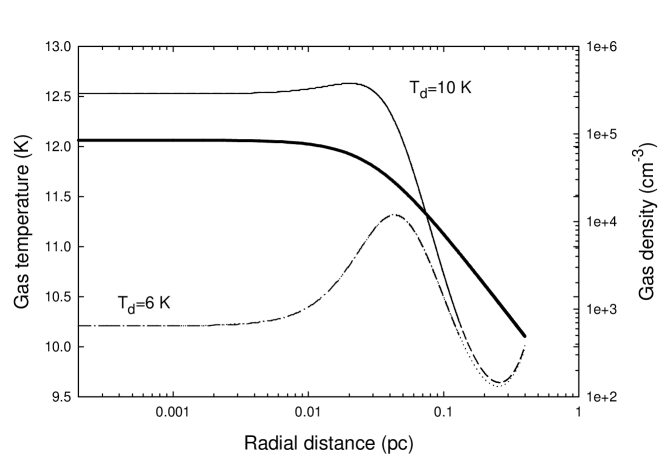
The initial temperature distribution of gas is obtained by solving the equation of thermal balance . In model NI3, the gas temperature decreases from 12.6 K near the cloud’s center to 10.3 K at the outer edge ( pc) as shown in Fig. 3 by the thin solid line. The development of the negative temperature gradient in the 0.03-0.13 pc range is due to radiative cooling saturation at higher densities cm-3, where the cosmic ray heating dominates the radiative cooling. At the same time, the gas-dust energy transfer becomes an efficient coolant at cm-3 and the gas temperature stabilizes at K in the innermost region pc. In the case of a larger cloud with pc (model NI4), the gas temperature exhibits a more complicated behaviour as shown in Fig. 3 by the dashed line (note that it merges with the thin solid line at pc). It decreases from 12.6 K near the cloud’s center and reaches a minimum value of 9.6 K at pc. Further out, the gas temperature grows again to 10.0 K at pc. The latter indicates that the gas becomes effectively optically thin at cm-3 and the radial temperature distribution of gas develops a positive temperature gradient, as was indeed found in § 3.1 for the optically thin radiative cooling.
For a lower value of the dust temperature K, the initial radial distribution of gas temperature is shown in Fig. 3 by the dotted-dashed and dotted lines for the clouds of pc (model NI5) and pc (model NI6), respectively. The dust-gas energy transfer reduces the gas temperature in the cloud’s innermost regions by K as compared to the previously considered case of K. At the lower densities, the gas temperature is mainly determined by the balance of radiative cooling of gas and cosmic ray heating. As a consequence, the gas temperature profiles for both adopted values of become very similar for cm-3.
3.2.2 Mass accretion rate
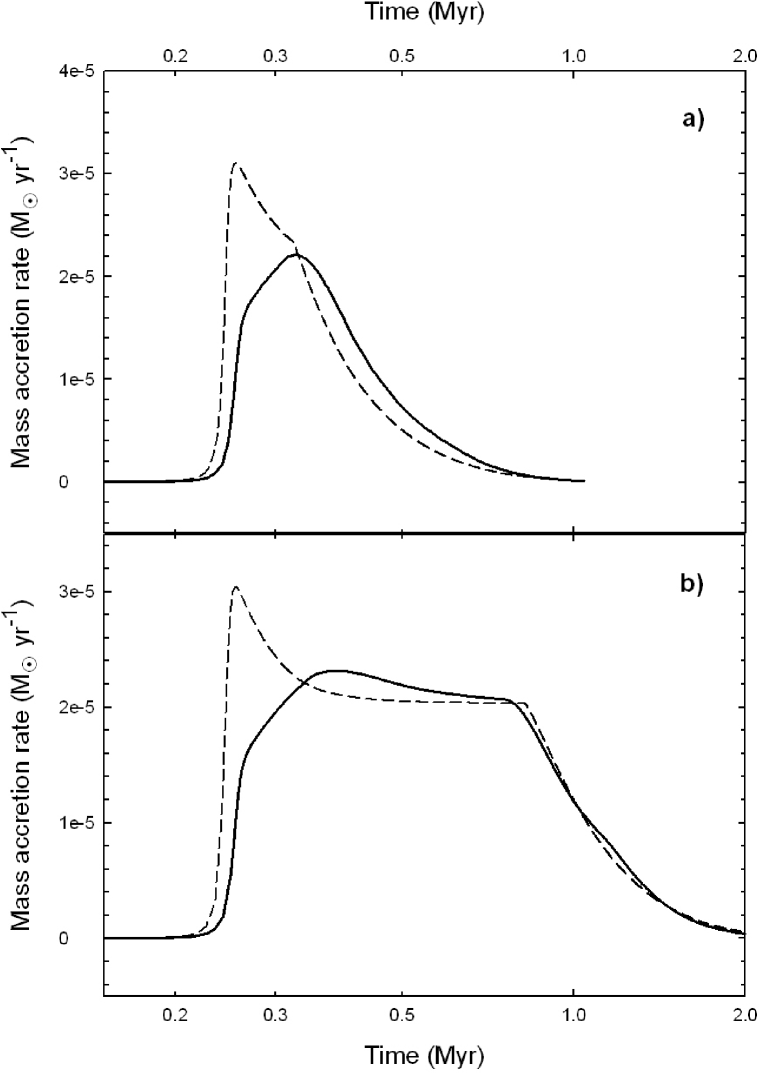
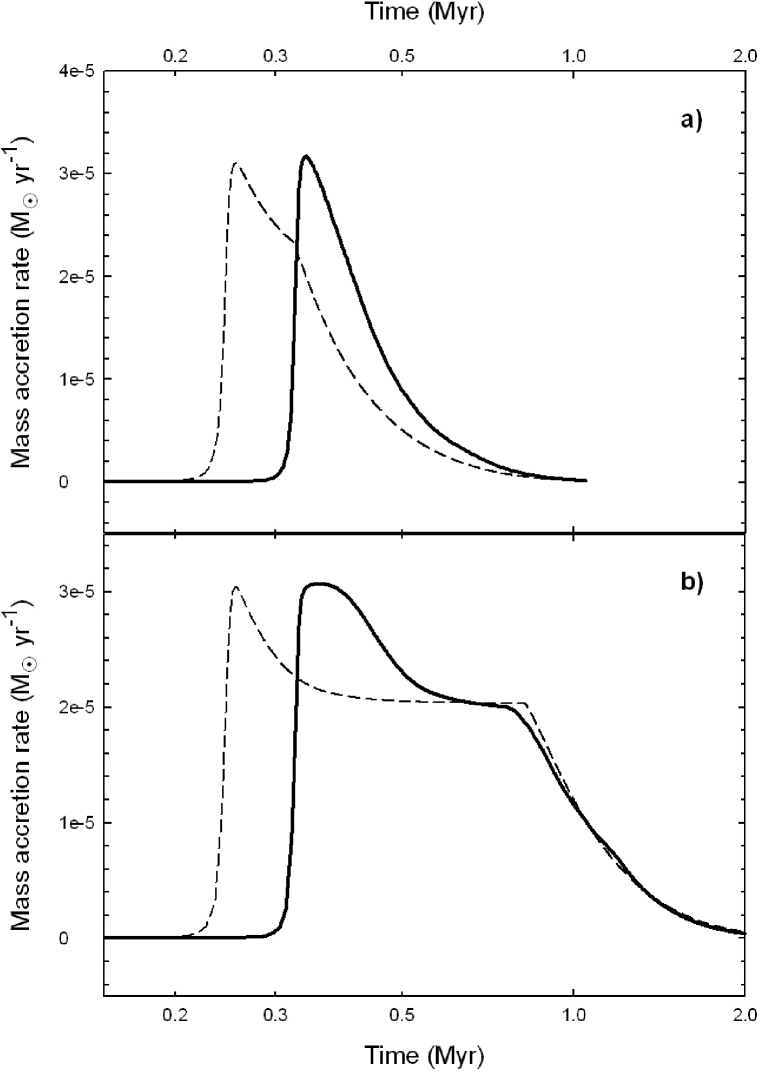
The solid lines in Fig. 4a and 4b show the temporal evolution of the mass accretion rate for models NI5 and NI6, respectively. The corresponding accretion rates of isothermal ( K) clouds are plotted by the dashed lines for comparison. At the lower dust temperature K, the accretion rate resembles that of the optically thin cloud: has no well-developed peak at the time of the hydrostatic core formation at Myr. Thus, the gas-dust energy exchange acts as an effective thermostat; the gas collisionally transfers its energy to the dust instead of directly radiating it by photon emission. We note here that such low dust temperatures of K may indeed be present in dense pre-stellar cores as suggested by the self-consistent modeling of Zucconi et al. (Zucconi 2001) and Galli et al. (Galli 2002).
The self-similar solutions for the accretion phase of isothermal cloud collapse (Shu Shu 1977; Hunter Hunter2 1977) predict that the mass accretion rate is time-independent and that
| (9) |
where is the isothermal sound speed. The coefficient is equal to 0.975 in the Shu solution, whereas in the Hunter (Hunter2 1977) extension (to the accretion phase) of the Larson (Larson 1969)-Penston (Penston 1969) solution, . This difference is due to the different velocity and density radial profiles of gas at the time when the central hydrostatic core forms: they are and in the Shu solution and and in the Larson-Penston-Hunter solution. However, numerical simulations of both isothermal and non-isothermal collapse show that the gas velocity at the time of stellar core formation is not constant with radius; the absolute value of gas velocity is only approaching near the hydrostatic core, while decreasing at larger radii and converging to zero at the outer boundary. As a result, the peak in appears right after the formation of a central hydrostatic stellar core.
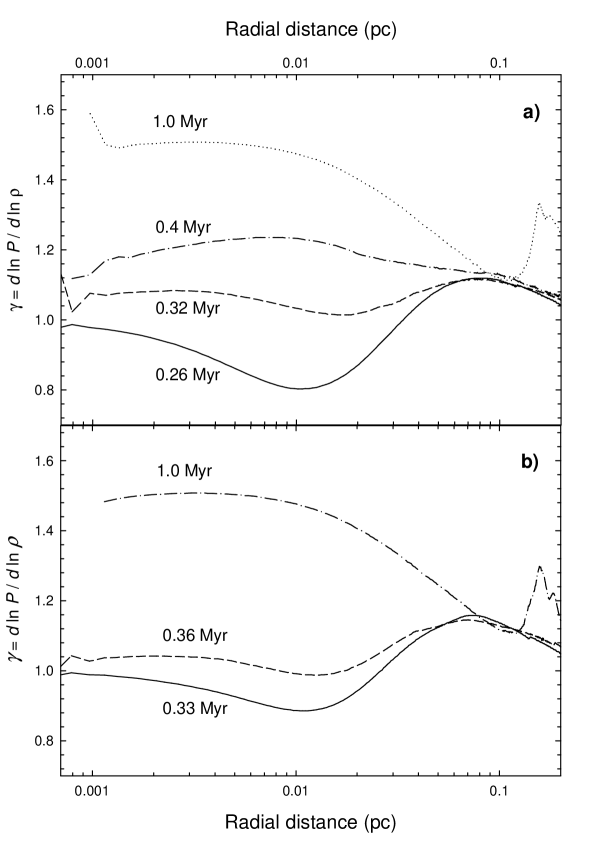
The absence of the peak in models NI5 and NI6 can be understood if one considers the local polytropic index obtained from the model’s known radial distributions of pressure and density. Fig. 5a plots the radial distribution of obtained for model NI6 at four different evolutionary times. Shortly after the formation of the hydrostatic core at Myr, the gas flow in the inner 0.04 pc is characterized by . Since the polytropic law implies that during the collapse, and the gas density in the infalling envelope decreases with radius as , the gas temperature and the associated sound speed will increase with radius as long as . Because the similarity solutions (see Eq. 9) predict that is directly proportional to the sound speed, the mass accretion rate will increase with time, as progressively warmer layers of gas (characterized by increasing ) fall onto the central hydrostatic core. As a result, the increase of due to the strong positive temperature gradient appears to compensate the decrease in due to the non-constant radial velocity profile and the mass accretion rate in this early phase becomes a monotonically growing function of time as shown by the solid lines in Fig. 4a. At Myr the polytropic index in the infalling envelope becomes greater than unity throughout the infalling envelope. At roughly the same time, the accretion rate attains the maximum value of yr-1. Further evolution is characterized by a slowly declining . In this intermediate phase, the mass accretion rate appears to converge to that of the isothermal cloud. The late phase of accretion ( Myr) is characterized by a rapid and terminal decline when the rarefaction wave caused by a finite mass reservoir arrives at the center. This effect was discussed in detail in paper I. The transition from the early phase to late phase accretion occurs smoothly for the smaller clouds (i.e. model NI5), but the intermediate phase of slowly declining mass accretion is still clearly visible for larger clouds in which the effect of the rarefaction wave is delayed due to a larger radius.
The solid lines in Fig. 6a and 6b show the temporal evolution of the mass accretion rate for models NI3 and NI4, respectively. The corresponding accretion rates for isothermal ( K) clouds are plotted by the dashed lines. At a higher dust temperature K, the accretion rate resembles that of the isothermal cloud: a well-developed peak is visible at the time of hydrostatic core formation Myr. Again, as in the case of lower dust temperature, we consider the radial profiles of local polytropic index obtained from the model’s known pressure and density profiles. Fig. 5b shows the radial distribution of in model NI4 at three times. Shortly after the formation of hydrostatic core at Myr, the gas flow in the inner envelope pc has local polytropic index that is only slightly below unity (). As a consequence, the very weak positive temperature gradient is not capable of compensating the decrease in the mass accretion rate due to the non-constant radial velocity profile and the behaviour of the accretion rate is qualitatively similar to that of the isothermal cloud. At Myr the polytropic index grows above unity in the infalling envelope, as is seen from the dashed line in Fig. 5b. In this phase, the accretion rate declines due to both the combined action of cooling and heating and the non-constant radial velocity profile developed in the prestellar phase. However, as in the case of lower dust temperature, a sharp and terminal decline of accretion at the late protostellar stages Myr is due to the rarefaction wave rather than to any other effect.
3.2.3 Evolution of gas temperature
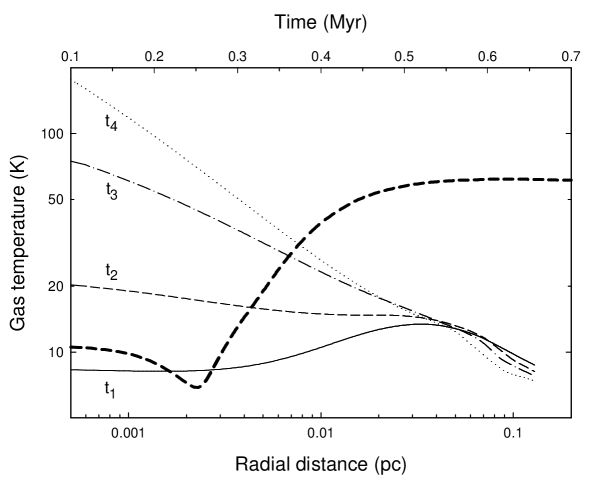
In the post-core-formation epoch, the gas is virtually in a free-fall motion near the central hydrostatic core and the characteristic dynamical time becomes comparable or even shorter than that of the cooling. As a result, the flow becomes nearly adiabatic with and the gas temperature in the central region grows with time. The latter tendency is clearly seen in Fig. 7, where we plot the radial gas temperature distribution in model NI5 obtained at four different evolutionary times. The initial radial gas temperature distribution shown by the dotted-dashed line in Fig. 3 is characterized by a mild increase towards the outer edge of a cloud, so that it reaches a maximum of K at pc and decreases to roughly the central value of K at the outer edge pc. This behaviour of the gas temperature remains qualitatively similar until and shortly after the formation of the central hydrostatic core at Myr. However, in the post-core-formation stage, the radial distribution of the gas temperature develops a negative gradient, the slope of which gradually grows with time as shown in Fig. 7 by the thin dashed, dotted-dashed and dotted lines for , 0.4, and 0.5 Myr, respectively. The development of the negative temperature gradient is due to compressional heating that overtakes other heating/cooling processes at pc. We note that due to some residual cooling in the interior of the infalling envelope, the polytropic index tends to a value of 3/2 instead of 5/3. The thick dashed line in Fig. 7 shows the temporal evolution of the gas temperature at the radial distance of 600 AU from the cloud’s center. The initial decrease of the gas temperature prior to the formation of the central hydrostatic core is followed by an increase and then a saturation at K in the post-core-formation stage.
4 Conclusions
We have numerically followed the gravitational collapse of spherical pre-stellar cores of finite mass and volume down to the protostellar stage. The influence of the cooling and heating on the temporal evolution of the mass accretion rate has been investigated. We summarize our results as follows.
(i) Optically thin gas heated only by cosmic rays. In a simplified approach where the radiative cooling of gas is proportional to the square of the gas density, the mass accretion rate monotonically increases with time and appears to attain a constant value after the formation of the hydrostatic core, if the size of a cloud is sufficiently large. This temporal evolution of is qualitatively different from that found in isothermal simulations, which show the development of a peak and subsequent decline in shortly after the formation of the hydrostatic core (see e.g. Hunter Hunter2 1977; Foster & Chevalier FC 1993; Ogino et al. Ogino 1999; paper I). The later evolution of the mass accretion rate, after roughly half of the envelope has accreted on the central hydrostatic core, shows a sharp drop due to the gas rarefaction wave propagating inward from the cloud’s outer edge. This drop in is a direct consequence of the assumed finite mass and volume of the gravitationally bounded non-isothermal cloud.
(ii) The effects of radiative cooling saturation and gas-dust energy transfer. In a more realistic approach where the radiative cooling of the gas saturates at cm-3 (Goldsmith Gold 2001) and the gas-dust energy transfer is taken into account, the temporal evolution of the mass accretion rate depends on the dust temperature. If the dust temperature is sufficiently low ( K), which roughly corresponds to the gravitationally bounded subcloud being deeply embedded within a parent diffuse (i.e. non-gravitating) molecular cloud and heavily shielded from the interstellar radiation field (), the gas behaves as being effectively optically thin due to efficient cooling by dust. Specifically, no well-developed peak in is observed shortly after the formation of the hydrostatic core, and the temporal evolution of the mass accretion rate is qualitatively similar to that considered in the optically thin case. The absence of the peak is due to the positive temperature gradient developing in the cloud’s innermost regions before and shortly after the formation of the hydrostatic core. This positive temperature gradient effectively increases the mass accretion rate with time and appears to compensate its decrease due to the non-uniform radial gas velocity profile. In the opposite case of a subcloud being only moderately shielded from the interstellar radiation field with and K, the temporal evolution of the mass accretion rate is qualitatively similar to that of the isothermal ( K) cloud.
Irrespective of the effects of radiative cooling and dust temperature, the later evolution of the mass accretion rate, after roughly half of the envelope has accreted onto the hydrostatic core, is characterized by a fast decline due to a rarefaction wave associated with the finite mass reservoir. In paper I, we associated this phase (which has a temporally declining bolometric luminosity ) with the empirically defined class I phase of protostellar evolution. The inclusion of non-isothermal effects in this paper does not change this conclusion. We have shown that the initial decline in is weakened or may even be absent in a model with a realistic treatment of cooling. Therefore, the ultimate decline in due to the finite mass reservoir is even more necessary to explain the class I phase.
Our simulations also demonstrate that the evolution of pre-stellar cores down to the late protostellar stage cannot be described by a polytropic law with a fixed index . Instead, before and shortly after the formation of the hydrostatic core, the local polytropic index in the inner envelope pc is below unity and , mainly due to effective cooling by the dust. However, in the post-core-formation epoch, the gas is virtually in a free-fall near the central hydrostatic core and the compressional heating overtakes other energetic processes. As a consequence, the flow becomes nearly adiabatic with and the gas in the accreting envelope attains a negative temperature gradient.
Acknowledgments
EIV gratefully acknowledges present support from a CITA National Fellowship and past support by the NATO Science Fellowship Program administered by the Natural Sciences and Engineering Research Council (NSERC) of Canada. SB was supported by a research grant from NSERC.
References
- 1 André, P., Motte, F., Belloche, A., 2001, in Montmerle, T., André, P., eds, ASP Conf. Ser. Vol. 243, From Darkness to Light. Astron.Soc.Pac., San Francisco, p. 209
- 2 Bacmann, A., André, P., Puget, J. L. et al., 2000, A&A, 314, 625
- 3 Basu, S., Mouschovias, T. Ch., 1995, ApJ, 453, 271
- 4 Binney, J., Tremaine, S., 1987, Galactic Dynamics. Princeton Univ. Press, Princeton
- 5 Bonnor, W. B., 1956, MNRAS, 116, 351
- 6 Bontemps, S., André, P., Terebey, S., Cabrit, S., 1996, A&A, 311, 858
- 7 Ebert, R., 1955, Z. Astrophys., 37, 217
- 8 Foster, P. N., Chevalier, R. A., 1993, ApJ, 416, 303
- 9 Galli, D., Walmsley, M., Gonçalves, J., 2002, A&A, 394, 275
- 10 Goldsmith, P. F., Langer, W. D., 1978, ApJ, 222, 881
- 11 Goldsmith, P. F., 2001, ApJ, 557, 736
- 12 Hunter, C., 1977, ApJ, 218, 834
- 13 Larson, R. B., 1969, MNRAS, 145, 271
- 14 Masunaga, H., Inutsuka, S., 2000, ApJ, 531, 350
- 15 Nelson, R. P., Langer, V. D., 1997, ApJ, 482, 796
- 16 Ogino, S., Tomisaka, K., Nakamura, F., 1999, PASJ, 51, 637
- 17 Penston, M. V., 1969, MNRAS, 144, 425
- 18 Shu, F. H., 1977, ApJ, 214, 488
- 19 Stone, J. M., Norman, M. L., 1992, ApJS, 80, 753
- 20 Suto, Y., Silk, J., 1988, ApJ, 326, 527
- 21 Vorobyov, E. I., Basu, S., 2005, MNRAS, in press (astro-ph/0504055)
- 22 Wada, K., Norman, C., 2001, ApJ, 547, 172
- 23 Ward-Thompson, D., André, P., Kirk, J. M., 2002, MNRAS, 329, 257
- 24 Ward-Thompson, D., Motte, F., André, P., 1999, MNRAS, 305, 143
- 25 Winkler, K.-H. A., Newman, M. J., 1980, ApJ, 236, 201
- 26 Yahil, A., 1983, ApJ, 265, 1047
- 27 Zucconi, A., Walmsley, C. M., Galli, D., 2001, A&A 376, 650