The Araucaria Project: The effect of blending on the Cepheid distance to NGC 300 from Advanced Camera for Surveys images1
Abstract
We have used the Advanced Camera for Surveys aboard the Hubble Space Telescope to obtain , and single-epoch images of six fields in the spiral galaxy NGC 300. Taking advantage of the superb spatial resolution of these images, we have tested the effect that blending of the Cepheid variables studied from the ground with close stellar neighbors, unresolved on the ground-based images, has on the distance determination to NGC 300. Out of the 16 Cepheids included in this study, only three are significantly affected by nearby stellar objects. After correcting the ground-based magnitudes for the contribution by these projected companions to the observed flux, we find that the corresponding Period-Luminosity relations in , and the Wesenheit magnitude are not significantly different from the relations obtained without corrections. We fix an upper limit of 0.04 magnitudes to the systematic effect of blending on the distance modulus to NGC 300.
As part of our HST imaging program, we present improved photometry for 40 blue supergiants in NGC 300.
Subject headings:
Cepheids — distance scale — galaxies: distances and redshifts — galaxies: individual (NGC 300) — galaxies: stellar content1. Introduction
Cepheid variables continue to play an important role in defining the extragalactic distance scale, as demonstrated by the improvements obtained in the past few years in the calibration of far-reaching secondary distance indicators by the HST Key Project (Freedman et al. 2001) and the growing samples of variables with high-quality ground-based light curves located in galaxies of the Local Group and out to distances of a few Mpc (Udalski 1999, Pietrzyński et al. 2002, 2004). Continuing efforts are spent to solve some of the pending issues related to sources of potential systematic errors in the distances derived from the Cepheid Period-Luminosity (PL) relation. Among the recent work, we recall the confirmation, based on interferometric data (Nordgren et al. 2002), of the Fouqué & Gieren (1997) calibration of the infrared surface brigthness technique, which allows to derive accurate geometric distances to Cepheids. This result, together with the availability of excellent near-infrared photometry of Cepheids in the LMC, allowed Gieren et al. (2005a) to exclude a suspected dependence of the slope of the Cepheid PL relation on the metallicity of the host galaxy.
Systematic uncertainties can affect the extragalactic distances based on Cepheids in additional, subtle ways. The problem of the metallicity dependence of the zero point of the PL relation, for example, has eluded a satisfying solution for a long time, generating controversies on the magnitude and direction of the effect. Among the most recent reassessments of the problem is the work by Sakai et al. (2004), who found that a change in metal abundance by one order of magnitude has an effect on the distance modulus derived from PL relations in the optical and passbands of magnitudes.
Blending of Cepheids with unresolved projected companions is also a source of concern, because our increasing inability to spatially resolve and account for such companions with increasing distances could lead to systematically underestimate distances to galaxies. Stanek & Udalski (1999), followed by Mochejska et al. (2000, 2001) as part of the DIRECT project on M31 and M33, drew the attention to the effects of blending on the distances to the HST Key Project galaxies, which have been derived neglecting this effect. By extrapolating the results obtained in the Local Group galaxies, these authors suggested an upward correction to the distance moduli, exceeding 0.3 magnitudes at 25 Mpc, implying that the Hubble constant could be overestimated by 5%–10%. These results have been questioned by Gibson et al. (2000) and Ferrarese et al. (2000), on the basis of artificial star experiments and looking for distance-dependent residuals in the Tully-Fisher relation for the Key Project galaxies. A maximum bias due to blending of magnitudes was found.
In the Araucaria Project111http://ifa.hawaii.edu/bresolin/Araucaria/ (Gieren et al. 2001) we are endeavoring to obtain accurate Cepheid distances to galaxies in the Local Group and in the Sculptor Group, and to decrease the uncertainties associated with some of the most important surces of systematic errors. Stellar spectroscopy in the target galaxies provides us with metal abundances of blue supergiants, which complement H ii region oxygen abundances, and which are necessary in order to constrain the metallicity dependence of the PL relation. One of the key target galaxies in the Araucaria Project is NGC 300 in Sculptor. For this galaxy we have an excellent characterization of both the Cepheid (Pietrzyński et al. 2002) and the blue supergiant (Bresolin et al. 2002) populations. Follow-up work allowed us to measure an accurate distance from optical and near-infrared photometry (Gieren et al. 2004, 2005b) and to derive the stellar metal abundance gradient of NGC 300 (Urbaneja et al. 2005). While we had reasons to believe that blending of Cepheids with nearby stars has a negligible impact on our distance to NGC 300 (Gieren et al. 2004, hereafter G04), a direct test made on high-resolution HST images was still desirable. We therefore obtained data with the Advanced Camera for Surveys (ACS), with the goal of improving the ground-based photometry of a significant sample of Cepheids (for the blending problem) and blue supergiants (for the use of these stars as independent stellar distance indicators, Kudritzki et al. 2003) in NGC 300.
At a distance of Mpc, one ACS pixel (005) corresponds to pc. The HST images discussed in this paper therefore allow us to follow a straightforward empirical approach to test in detail for the presence of projected luminous stars that could affect the photometry of the Cepheid variables included in the PL relation. The paper is organized as follows: we discuss the ACS data and the stellar photometry in §2, and the photometry of the Cepheids in particular, together with the comparison with the ground-based light curves, in §3. We describe the method adopted to quantify the effects of blending on the Cepheid photometry in §4. The impact of blending on the Cepheid PL relation is presented in §5. We briefly discuss and summarize our results in §6. We include in the Appendix a table with the HST photometry of 40 blue supergiants.
2. Data
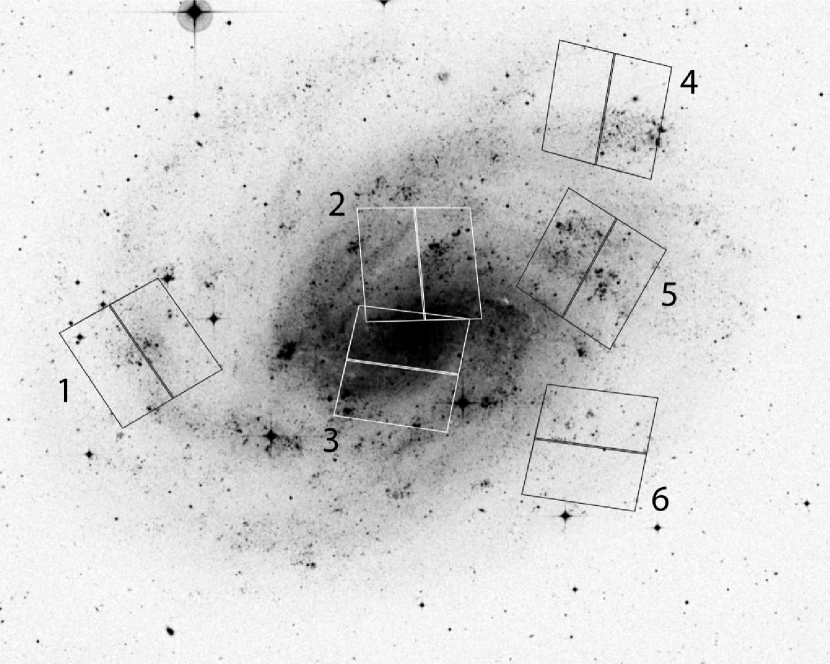
Observations of six ACS fields in NGC 300 were obtained during HST Cycle 11 as part of program GO-9492 (PI: Bresolin) from July 2002 to December 2002 (see Table 1 for a journal of the observations). Wide Field Camera images, approximately 202″202″ on the sky, were obtained through the , and filters. The exposure time was 1080 seconds in the and filters, subdivided into three dithered exposures. Four exposures, totalling 1440 seconds, were obtained through . These exposures were accommodated in two-orbit HST visits for each field. The goal of the program was to obtain accurate photometry of a significant fraction of the blue supergiants and Cepheid variables studied in our previous spectroscopic and photometric surveys in NGC 300 (Bresolin et al. 2002, Pietrzyński et al. 2002). The fields were therefore selected in order to sample the population of supergiants and Cepheids at different galactocentric distances. Fig. 1 shows the ACS footprints of the six fields on a DSS image of the galaxy.
| ACS Field no. | UT date | JDaaMean Julian Date for the two-orbit HST visits |
|---|---|---|
| 1 | 2002 Jul 17 | 2,452,472.85 |
| 2 | 2002 Jul 19 | 2,452,474.78 |
| 3 | 2002 Sep 28 | 2,452,545.63 |
| 4 | 2002 Jul 21 | 2,452,476.79 |
| 5 | 2002 Dec 25 | 2,452,633.12 |
| 6 | 2002 Sep 26 | 2,452,543.56 |
Stellar photometry was carried out on the pipeline-processed images using the DOLPHOT222http://purcell.as.arizona.edu/dolphot/. (version 1.0) package, an adaptation of HSTphot (Dolphin 2000) to ACS images. For our final photometry, obtained with the available pre-computed Point Spread Functions, we retained all objects that were identified as well-fitted stars in all three filters. In order to allow a meaningful comparison with our previous ground-based photometry, we have transformed the magnitudes from the HST system to BVI, following the transformation equations published by Sirianni et al. (2005), although this procedure necessarily introduces additional uncertainty in the photometric measurements.
A comparison between the ACS and the ground-based magnitudes for the 40 blue supergiants in common with Bresolin et al. (2002) reveals no significant zero-point offset (Fig. 2, top). A few stars appear slightly fainter in the ACS photometry, as expected from the higher spatial resolution attained from HST, which resolves some of the supergiants from projected close companions, however the level of contamination is small for supergiant stars (). We note that at least part of the scatter in this plot is likely due to the stochastic variability (at the 0.1 mag level) detected for the blue supergiant stars in NGC 300 by Bresolin et al. (2004). The fact that the color difference plots (lower two panels in Fig. 2) show a smaller scatter supports this conclusion (the variability is similar in the different passbands). No magnitude offset is seen in the color comparison (bottom panel of Fig. 2; 24 stars are shown, due to the smaller number of stars with ground-based magnitudes relative to and ). A significant ( mag) zero-point difference is present in (middle panel). This discrepancy appears to be due to a problematic calibration of the filter of our ground-based photometry, which was already noted by Bresolin et al. (2004). The main outliers in the color comparison are due to extreme red colors in the ground-based photometry (stars C-5 and C-11), whereas the HST photometry provides more consistent colors for their early-B spectral types and their .
A table summarizing the ACS photometry of the blue supergiants is presented in the Appendix.
| ID | ACS field | |||
|---|---|---|---|---|
| cep004 | 2 | 21.07 | 19.97 | 18.98 |
| cep007 | 5 | 21.26 | 20.48 | 19.71 |
| cep015 | 2 | 22.71 | 21.56 | 20.50 |
| cep018 | 4 | 22.19 | 21.33 | 20.47 |
| cep022 | 1 | 22.58 | 21.62 | 20.65 |
| cep028 | 2 | 22.23 | 21.40 | 20.56 |
| cep032 | 2 | 22.64 | 21.56 | 20.62 |
| cep035 | 2 | 21.85 | 21.23 | 20.61 |
| cep040 | 5 | 23.14 | 22.24 | 21.29 |
| cep044 | 3 | 22.32 | 21.58 | 20.81 |
| cep045 | 1 | 22.90 | 22.11 | 21.24 |
| cep050 | 6 | 23.56 | 22.44 | 21.53 |
| cep051 | 4 | 23.25 | 22.20 | 21.22 |
| cep066 | 1 | 22.28 | 21.76 | 21.09 |
| cep067 | 5 | 23.20 | 22.31 | 21.39 |
| cep074 | 4 | 22.80 | 22.09 | 21.35 |

3. Cepheid photometry
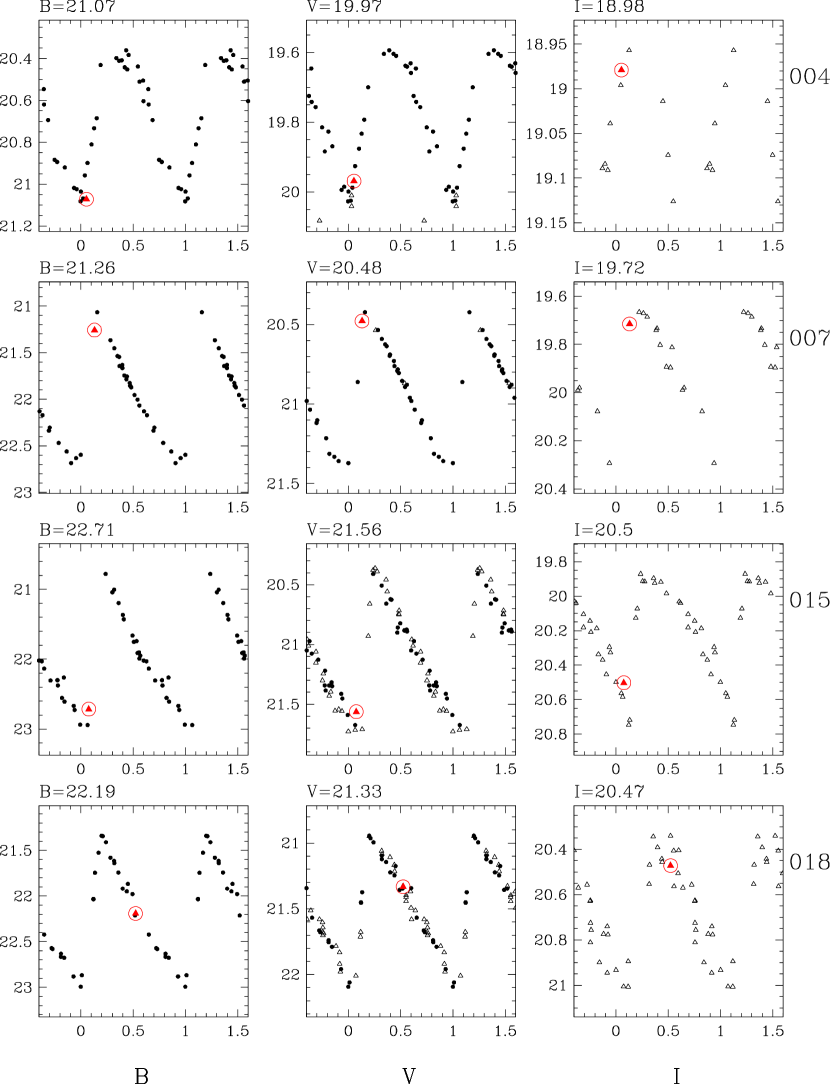
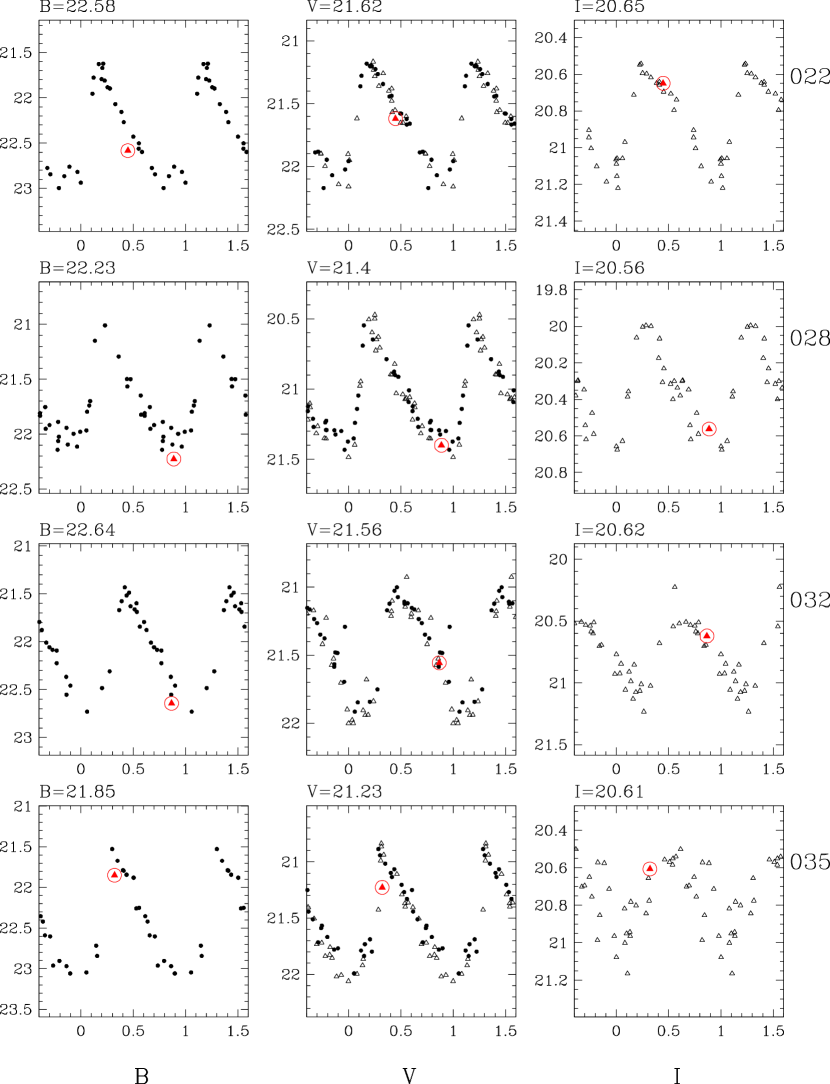
Single-epoch photometry is available from our ACS observations for 30 of the NGC 300 Cepheids included in the catalog of Pietrzyński et al. (2002). The latter work provided high-quality and light curves for 117 Cepheids, observed at the 2.2 m ESO/MPI telescope on La Silla. We adopt here the nomenclature introduced in that work to identify the Cepheids. Additional and data were obtained by G04 at Las Campanas and Cerro Tololo, in order to improve the light curves and to obtain data to address the reddening correction issue. For the rest of this paper we will limit our analysis to 16 variables in common with the work of G04, which includes only Cepheids with periods longer than 10 days, and which were used for the derivation of the distance to NGC 300 based on the Period-Luminosity relation in and .
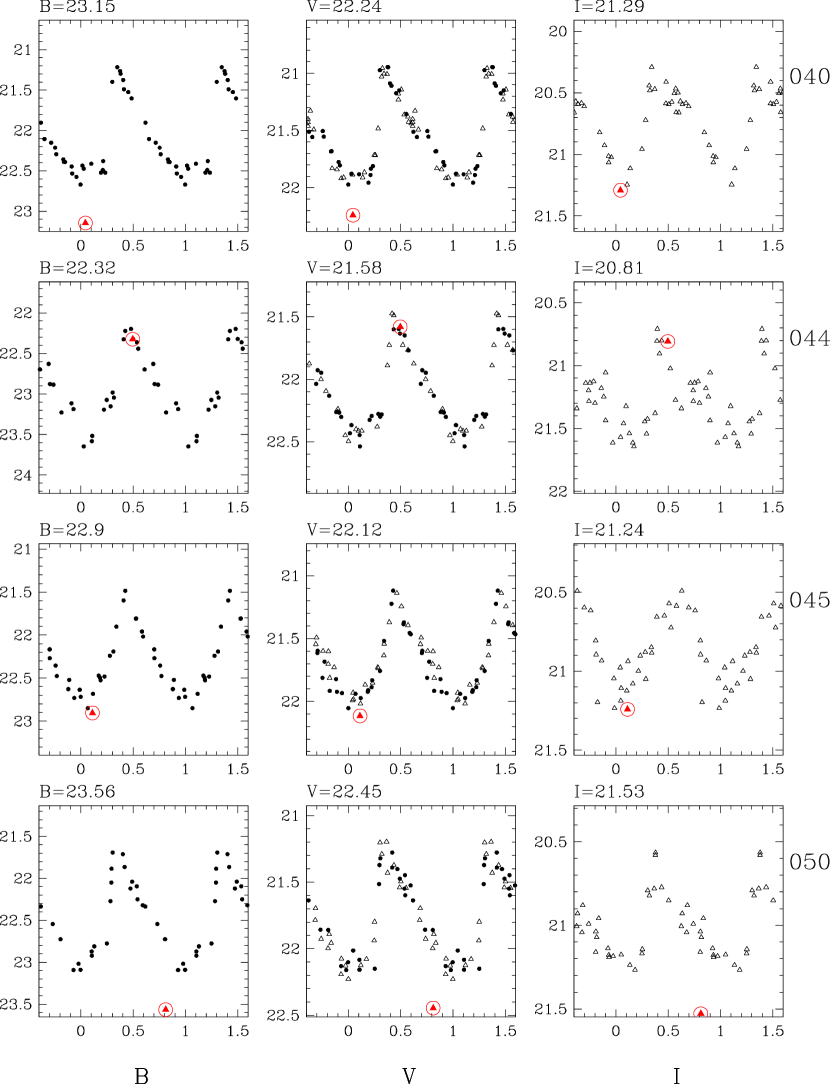
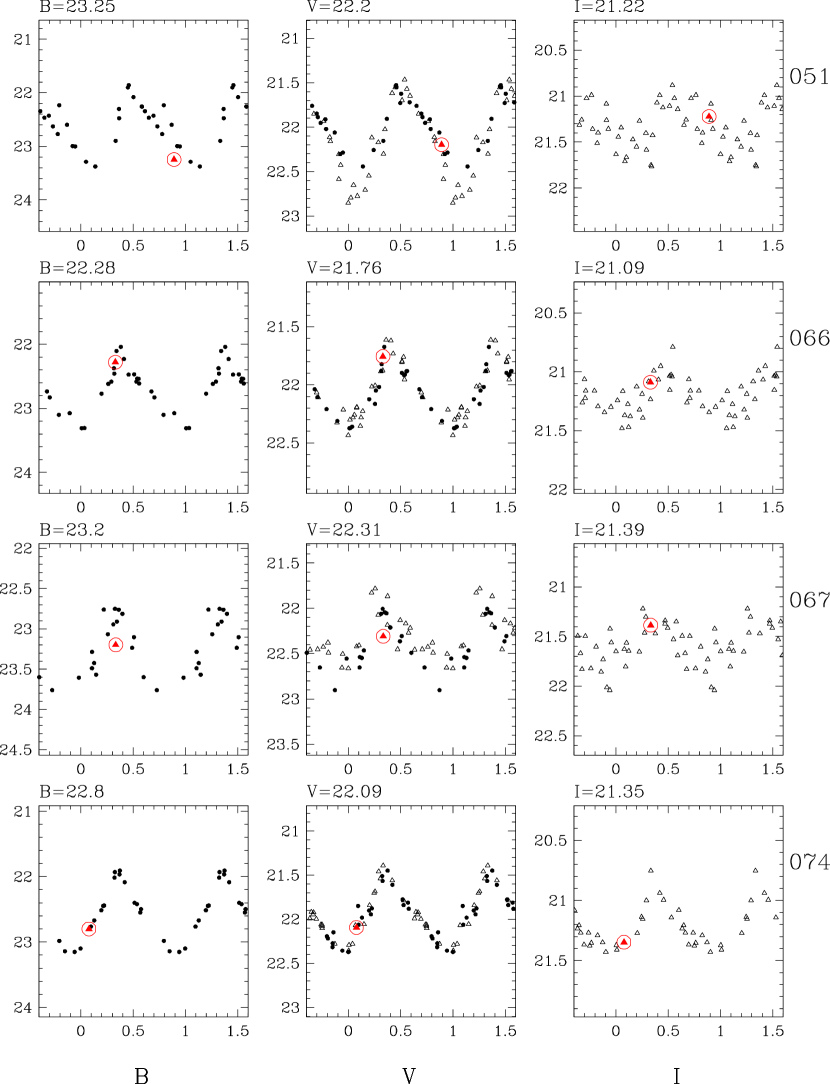
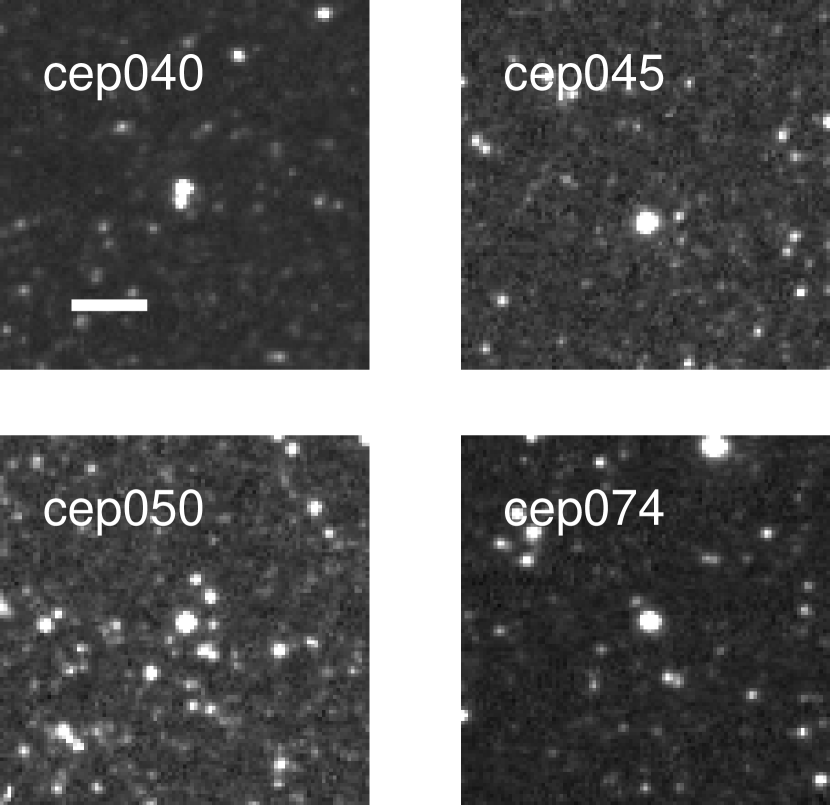
The BVI ACS magnitudes of the Cepheids are presented in Table 2. These magnitudes are compared with the ground-based light curves in Fig. 3, where the phases of the HST data have been calculated from the periods and ephemerides published by Pietrzyński et al. (2002). We updated the periods of cep004 (from 75.0 to 79.5 days) and cep007 (from 43.35 to 43.20), which improved the fit to the ground-based observations. As Fig. 3 shows, we find excellent agreement between the ACS data points and the ground-based data in and . The data indicate the presence of the same offset noticed in the blue supergiant magnitude comparison done in the previous section. Some notable exceptions to the good agreement can also be found, for example cep040 and cep050, for which the ACS magnitudes are systematically fainter in all bands by several tenths of a magnitude. This is the effect we expect from the presence of unresolved blends in the ground-based data. Close companions to the stars mentioned above are indeed detected on the ACS images, as shown in Fig. 7.
4. Definition and characterization of blends
In order to study the effects of blending on the ground-based P-L relation, we have to consider the contribution to the observed Cepheid flux by unresolved projected companions. The ACS images, thanks to their superior spatial resolution, allow us to estimate this contribution, under the assumption that the variables are not further blended in the HST images.
We have adopted a straightforward empirical method to estimate the amount of photometric contamination for the Cepheids. For each variable, a Fourier series analysis has provided a fit to the and light curves. We have then determined the offset between the ACS magnitude and that provided by the Fourier fit, calculated at the corresponding phase value. Whenever this difference was smaller than the 1 dispersion of the Cepheid data points around the fit (in the range 0.06–0.13 mag), we assigned a zero value for the photometric contamination by blends. Larger offsets resulted in our estimate for the non-zero effect of nearby companions on the ground-based photometry.
In an alternative approach, we could have measured the total flux contributed by companions, resolved by HST, within a pre-specified distance from the Cepheid. This is the method that was adopted by Mochejska et al. (2000, 2001) as part of the DIRECT Project study of the effects of blending in M31 and M33. However, the maximum distance from the Cepheid that a star needs to have in order to be considered blended with it, around half the typical FWHM of the Point Spread Function (PSF) of the stellar images in the ground-based images, is a somewhat subjective parameter, and can vary between images taken under different observing conditions. It is also necessary to impose a lower limit to the flux of the stars included in the count, because faint stars resolved by HST would not be measurable from the ground, and would instead contribute to the galaxy background flux. Without an a priori knowledge of all these quantities it would be difficult to obtain a correct estimate of blending. This is especially true in our case, where observations were diluted over a large temporal interval and were obtained with a variety of telescopes and cameras. We have chosen to estimate these parameters a posteriori, once the analysis based on the displacement from the mean light curves had been carried out. We have used the HST photometry of stars around the position of the Cepheids to check our results, to verify that no bright companion was unaccounted for, and that we could identify the companions associated with the offsets between the ACS and the ground-based photometry. This procedure also allowed us to resolve a few dubious cases, where the Fourier analysis fits provided uncertain results, due for example to a scarcely populated steep ascending branch of the Cepheid light curve.
We found that only three out of 16 Cepheids required a significant (i.e. larger than the uncertainties) magnitude correction in order to bring the HST and the ground-based photometry into agreement. Although this small fraction might appear surprising at first, we should recall that the Cepheids used for the determination of the distance to NGC 300 by G04 (the source of the ground-based data used in this work) are among those with the best available characteristics, such as well-defined and clean light curves, and that for the PL relation the most discrepant objects, which are potential blends, are rejected. Cepheids having a mean magnitude brighter than are not affected by blends, i.e. we find excellent agreement between the HST photometry and the ground-based photometry. The affected objects (cep040, cep045 and cep050) are among the faintest in our sample, spanning the range of mean magnitudes between and . The corresponding magnitude offsets are summarized in Table 3.
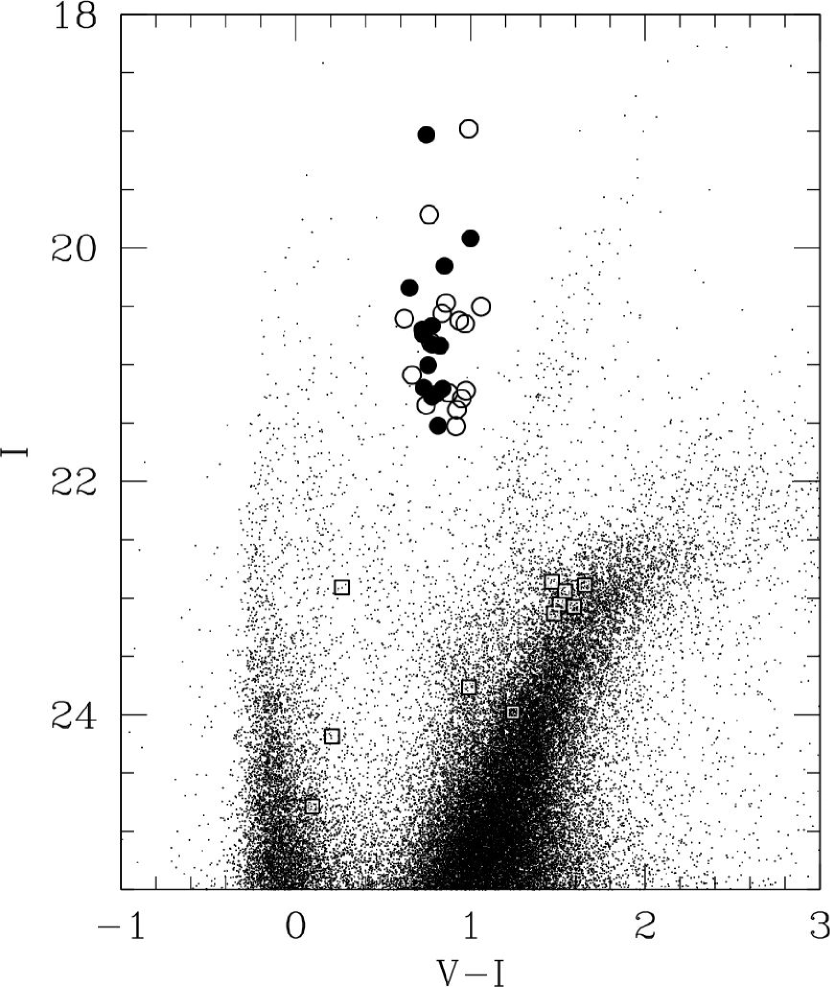
We can derive the typical value of the projected distance of neighbors from the Cepheids one should use for evaluating their contribution to the flux measured from the ground, in order to reproduce the results obtained with the method described above. We found that in most cases a distance of 06 is the correct choice, corresponding to approximately half the FWHM of the typical seeing disk of our images. In addition, we imposed a rather arbitrary lower limit of 5% of the mean Cepheid flux for the companions (to be compared with values between 4% and 6% used by the DIRECT Project team). We found that in order to best reproduce the results obtained from the difference HSTground at a single epoch, we also had to include only stars brighter than and , which suggests that stars near or below the approximate detection limit of our ground-based observations do not contribute significantly to the blending. Without these restrictions on the fluxes, we would obtain in general larger corrections for blending than observed from the direct comparison obtained earlier from the light curves. However, as we will see in §5, the final results obtained in this way do not differ substantially from those obtained from the comparison with the light curves. In fact, the number of neighbors detected is rather small, as can be seen in the color-magnitude diagram of Fig. 8.
| ID | aaHSTground-based magnitude | aaHSTground-based magnitude |
|---|---|---|
| cep040 | 0.34 | 0.15 |
| cep045 | 0.15 | 0.18 |
| cep050 | 0.52 | 0.45 |
5. Effects of blending on the Period-Luminosity relations
We can use the results obtained in the previous section to derive the effects that previously unrecognized blends can have on the optical PL relations derived for NGC 300 by G04. We proceed as done in that paper, by correcting the and magnitudes for extinction, using and , and assuming (Burstein & Heiles 1984), although the reddening estimate has been recently increased by the near-IR study of Gieren et al. (2005b) to . Next, for our scaled-down sample of Cepheids we fit linear Period-Luminosity relations in , and the reddening-free Wesenheit magnitude [], both before and after correcting the Cepheid average magnitudes by the amounts given in Table 3. In our linear regression, we keep the slopes fixed to the ones determined by the OGLE II Project in the LMC (Udalski 2000) and adopted by G04. We are assuming that the photometric offsets between the HST and ground-based photometry, measured at a single epoch, can be applied to the average magnitudes of the Cepheids.
Because of the strictly differential nature of this test, differences in the intersect values with respect to those given by G04 for the complete Cepheid sample are not important. For the un-corrected (blended) case we obtain:
The corresponding intersects from G04 are 25.155 (), 24.621 () and 23.802 (), respectively. Once we correct for the blending, by making the affected Cepheids fainter by the amounts given in Table 3, we obtain:
These regressions are shown in Fig. 9, where the open symbols refer to the uncorrected magnitudes, and the full circles represent the corrected values.
6. Discussion
The amounts by which the zero points of the Period-Luminosity relations increase between the uncorrected case and the case where blending has been taken into account are 0.063 mag in , 0.049 mag in and 0.027 mag in . These differences are not statistically significant, being smaller than or comparable to the size of the errors in the determination of the intersects. Generalizing to the full sample of Cepheids available in NGC 300, we conclude that blending does not appear to have an effect on the distance modulus of NGC 300 which is larger than magnitudes. Naturally, it would be desirable to reduce this upper limit even further, but only with the availability of HST photometry for a considerably larger sample of Cepheids in NGC 300 we could improve the statistical significance of our result.
Our result appears quite robust, and does not depend significantly upon which method is used to estimate the amount of blending. If instead of the adopted offsets obtained from the single-epoch comparison with the light curves we sum the flux of all neighbors projected within 06 of the Cepheids, accounting for the 5% cut-off, we obtain similar results as above. For instance, the variation in the zero point between the uncorrected and the corrected is 0.032 magnitudes, with a 1- error in the mean of 0.048 mag.
The average amount of blending we found in NGC 300 is smaller than what the DIRECT Project investigations measured in M31 and M33. For example, Mochejska et al. (2000) found a mean -band contribution of 19% of the Cepheid flux from unresolved neighbors in their sample of 22 variables in M31. An effect of this size would lead to a 9% upward correction on the distance to this galaxy. In M33 (64 Cepheids with a period larger than 10 days) Mochejska et al. (2001) found a 16% mean -band blending effect, leading to a correction of 6% on the distance. In NGC 300 the average blending is 7% (0% median) for 16 Cepheids, and our estimated upper limit for the effect on the distance is 2%. If we sum the flux of neighbors within 06 with a 5% cutoff (to simulate the Mochejska et al procedure) we obtain an 8% average blending (6% median).
The ACS spatial resolution at the distance of NGC 300 (0.5 pc) is comparable to the resolution of the WFPC2 images used by Mochejska and collaborators in M31 and M33. The reason for the different importance of blending betweeen our study and theirs lies probably in the lower stellar density in the ACS fields in NGC 300 compared to those examined in M31 and M33. As shown by Macri et al. (2001) comparing an inner NICMOS field in M101 with an outer one, different amounts of blending are a consequence of varying degrees of crowding and stellar density.
In G04 we quoted a distance modulus . Our estimate for the systematic error was dominated by the uncertainty on the photometric zero points, but did not include a contribution from the uncertainty on the blending. In the discussion presented by G04 we explained why the effects of blending on our sample of Cepheids in NGC 300 are likely to be negligible, but we were unable to quantify the size of the effect or to assign an upper limit to it. Our current work based on the HST imaging allows us to constrain the maximum effect of blending, and to add its contribution to the overall error budget. We conclude that if blending affects the magnitudes of the Cepheids included in our Period-Luminosity relation for NGC 300, it does so at a small level. Its systematic effect on the distance modulus of this galaxy is limited to less than magnitudes. Our new estimate for the 1- systematic uncertainty in the G04 optical distance modulus to NGC 300 becomes therefore , magnitudes.

[h]
Appendix A ACS photometry of blue supergiants in NGC 300
We report in Table A1 the ACS BVI photometry of the 40 blue supergiants in common with the catalog by Bresolin et al. (2002). The stellar identification is the same used in that paper.
References
- Bresolin et al. (2004) Bresolin, F., Pietrzyński, G., Gieren, W., Kudritzki, R.P., Przybilla, N., & Fouqué, P. 2004, ApJ, 600, 182
- Bresolin et al. (2002) Bresolin, F., Gieren, W., Kudritzki, R.P., Pietrzyński, G., & Przybilla, N. 2002, ApJ, 567, 277
- Burstein & Heiles (1984) Burstein, D. & Heiles, C. 1984, ApJS, 54, 33
- Dolphin (2000) Dolphin, A.E. 2000, PASP, 112, 1383
- Ferrarese et al. (2000) Ferrarese, L., Silbermann, N.A., Mould, J.R., Stetson, P.B., Saha, A., Freedman, W.L. & Kennicutt, R.C. 2000, PASP, 112, 177
- Fouqué & Gieren (1997) Fouqué, P. & Gieren, W.P. 1997, A&A, 320, 799
- Freedman et al. (2001) Freedman, W.L., et al. 2001, ApJ, 553, 47
- Gibson et al. (2000) Gibson, B.K., Maloney, P.R. & Sakai, S. 2000, ApJ, 530, L5
- Gieren et al. (2005a) Gieren, W., Storm, J., Barnes, T.G., Fouqué, P., Pietrzyński, G. & Kienzle, F. 2005a, ApJ, 627, 224
- Gieren et al. (2005b) Gieren, W., Pietrzyński, G., Soszyński, I., Bresolin, F., Kudritzki, R.P., Minniti, D. & Storm, J. 2005b, ApJ, 628, 695
- Gieren et al. (2004) Gieren, W., Pietrzyński, G., Walker, A., Bresolin, F., Minniti, D., Kudritzki, R.P., Udalski, A., Soszyński, I., Fouqué, P., Storm, J. & Bono, G. 2004, AJ, 128, 1167 (G04)
- Gieren et al. (2001) Gieren, W., Geisler, D., Richtler, T., Pietrzyński, G. & Dirsch, B. 2001, Messenger, 106, 15
- Kudritzki et al. (2003) Kudritzki, R.P., Bresolin, F. & Przybilla, N. 2003, ApJ, 582, L83
- Macri et al. (2001) Macri, L.M. et al. 2001, ApJ, 549, 721
- Mochejska et al. (2001) Mochejska, B.J., Macri, L.M., Sasselov, D.D. & Stanek, K.Z. 2001, astro-ph/0103440
- Mochejska et al. (2000) Mochejska, B.J., Macri, L.M., Sasselov, D.D. & Stanek, K.Z. 2000, AJ, 120, 810
- Nordgren et al. (2002) Nordgren, T.E., Lane, B.F., Hindsley, R.B. & Kervella, P. 2002, AJ, 123, 3380
- Pietrzyński et al. (2004) Pietrzyński, G., Gieren, W., Udalski, A., Bresolin, F., Kudritzki, R.P., Soszyński, I., Szymański, M. & Kubiak, M. 2004, AJ, 128, 2815
- Pietrzyński et al. (2002) Pietrzyński, G., Gieren, W., Fouqué, P., & Pont, F. 2002, AJ, 123, 789
- Sakai et al. (2004) Sakai, S., Ferrarese, L., Kennicutt, R.C.& Saha, A. 2004, ApJ, 608, 42
- Sirianni et al. (2005) Sirianni, M. et al. 2005, PASP, submitted
- Stanek & Udalski (1999) Stanek, K.Z. & Udalski, A. 1999, preprint (astro-ph/9909346)
- Udalski (2000) Udalski, A. 2000, Acta Astron., 50, 279
- Udalski (1999) Udalski, A., Szymański, M., Kubiak, M., Pietrzyński, G., Soszyński, I., Woźniak, P. & Zebruń, K. 1999, Acta Astron., 49, 201
- Urbaneja et al. (2005) Urbaneja, M. A., Herrero, A., Bresolin, F., Kudritzki, R.P., Gieren, W., Puls, J., Przybilla, N., Najarro, F. & Pietrzyński, G. 2005, ApJ, 622, 862
| Star | |||
|---|---|---|---|
| A6 | 19.78 | 0.18 | 0.17 |
| A7 | 20.36 | 0.06 | |
| A8 | 19.41 | 0.06 | 0.09 |
| A9 | 20.09 | ||
| A10 | 18.93 | 0.15 | 0.19 |
| A11 | 18.27 | 0.17 | 0.19 |
| A13 | 19.85 | 0.05 | 0.03 |
| B3 | 20.14 | 0.07 | 0.02 |
| B4 | 20.03 | 0.02 | 0.02 |
| B7 | 20.37 | 0.09 | 0.09 |
| B10 | 19.69 | 0.13 | 0.17 |
| B11 | 19.95 | 0.06 | 0.24 |
| B12 | 19.27 | 0.04 | |
| B13 | 18.72 | 0.00 | 0.09 |
| B14 | 19.98 | 0.34 | |
| B15 | 19.71 | 0.01 | 0.01 |
| B17 | 19.53 | 0.02 | 0.06 |
| B18 | 20.25 | ||
| B19 | 20.23 | 0.07 | 0.21 |
| C1 | 18.99 | 0.18 | 0.12 |
| C5 | 20.77 | ||
| C6 | 19.84 | 0.12 | 0.15 |
| C8 | 20.01 | 0.06 | 0.05 |
| C9 | 20.22 | 0.09 | 0.09 |
| C11 | 19.79 | 0.02 | |
| C12 | 20.34 | 0.01 | 0.27 |
| C14 | 20.25 | ||
| C15 | 21.03 | ||
| C17 | 20.86 | 0.27 | 0.26 |
| C18 | 19.94 | ||
| C19333This star was incorrectly assigned the photometry of a fainter, nearby star by Bresolin et al. (2002). | 19.76 | ||
| D1 | 20.94 | 0.17 | 0.13 |
| D2 | 19.83 | 0.13 | 0.19 |
| D3 | 21.71 | 0.17 | 0.15 |
| D5 | 20.06 | 0.09 | 0.08 |
| D12 | 18.66 | 0.31 | 0.31 |
| D13 | 18.86 | 0.10 | 0.14 |
| D16 | 20.84 | 0.20 | 0.20 |
| D17 | 19.44 | 0.15 | 0.11 |
| D18 | 19.96 | 0.05 | 0.07 |