11email: lutz@mpe.mpg.de,genzel@mpe.mpg.de,sturm@mpe.mpg.de 22institutetext: Max-Planck-Institut für Astronomie, Königstuhl 17, 69117 Heidelberg, Germany
22email: dannerb@mpia-hd.mpg.de 33institutetext: Astrophysics, Department of Physics, Keble Road, Oxford OX1 3 RH, U.K.
33email: dar@astro.ox.ac.uk 44institutetext: Department of Physics, 366 Le Conte Hall, University of California, Berkeley, CA 94720-7300 55institutetext: European Southern Observatory, Karl-Schwarzschild-Str. 2, 85748 Garching, Germany
55email: amoor@eso.org
Follow-Up Near-infrared Spectroscopy of Ultraluminous Infrared Galaxies observed by ISO††thanks: Based on observations collected at the European Southern Observatory, Chile, ESO No. 62.P-0315(A) and 63.P-0264(A).
We present low resolution near-infrared spectroscopy of an unbiased sample of 24 ultraluminous infrared galaxies (ULIRGs), selected from samples previously observed spectroscopically in the mid-infrared with the Infrared Space Observatory (ISO). Qualitatively, the near-infrared spectra resemble those of starbursts. Only in one ULIRG, IRAS 041145117E, do we find spectroscopic evidence for AGN activity. The spectroscopic classification in the near-infrared is in very good agreement with the mid-infrared one. For a subset of our sample for which extinction corrections can be derived from and , we find rather high luminosities, in accordance with the powering source of these galaxies being star formation. emission is strong in ULIRGs and may be linked to starburst and superwind activity. Additionally, our sample includes two unusual objects. The first, IRAS F001837111, exhibits extreme emission and the second, IRAS F235785307, is according to our knowledge one of the most luminous infrared galaxies in rotation-vibration emission.
Key Words.:
galaxies: active—galaxies: interactions—galaxies: starburst—infrared: galaxies1 Introduction
Ultraluminous infrared galaxies (see Sanders & Mirabel 1996, for a review) radiate the bulk of their energy in the far-infrared as a continuum emitted by warm dust ( K). The dust is heated by ultraviolet radiation either coming from an immense starburst in the central region of these objects or from an accretion disk surrounding a black hole. Since their discovery by IRAS there has been an intense debate about the nature of ULIRGs and their possible evolutionary connection to quasars. Sanders et al. (1988a) postulated that the dominant energy source in a ULIRG is a dust enshrouded quasar appearing in the last phase of the merging of two or more gas-rich disk galaxies. Although evidence for both starburst and AGN activity in ULIRGs has been found, the question of what generally dominates the luminosity has remained largely unresolved, mainly due to observational difficulties associated with the large dust obscuration. Since extinction in the optical is about a factor of 10 higher than in the near-infrared (e.g., Mathis 1990) and as the latter provides both starburst signatures and direct spectroscopic indicators of AGN activity (e.g., Marconi et al. 1994), near-infrared spectroscopy is an important diagnostic for these objects. With the advent of sensitive near-infrared detectors, near-infrared spectroscopy of ultraluminous galaxies (e.g., Goldader et al. 1995, 1997a, 1997b; Veilleux et al. 1997b, 1999b; Murphy et al. 1999, 2000, 2001; Burston et al. 2001; Valdés et al. 2005) began to unveil the nature of these most luminous galaxies in the local universe. Most near-infrared spectra of ULIRGs were found to be starburst-like, but the starburst luminosity traced by the observations appeared typically insufficient to account for the full ULIRG luminosities.
With ISO (Kessler et al. 1996) it became possible to study even more obscured regions by means of sensitive mid-infrared spectroscopy. Fine structure lines in 15 ULIRGs (Genzel et al. 1998) were observed with the ISO short-wavelength grating spectrometer. By using the spectrophotometric mode of the photometer on board ISO, low resolution spectroscopy of the mid-infrared aromatic features (‘PAHs’) was obtained for a sample of 62 ULIRGs (Lutz et al. 1998; Rigopoulou et al. 1999). Finally, 16 ULIRGs of particularly high luminosity were observed by Tran et al. (2001) with the low resolution spectroscopic mode of the ISOCAM camera. These studies of 78 ULIRGs, drawn mainly from the complete IRAS 2 Jy sample (Strauss et al. 1990, 1992) and its extension, the IRAS 1.2 Jy sample (Fisher et al. 1995), find that % of the ULIRGs are dominated by starburst activity but that there is also a trend towards AGN dominance at the highest luminosities. Lutz et al. (1999) compared ISO classifications (starburst or AGN) with classifications from optical spectroscopy and found a good agreement if optical LINER spectra were assigned to the starburst group, supporting a scenario in which infrared-selected LINERs are due to shocks that are probably related to galactic superwinds.
We carried out follow-up low resolution near-infrared spectroscopy for a subset of the ISO ULIRG sample, accessible from La Silla, in order to search for obscured AGNs and to compare the ISO indicators with those from the near-infrared wavelength regime. We used the line which dominates the near-infrared spectra of ULIRGs and the coronal line as diagnostic tools to search for broad-line components and high energy photons, respectively. We investigate the so-called ‘-deficit’ quantifying the starburst contribution to the total luminosity and first studied by Goldader et al. (1995, 1997a, 1997b), and discuss the strong emission in ULIRGs and its possible implications for the nature of infrared-selected LINERs. Finally, we discuss two unusual near-infrared ULIRG spectra.
The structure of this paper is as follows: In section (2) we present the sample. In section (3) we report on the observations and data reduction, followed by section (4), discussing the results of our near-infrared spectroscopy of ULIRGs. Section (5) summarizes our main conclusions. We adopt / and .
2 The Sample
The unbiased ISO sample, comprising observations made with ISO-SWS (Genzel et al. 1998), ISOPHOT-S (Lutz et al. 1998; Rigopoulou et al. 1999) and ISOCAM-CVF (Tran et al. 2001), was drawn from the complete IRAS 2 Jy sample (Strauss et al. 1990, 1992) and its extension, the IRAS 1.2 Jy sample (Fisher et al. 1995). The selected objects had to fulfill the following criteria: L☉, equivalent to L☉111 Perault (1987) calculates the infrared luminosity by using the four IRAS-bands: ., flux S Jy, good ISO visibility and (for ISOPHOT-S only) redshift below 0.3. The sample of 24 ULIRGs presented here is a subset of targets accessible for observations from La Silla during our observing runs. We did not bias the sample towards starbursts or AGNs. Our ULIRGs cover a redshift range . is shifted into the K band for all objects, except for IRAS F001837111 which shows shifted into the H band. The sample and its basic properties are listed in Table 1.
3 Observations and Data Reduction
Near-infrared long-slit spectra of the 24 ULIRGs were obtained with SOFI (Moorwood et al. 1998), the cameraspectrometer on the ESO NTT 3.5 m telescope at La Silla/Chile, during two runs in November 1998 and August 1999. We chose the red grism covering a spectral range from , including the AGN-indicators and in the K band as well as other diagnostic lines. We used a 1″290″ long slit giving a spectral resolving power R () at 2 . The detector used is a Rockwell HgCdTe 10241024 Hawaii array with 18.5 micron pixels and the pixel scale along the spatial axis is 0.292 arcseconds per pixel.
In single component systems, the slit was oriented along the presumed major axis of the ULIRG, as determined from K-band images taken by Rigopoulou et al. (1999) and Borne et al. (2000). In addition, a SOFI K-band image was taken of IRAS 194580944 which is presented in the appendix of this paper. In double/multiple component systems, we oriented the slit to get spectra of two components simultaneously. Table 1 lists the slit position angles used. Spectra were taken in the standard way, nodding the telescope ″along the slit. The total integration time was between 20 to 40 minutes. Sky conditions during both runs were photometric with a seeing of ″ and ″, respectively. Data reduction was performed using IRAF222 IRAF is distributed by the National Optical Astronomy Observatories, which are operated by the Association of Universities for Research in Astronomy, Inc., under cooperative agreement with the National Science Foundation. and ECLIPSE software (Devillard 1997) in the standard way. Line parameters (flux, center, width, see Tables 2 to 3) were measured by fitting a gaussian profile. We estimate flux errors less than 25% 333A few ULIRGs of this sample were observed by Valdés et al. (2005) with SOFI in medium resolution mode in the K band. We note for some line measurements discrepancies. Possible reasons for that are differences in set-up like position angle and weather conditions..
14 of the 24 ULIRGs contain two or more components (see also Table 1). If the separation of the components was sufficient, we extracted spectra for each component, finally obtaining 34 spectra.
| Object | z | Morpho- | ff60 | optical | ISO | RA(2000) | DEC(2000) | PA | |
|---|---|---|---|---|---|---|---|---|---|
| logy | type | type | degree | ||||||
| (1) | (2) | (3) | (4) | (5) | (6) | (7) | (8) | (9) | (10) |
| F001837111 | 12.77 | 0.327 | S | 0.11 | LINER1 | AGN | 00 20 34 | 70 55 26 | 90.0 |
| 001880856 | 12.31 | 0.129 | D | 0.14 | LINER3 | SB | 00 21 26 | 08 39 27 | 0.0 |
| 001997426 | 12.25 | 0.096 | D | 0.08 | ?2 | ? | 00 22 08 | 74 09 26 | 25.5 |
| 010032238 | 12.19 | 0.118 | S | 0.29 | HII3 | SB | 01 02 49 | 22 51 57 | 0.0 |
| 011660844 | 11.99 | 0.118 | D | 0.10 | HII3 | ? | 01 19 07 | 08 29 11 | 65.0 |
| 012980744 | 12.28 | 0.136 | S | 0.11 | HII3 | SB | 01 32 21 | 07 29 08 | 0.0 |
| 013884618 | 12.03 | 0.090 | S | 0.12 | HII6 | SB | 01 40 55 | 46 02 53 | 0.0 |
| 024110354 | 12.15 | 0.144 | T | 0.16 | HII3 | SB | 02 43 46 | 04 06 36 | 28.0 |
| 035210028 | 12.46 | 0.152 | D | 0.09 | LINER3 | SB | 03 54 42 | 00 37 03 | 80.6 |
| 040633236 | 11.97 | 0.110 | D | 0.08 | SB | 04 08 18 | 32 28 31 | 69.0 | |
| 041145117 | 12.16 | 0.124 | D | 0.03 | AGN | 04 12 44 | 51 09 40 | 40.0 | |
| 043844848 | 12.32 | 0.213 | S | 0.07 | SB | 04 39 50 | 48 43 16 | 0.0 | |
| 060097716 | 11.95 | 0.117 | D | 0.08 | SB | 05 58 37 | 77 16 39 | 103.5 | |
| 060357102 | 12.14 | 0.079 | D | 0.11 | HII2 † | SB | 06 02 54 | 71 03 09 | 245.2 |
| 194580944 | 12.28 | 0.100 | S | 0.07 | SB | 19 48 15 | 09 52 01 | 0.0 | |
| 200497210 | 11.93 | 0.126 | S | 0.08 | HII4 | SB | 20 10 27 | 72 01 11 | 13.0 |
| 201004156 | 12.55 | 0.129 | D | 0.07 | HII2 † | SB | 20 13 29 | 41 47 34 | 41.1 |
| 204466218 | 12.04 | 0.107 | D | 0.08 | HII4 | ? | 20 48 44 | 62 07 25 | 74.8 |
| 205514250 | 11.98 | 0.043 | S | 0.15 | HII2 † | SB | 20 58 26 | 42 38 57 | 0.0 |
| 231285919 | 11.96 | 0.045 | D | 0.15 | HII2 | SB | 23 15 46 | 59 03 14 | 3.0 |
| 232306926 | 12.22 | 0.106 | D | 0.08 | LINER2 | ? | 23 26 03 | 69 10 17 | 22.6 |
| 232535415 | 12.26 | 0.129 | S | 0.09 | HII5 | SB | 23 28 06 | 53 58 31 | 13.0 |
| 233896139 | 12.10 | 0.093 | D | 0.07 | HII2 † | SB | 23 41 43 | 61 22 50 | 8.0 |
| F235785307 | 12.11 | 0.125 | S | 0.05 | ? | 00 00 24 | 52 50 30 | 90.0 |
Col. (1) — Name of Object (IRAS …).
Col. (2) — Log of Infrared Luminosity in L☉.
Col. (3) — Redshift z.
Col. (4) — S=single; D=double; T=triple.
Col. (5) — Ratio of IRAS flux at 25 and 60 .
Col. (6) — Optical type.
Col. (7) — ISO type; classification based on the PAH feature (Rigopoulou et al. 1999; Lutz et al. 1999; Tran et al. 2001).
Col. (8) — RA(J2000).
Col. (9) — DEC(J2000).
Col. (10) — Position Angle PA of the observed ULIRGs.
1Armus et al. (1989); 2Duc et al. (1997);
3Veilleux et al. (1999a); 4Allen et al. (1991); 5Sekiguchi & Wolstencroft (1993); 6Kewley et al. (2001).
† These ULIRGs were reclassified by Lutz et al. (1999).
?: Quality of these spectra was not good enough for a classification.
| Object | [FeII] | [FeII] | HeI | ||||||||||
|---|---|---|---|---|---|---|---|---|---|---|---|---|---|
| 1.257 | 1.282 | 1.644 | 1.835 | 1.876 | 1.891 | 1.945 | 1.957 | 2.033 | 2.058 | 2.122 | 2.166 | 2.223 | |
| (1) | (2) | (3) | (4) | (5) | (6) | (7) | (8) | (9) | (10) | (11) | (12) | (13) | (14) |
| F001837111 | 0.228: | 0.115: | 0.376: | ||||||||||
| 001880856N | 0.079: | 0.71 | 0.039:: | 0.123 | 0.104:: | ||||||||
| 001880856S | |||||||||||||
| 001997426N | 2.07 | 0.218 | 0.066:: | 0.251: | 0.115:: | 0.462: | |||||||
| 001997426S | 0.126: | ||||||||||||
| 010032238 | 0.991 | 0.190: | |||||||||||
| 011660844S | |||||||||||||
| 011660844W | 0.075 | ||||||||||||
| 012980744 | 0.072 | 0.006: | 0.017 | 0.025: | |||||||||
| 013884618 | 0.12: | 1.495 | 0.083:: | 0.220 | 0.040:: | 0.203 | 0.182:: | ||||||
| 024110354Main | 2.906 | 0.188 | 0.099 | 0.213: | 0.125: | 0.408: | |||||||
| 024110354W | 0.680 | 0.063: | 0.039:: | ||||||||||
| 035210028 | 0.162 | 0.764 | 0.170: | ||||||||||
| 040633236NE | 0.087: | 1.08 | 0.055:: | 0.134 | 0.123: | 0.104: | |||||||
| 040633236SW | 0.207 | ||||||||||||
| 041145117E | 0.398 | 0.089: | 0.053:: | 0.057:: | |||||||||
| 041145117SW | 0.082 | ||||||||||||
| 043844848 | 1.01 | ||||||||||||
| 060097716E | 0.128 | ||||||||||||
| 060097716W | 1.206 | 0.102 | 0.052 | 0.170:: | |||||||||
| 060357102W | 0.232: | 1.122 | 0.078:: | 0.428 | 0.227 | 0.480 | |||||||
| 060357102E | 0.231 | 0.516: | |||||||||||
| 194580944 | 2.079: | 0.911:: | 8.855 | 0.460: | 1.276 | 0.631: | 0.484: | 1.276: | 1.166: | ||||
| 200497210 | 0.172 | ||||||||||||
| 201004156∗ | 0.445 | ||||||||||||
| 204466128N | 0.050 | 1.616 | 0.040: | 0.099 | 0.117 | 0.025 | 0.899 | 0.092: | 0.206 | ||||
| 204466128S | |||||||||||||
| 205514250 | 0.257 | 1.606! | 0.011! | 0.128! | 0.428! | 0.187 | 0.465 | 0.199 | 0.149 | ||||
| 231285919N | 0.960 | 13.06! | 0.695! | 0.441! | 0.802 | 0.318 | 1.191 | 0.417 | |||||
| 231285919S | 2.038 | 26.33! | 1.578! | 2.696! | 0.451 | 1.547 | 1.306 | 2.675 | 0.651: | ||||
| 232306926 | 0.221 | 1.561 | 0.138 | 0.278 | 0.188 | 0.092 | 0.247 | 0.190: | |||||
| 232535415 | 0.075 | 0.269 | 0.101 | 0.175 | |||||||||
| 233896139 | 0.600 | 0.708: | 2.232 | 0.091 | 0.121: | 0.653 | 0.187: | 0.581 | 0.212 | 0.341:: | |||
| F235785307 | 1.395 | 2.768 | 0.423:: | 1.65 | 1.136 | 0.966: | 3.735 |
Col. (1) — Name of Object.
Col. (2) - Col. (14)
— Line flux in erg s-1 cm-2.
! — Line in region of poor atmospheric transmission between H and
K band.
| Object | [FeII] | [FeII] | HeI | ||||||||||
|---|---|---|---|---|---|---|---|---|---|---|---|---|---|
| 1.257 | 1.282 | 1.644 | 1.835 | 1.876 | 1.891 | 1.945 | 1.957 | 2.033 | 2.058 | 2.122 | 2.166 | 2.223 | |
| (1) | (2) | (3) | (4) | (5) | (6) | (7) | (8) | (9) | (10) | (11) | (12) | (13) | (14) |
| F001837111 | 1000:: | 600:: | 1100:: | ||||||||||
| 001880856N | 572.6: | 481.2 | 526.7:: | 509.4 | |||||||||
| 001880856S | |||||||||||||
| 001997426N | 585.3 | 717.9 | 599.6: | 417.3:: | 823.2: | ||||||||
| 001997426S | 513.7: | ||||||||||||
| 010032238 | 542.1 | 667.6: | |||||||||||
| 011660844S | |||||||||||||
| 011660844W | 575.0 | ||||||||||||
| 012980744 | 634.4 | 527.8 | 532.5: | ||||||||||
| 013884618 | 682.6: | 540.6 | 656:: | 607.2 | 425.0 | ||||||||
| 024110354Main | 519.3 | 494.9 | 846.9 | 506.3: | 401.3:: | 385: | |||||||
| 024110354W | 468.2 | 461.8: | 968.0:: | ||||||||||
| 035210028 | 433.7 | 663.9 | 577.5: | ||||||||||
| 040633236NE | 769.6 | 587.0 | 500.2 | 377.9:: | |||||||||
| 040633236SW | 630 | ||||||||||||
| 041145117E | 569.8 | 945.9: | 634.7 | ||||||||||
| 041145117SW | 853.7 | ||||||||||||
| 043844848 | 630.7 | ||||||||||||
| 060097716E | 573.8 | ||||||||||||
| 060097716W | 558.2 | 598.5 | 598.5 | 381.0:: | |||||||||
| 060357102W | 600.1: | 706.6 | 565.9:: | 684.2: | 866.3 | 794.1 | |||||||
| 060357102E | 592.9 | 380.8:: | |||||||||||
| 194580944 | 982.9: | 542.4:: | 524.5 | 458.6: | 613.6 | 730.1: | 407.2: | 561.4: | 578.7: | ||||
| 200497210 | 585.2 | ||||||||||||
| 201004156 | 892.0 | ||||||||||||
| 204466128N | 484.4 | 502.1 | 581.7: | 461.8 | 480.0 | 551.7 | 557.5 | 508.8: | 643.4 | ||||
| 204466128S | |||||||||||||
| 205514250 | 541.0 | 582.2! | 526.2! | 481.2! | 592.6! | 523.8 | 544.9 | 515.9 | 453.3 | ||||
| 231285919N | 629.8 | 598.4! | 568! | 578.4! | 466.0 | 336.3 | 451.1 | 318.7 | |||||
| 231285919S | 755.6 | 760.3! | 719.4! | 1832! | 614.9 | 578.7 | 613.6 | 655.5 | 750.3: | ||||
| 232306926 | 863.6 | 585.2 | 639.9 | 714.6 | 1152.8 | 409.4: | 578.2 | 606.3: | |||||
| 232535415 | 631.7 | 635.7 | 609.9 | 459.6 | |||||||||
| 233896139 | 803.9 | 1025.1 | 667.9 | 350.2 | 653.3: | 817.0 | 486.2: | 674.5 | 336.4 | 672.2:: | |||
| F235785307 | 882.4 | 623.7 | 593.2 | 549.9 | 706.4: | 713.9 |
Col. (1) — Name of Object.
Col. (2) - Col. (14)
— Observed full width at half maximum, in km/s. The instrumental line width
is about 500 km/s.
! — Line in region of poor atmospheric transmission between H and K band.
4 Results
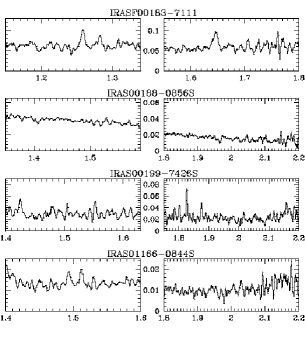
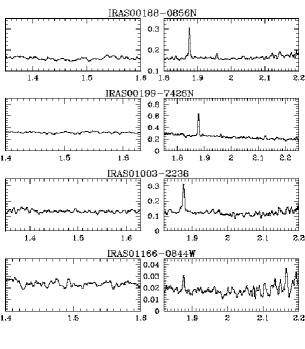
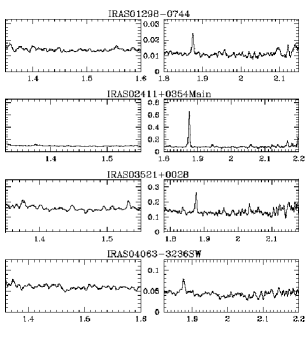
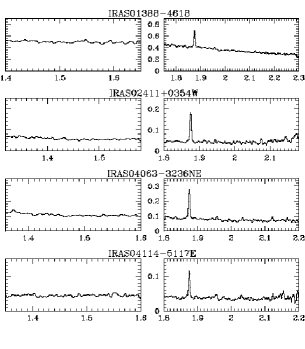
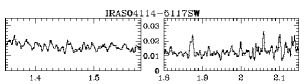
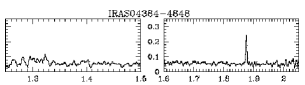
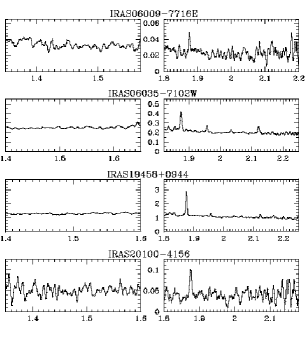
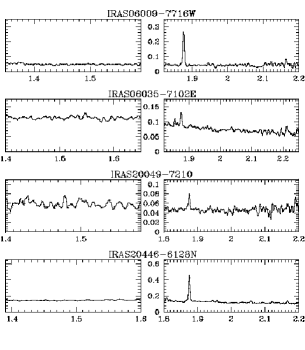
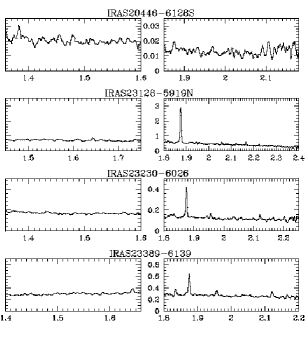
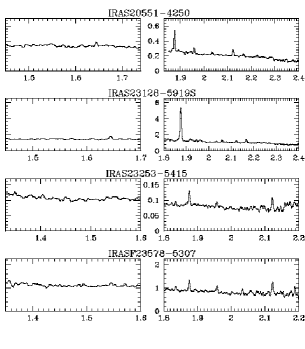
The spectra for all 24 ULIRGs observed are shown in Fig. 1. The hydrogen recombination line is present in all ULIRG spectra except F001837111 where is shifted outside the K band. In most of the spectra, lines of the Brackett series such as at 2.166 and at 1.945 are observed as well. Furthermore, in some ULIRGs we detected the helium recombination line HeI (21S-21P0) 2.058 . In addition to the hydrogen recombination lines, most of the ULIRG-spectra show strong rotation-vibration transitions of molecular hydrogen, except F001837111 because of its redshift. Transitions between the vibrational first excited and ground state, 1-0 S(…), dominate, suggesting that shocks or dense photo-dominated regions (PDRs) are the main sources of molecular hydrogen emission (Sternberg & Dalgarno 1989). In some cases, lines of with rest wavelengths 1.257 and 1.644 m are observed in the H and/or K band. In two low redshift ULIRGs — IRAS 205514250 and IRAS 231285919N/S — CO absorption bands at 2.29 and 2.32 are still present in the part of the K band not yet strongly affected by the thermal background radiation. These CO absorption bands are produced in the atmosphere of red giants and supergiants.
4.1 Search for buried AGNs
The prime scientific motivation for our research is the search for ‘hidden AGN’ postulated by Sanders et al. (1988a). Our aim is to compare near-infrared evidence for AGN activity with evidence from ISO mid-infrared observations of our sample ULIRGs (Rigopoulou et al. 1999; Tran et al. 2001). Additionally, we can quantify the extent to which near-infrared studies are affected by extinction. The near-infrared regime contains two indicators linked to the presence of a ‘hidden AGN’: and the hydrogen recombination lines (e.g., , ). Marconi et al. (1994) showed that a dust enshrouded AGN can be detected using the coronal line at 1.962 m which is observed in most (though not all) local Seyferts. The lower ionization potential of this species is 167 eV, therefore, only the hard UV-spectrum of an AGN and not a starburst can be responsible for the ionization up to Si5+. Spatially resolved observations (e.g., Maiolino et al. 1998) and photoionization models of e.g. ISO-observations (Alexander et al. 1999, 2000) are consistent with the formation of this line in the inner part of the narrow-line region. Near-infrared hydrogen recombination lines, especially and , allow a deep search for AGN broad-line regions (e.g., Veilleux et al. 1997b). This method is obviously sensitive mainly to type 1 AGN while, the BLR in type 2s remains usually undetectable out to 4 m (Lutz et al. 2002). In contrast, [SiVI] emission from the NLR can be detected for both type 1 and type 2 AGN. Both methods provide a further check of the mid-infrared method used by Rigopoulou et al. (1999) and Tran et al. (2001) which is based on the ratio of large scale PAH emission and AGN-heated dust.
Due to the SOFI spectral resolution of 600, is partially blended with the molecular hydrogen line at 1.958 . Models of fluorescent excitation of molecular hydrogen predict an / flux ratio less than unity (typically ; Black & van Dishoeck 1987), while collisional excitation models predict a ratio that ranges from 0.5 to 1.4 (Shull & Hollenbach 1978; Black & van Dishoeck 1987; Sternberg & Dalgarno 1989). Similar to Veilleux et al. (1997b, 1999b), we have assumed conservatively that is present in galaxies where the apparent flux ratio of / is larger than 1.5. IRAS 041145117 is a double nucleus system which most likely hosts an AGN in one of its two nuclei. In the East component (IRAS 041145117E), the / ratio is 1.6, consistent with the presence of an AGN. Also, the observed half width of the blend of and lines in that source is higher than the width of the line alone (Table 3). By fitting multiple Gaussians we have estimated the fluxes for the various lines: values of erg s-1 cm-2 and erg s-1 cm-2 were found for the molecular hydrogen and lines, respectively. The line flux renders an observed luminosity of L☉ for the line. The presence of an AGN in this galaxy is also confirmed from the mid-infrared classification using the PAH-diagnostic (Rigopoulou et al. 1999). The fainter component of this system, IRAS 041145117W, shows no evidence of AGN activity.
For all sources, the hydrogen recombination lines and , are narrow with an intrinsic full width at half maximum (FWHM) of 700 at most (see Table 3 for the observed FWHM). None of the targets show evidence for an additional broad line component ( a few 1000 km/s). In most of our ULIRGs, the line shows a blue wing (see also Veilleux et al. 1997b, 1999b; Burston et al. 2001). Murphy et al. (1999, 2001) resolved similar blue wings and proposed an identification with two helium recombination lines at 1.8686 and 1.8697 . Transitions of molecular hydrogen may contribute as well (Veilleux et al. 1999b). Hence, we do not consider such asymmetric blue wings as evidence for an AGN.
To better quantify the non-detection of a broad-line component in our sample, we derived 3 upper limits for the flux of the broad-line component of , assuming a line width of 3000 . The line width of 3000 is a typical value for Seyfert 1 galaxies and consistent with the detections of broad lines in some ULIRGs by Veilleux et al. (1997b, 1999b). From this, we determined an upper limit for the ratio of the broad line flux and the measured narrow-line flux. A major part of our sample has a limit on this flux ratio lower than one (21/29) and almost all (28/29) lower than two. The non-detection of broad-line regions is significant considering that ratios of broad and narrow flux significantly above 1 are common in Sy1s (e.g., Stirpe 1990, where the median ratio is 20 for objects not exceeding a luminosity of M mag), and have also been observed in a few ULIRGs (IRAS 13451 , IRAS 23499 and IRAS 13305 , Veilleux et al. 1997b, 1999b). IRAS F001837111, which was classified as AGN by ISO, cannot be classified unambiguously in the near-infrared due to its redshift (precluding observation of ) and faintness (precluding a good measurement or strong limit for a broad component to ).
Overall, we find evidence for AGN activity in one out of the 24 ULIRGs of the present sample. Additionally, there is good agreement between near-infrared and mid-infrared classifications. None of the 17 ULIRGs classified by ISO as starburst show any AGN activity in the near-infrared. Small number statistics provided us with only 2 ISO AGN in our sample — one (IRAS 041145117E) also has near-infrared evidence for AGN activity, the other (IRAS F001837111) is uncertain. This is consistent with the good agreement found between optical and near-infrared (Veilleux et al. 1997b, 1999b), ISO and optical (Lutz et al. 1999) and ISO and hard X-ray (Genzel & Cesarsky 2000) classifications, suggesting that strong AGN in ULIRGs are often identifiable over a wide wavelength range. Near-infrared and ISO diagnostics also agree in putting most optical LINERs into the starburst category. This is true for three of the four optical LINERs observed with SOFI, the fourth is again the ambiguous IRAS F001837111. As argued by Lutz et al. (1999) and Taniguchi et al. (1999), this suggests that optical LINERs from infrared selected samples are linked to the starburst phenomenon. We will revisit this issue below when discussing emission.
4.2 Starburst luminosity and the ‘-Deficit’
Qualitatively, our results confirm previous findings that the majority of near-infrared spectra of ULIRGs are starburst-like. Goldader et al. (1995, 1997a, 1997b) studied quantitatively in the near-infrared whether the starburst activity traced is sufficient to power the bolometric luminosity of infrared galaxies. To quantify the relative strength of the ionization source, they used the -luminosity (which is proportional to the ionizing photon rate) in conjunction with the infrared luminosity which is assumed to be equal to the bolometric luminosity of the (U)LIRGs. has been extinction corrected using either near-infrared continuum colors or E(BV) derived from the optical hydrogen recombination lines and . Goldader et al., found that in luminous infrared galaxies (LIRGs), the starburst activity seen in the near-infrared can account for the total bolometric luminosity. In ULIRGs, however, they found that the starburst activity detected is insufficient to account for the bolometric luminosity if similar starburst properties (initial mass function, star formation history) to those for the LIRGs are assumed. This ‘deficit’ in luminosity or ionizing luminosity, is usually a factor of about 3, although it can reach up to 10 in individual cases. A likely interpretation is that a significant part of the ULIRG’s power source has not yet been seen in these observations because the central regions are optically thick in the near-infrared. Veilleux et al. (1997b, 1999b) have investigated the deficit of the ionizing luminosity using the line. They determined extinction (in a foreground screen model) using optical/optical and optical/near-infrared hydrogen recombination-line pairs. They confirm the deficit found by Goldader et al. (1995, 1997a, 1997b) for ULIRGs that are cool in the IRAS 25 /60 color but do not find a deficit for warm444 (fν(25 m)/fν(60 m)0.2; Sanders et al. 1988b) (mostly AGN-like) ULIRGs, a category excluded by Goldader et al. (1995, 1997a, 1997b) in their initial analysis. Recent work by Valdés et al. (2005) report this deficit using the and line as well.
We used the dominant line to revisit the deficit of the ionizing luminosity for our sample of mostly starburst-like and ‘cool’ ULIRGs. To determine the intrinsic flux of this line, we corrected for extinction using the foreground absorber model. We adopted the extinction coeffcients of Veilleux et al. (1997a) and three different line pairs: /, / and /. For the calculations we assumed case B recombination, a temperature K and an electron density (Hummer & Storey 1987). Different line pairs often provide significantly different extinction values. In principle, the extinction derived from the purely near-infrared line pair / is significantly higher than that from the purely optical / or the optical/near-infrared /, indicating that the near-infrared recombination-line emission originates in deeper more obscured regions and does not follow a simple screen model. Technical reasons like different aperture sizes may also affect the line ratios derived from independent optical and near-infrared observations. On the other hand, and are separated by less than 0.3 , and thus give useful extinction constraints only for high AV (10) because of the small differential extinction. For some of our sources, is redshifted into the less favourable long end of the K band. Since we are probing for obscuration effects that are significant even in the near-infrared, and since both lines are taken from the same spectrum, thus minimizing systematic errors, the / ratio is valuable for studying the ionizing photon deficit in ULIRGs.
In Table 4 we summarize the results for those sample galaxies for which we estimated extinctions, and give references to the optical spectra used. In Figure 2 we plot the luminosities (corrected for extinction based on estimates from the various line pairs) as a function of infrared luminosity.
| Object | E(B-V) | E(B-V) | E(B-V) | Ref. |
|---|---|---|---|---|
| (1) | (2) | (3) | (4) | (5) |
| 00188-0856N | 1.46 | 1.59 | 1 | |
| 01003-2238 | 0.71 | 1.43 | 1 | |
| 01166-0844 | 0.32 | 1 | ||
| 01298-0744 | 0.71 | 0.77 | 1 | |
| 01388-4618 | 4.64 | |||
| 02411+0354Main | 0.66 | 1.41 | 6.37 | 1 |
| 02411+0354W | 0.79 | 1.07 | 1 | |
| 03521+0028 | 2.36 | 2.43 | 1 | |
| 04063-3236NE | 1.85 | |||
| 04063-3236SW | ||||
| 06009-7716E | ||||
| 06009-7716W | 6.40 | |||
| 06035-7102W | 1.36 | 0.85 | 2 | |
| 06035-7102E | 0.94 | 0.08 | 2 | |
| 19458+0944 | 5.54 | |||
| 20100-4156 | 0.96 | 1.75 | ||
| 20446-6128N | 5.23 | |||
| 20446-6128S | ||||
| 20551-4250 | 1.06 | 0.48 | 4.88 | 2 |
| 23128-5919N | 1.03 | 1.45 | 1.19 | 2 |
| 23128-5919S | 0.76 | 1.77 | 2.46 | 2 |
| 23230-6926 | 1.30 | 1.28 | 4.71 | 2 |
| 23389-6139 | 1.01 | 1.19 | 1.67 | 1/2 |
Col. (5) — References for the optical line measurements. 1: Veilleux et al. (1999a). 2:
Duc et al. (1997).
The calculations are based on case B recombination, a temperature
K, an electron density (Hummer & Storey 1987) and the foreground
absorber modell. We adopted the extinction coefficients of Veilleux et al. (1997a).
Our main results are: For most of the ULIRGs with extinction correction based on purely optical / and optical/near-infrared /, we detect a deficit of flux with respect to what one would expect for a starburst (solid line in Fig. 2), thus confirming the results of Goldader et al. (1995, 1997a, 1997b).
For the subsample where the extinction correction came from purely near-infrared / line ratio, there is definitely no -deficit but rather on average an excess of flux. It is difficult to estimate to which extent this excess would be reduced if a similar near-infrared extinction correction were to be applied to the lower luminosity reference sample — the reference objects are typically dusty starbursts for which such ‘wavelength-dependent’ extinction may be present as well, at a lower level than in the ULIRGs (see the case of M 82 (McLeod et al. 1993) which also shows that this ‘wavelength-dependent’ extinction is an artifact of enforcing a screen model). A tendency may be present in our data for galaxies with high /IR to have detections of the HeI line at 2.058 (Fig. 2). Despite various other complex effects in the interpretation of this line (e.g., Shields 1993), this may be consistent with younger bursts having both harder ionizing radiation and a higher ratio of ionizing to bolometric luminosity. In agreement with the results from ISO spectroscopy (Genzel et al. 1998), our findings suggest that the deficit in ionizing luminosity derived from near-infrared spectra of ULIRGs is indeed an obscuration effect, such that much of the ‘missing’ luminosity is in the form of highly obscured (A mag) starburst activity.

4.3 Emission in ULIRGs: Characteristic of the LINER-phenomenon?
Rieke et al. (1980) detected for the first time a near-infrared line of at 1.644 ( ) in an extragalactic object, the starburst galaxy M 82. A few years later, by investigating the supernova remnant IC 443, Graham et al. (1987) proposed that this line could be a good indicator for shock activity in astronomical objects. Mouri et al. (1990) and Mouri et al. (1993) pointed out a correlation between and ascribed to the fact that and arise mostly in partially ionized zones which are created either by relatively fast shocks (100 ) or by X-ray radiation from an AGN. They established a dignostic diagram, and being normalized by the hydrogen recombination lines and , respectively (Fig. 1a in Mouri et al. (1990) and Fig. 3 in this paper). As the hydrogen recombination lines arise from fully ionized zones, the and ratios are a measure of the ratio of the volume of the partially relative to the fully ionized zones. Figure 3 shows the two line ratios: such a diagram sketches nicely the increasing importance of shocks, or of X-ray excitation when going from star-formation to AGN activity. Several studies (e.g. Moorwood & Oliva 1988; Greenhouse et al. 1991, 1997; Mouri et al. 1993; Forbes & Ward 1993; Vanzi & Rieke 1997) argued that in the case of starburst galaxies shock activity caused by supernova remnants and superwinds is responsible for the observed emission and emission.
Our SOFI spectra cover most of the H and K band, including [FeII] at 1.644 and/or 1.257 for several targets. This motivated a study of the properties of ULIRGs in general for which we added ULIRGs from Veilleux et al. (1997b, 1999b) in order to improve the statistics. Our sample includes ULIRGs with both and measurements (Veilleux et al. 1995, 1997b, 1999b; Duc et al. 1997; Kim et al. 1998). In total our sample comprises 21 ULIRGs. We categorize the ULIRGs according to their optically classified spectral type as Starburst-, AGN- or LINER-ULIRGs following the classification scheme established by Veilleux & Osterbrock (1987). In addition, we include in Fig. 3 for comparison, some lower luminosity Starbursts, Seyfert and composite galaxies. Representatives of pure shock- and photoionization excitation, the supernova remnant IC 443 and RCW 103 as well the Orion nebulae are added 555Data of reference objects are taken from: Moorwood & Oliva (1988); Armus et al. (1989); Veron-Cetty & Veron (1986); Kawara et al. (1988); Aitken et al. (1981); French (1980); Johansson (1987); Rieke et al. (1980); Peimbert & Spinrad (1970); Rieke & Lebofsky (1981); Boksenberg et al. (1975); Welch (1970); Wilson et al. (1976); Lester et al. (1988); Heckman et al. (1987); Cohen (1983); Lowe et al. (1979); Balick et al. (1980); Graham et al. (1987); Fesen & Kirshner (1980); Oliva et al. (1989); Leibowitz & Danziger (1983); Veilleux et al. (1997b, 1999b); Veilleux et al. (1999a); Duc et al. (1997); Kim et al. (1998).
Since integrated ULIRG spectra represent a heterogeneous mixture of different astronomical objects, (e.g., HII-regions, SNRs, PDRs, winds and AGNs) it is not surprising to find them between the loci of pure HII-regions and pure shock excitation. Starburst-ULIRGs and LINER-ULIRGs populate different regions of the diagram. On average (see Table 5 and in Fig. 3 the enhanced symbols with error bars), both flux ratios, and , are higher in LINER-ULIRGs than in starburst-ULIRGs. The latter also have somewhat higher ratios when compared to lower luminosity starbursts. AGN-ULIRGs populate a region of high ratios, similar to lower luminosity Seyferts. The complex origin of the iron emission makes clear statements difficult, in particular for individual sources.
| Object class | log{} | log{} |
|---|---|---|
| (1) | (2) | (3) |
| LINER-ULIRG | -0.930.07 | 0.540.15 |
| HII-ULIRG | -1.160.17 | 0.190.08 |
| Seyfert2-ULIRG | -1.000.07 | 0.400.17 |
| HII-galaxy | -1.850.15 | 0.100.10 |
| Seyfert-galaxy | -0.980.18 | 0.470.21 |
| Composite object∗ | -1.570.09 | 0.190.12 |
∗: Composite objects exhibit both starburst and seyfert activity.
In what follows we describe a scenario which could be a plausible explanation of our observations: All starburst-ULIRGs and even more strongly the LINER-ULIRGs exhibit an elevated level of supernova- or superwind-related shock activity when compared to normal (lower luminosity) starbursts. A number of effects may contribute to this behaviour: Alonso-Herrero et al. (2000), among others, suggested that the elevated shock activity (with respect to HII-region activity) could be due to an aging starburst. The hot ionizing stars live only for about 10 million years while supernova and wind activity sets in after a few million years and persists longer. The detection of the HeI 2.058 line in some starburst-ULIRGs but no LINER-ULIRGs is indeed consistent with this model. Furthermore, the measured equivalent width of the hydrogen recombination lines being an indicator of the age of the burst tends in LINER-ULIRGs to be smaller than in HII-ULIRGs. Applying on our sample Fig. 7 of Alonso-Herrero et al. (2000) where log{}666Following Simpson et al. (1996), this flux ratio could be used as a rough estimator for the age of the starburst. versus log{K/} is plotted, we would estimate burst ages between Myrs for the LINER-ULIRGs (assuming a burst duration of 1 Myr). Additionally, differential extinction could also play a role: a larger scale wind will be less obscured than the embedded star forming regions. Goldader et al. (1995) invoked this scenario to explain the absence of a deficit in H2 emission in ULIRGs showing a deficit. Qualitatively, such an effect may be indicated by sources having shock-like ratios (from the outer wind) but more HII-region like (from the more obscured starburst). Figure 3 may indeed contain such sources.
AGN-ULIRGs populate a similar region in Fig. 3 as do lower luminosity Seyferts. This likely means a strong contribution of AGN X-rays and AGN winds to their emission, but the considerable overlap with other categories also allows significant non-AGN contributions. It is unlikely that AGN dominate the emission of the starburst- and LINER-ULIRGs. It would be difficult to consistently avoid detection of from the AGN in that case. Most of the observed / limits of the starburst-ULIRGs are higher than the ratios for bona fide Seyferts. This indicates that [FeII] emission in starbursts-ULIRGs and LINER-ULIRGs likely originates in a starburst superwind rather than in an AGN.

4.4 Notes on individual galaxies
4.4.1 F001837111: Extreme Emission
F001837111 is the most distant (z ) and most luminous object ( L☉) in the ULIRG-sample observed with SOFI. Armus et al. (1989) classified this galaxy in the optical as a LINER. In the mid-infrared, Tran et al. (2001) found that this object displays extraordinary absorption features of silicates and ices and interpreted it as a heavily obscured AGN. Recently, Spitzer IRS observations by Spoon et al. (2004) strengthened this interpretation. Unfortunately, the prime AGN indicator is redshifted outside of the K band and cannot be used. We do not see a broad component. In this ULIRG, we measured the greatest intrinsic line width of [FeII] lines in our sample, and , for and , respectively. The flux ratio of (from measured ) is higher than in normal ULIRGs and similar to the ’near-ULIRG’ NGC 6240. Both an AGN and a shock origin of this emission are possible, the large intrinsic half width of the iron lines, larger than , may favour shock activity. The observed luminosity of both lines combined is L☉. For comparision, in NGC 6240 the observed luminosity of these two lines combined is L☉. The extinction to the emitting region can be estimated using the two iron lines arising from the same upper level, with an intrinsic flux ratio of 1.36 (Nussbaumer & Storey 1988). We obtain mag using the extinction curve of Rieke & Lebofsky (1985), and mag using Koorneef (1983). Assuming a foreground absorber we estimate an extinction corrected luminosity of both lines combined of L☉ and L☉ for the two extinction laws, respectively. The extreme luminosity and the unusual mid-infrared spectrum (Tran et al. 2001; Spoon et al. 2004) motivate further studies of F001837111 as an atypical ULIRG.
4.4.2 F23578-5307: The galaxy with one of the highest luminosities
The lines of the rotation-vibration transition 1-0 S(…) dominate the spectrum of F235785307 (z ; L☉) and, atypical for ULIRGs, is not the strongest line in the near-infrared spectrum. Very few ULIRGs have similar characteristics, the best known example being the ‘near-ULIRG’ NGC6240 which has long been famous as the galaxy with the highest luminosity in emission (Joseph et al. 1984). Van der Werf et al. (1993), Tecza et al. (2000) and Lutz et al. (2003) suggest that large scale shocks are responsible for the strong emission in NGC 6240. Their line imaging indicates that the emission in NGC 6240 does not arise from the two nuclei proper but from an extended region centered between these two nuclei. van der Werf et al. (1993) determined an observed luminosity of L☉ for the line. In F235785307, the observed luminosity of the line is L☉, a factor 3.5 more than for NGC 6240, and well above the ULIRG IRAS F090390503 ( L☉, Veilleux et al. (1997b)), with one of the strongest H2 emission lines relative to Pa in the ULIRG population. The equivalent width of 42.7Å observed for in F235785307 is well above the Å typical for ULIRGs (Goldader et al. 1995) but short of the 71 Å of NGC 6240. This confirms that the large H2 luminosity reflects an unusual type of activity and is not just a consequence of scaling up a normal ULIRG spectrum.
Further studies of these systems may help determining the origin of such extreme luminosities. Is the situation for NGC6240, i.e. strong emission between two nuclei of a merging system, typical? Images of F235785307 taken at NTT/SOFI (see Rigopoulou et al. 1999)) and the VLT/ISAAC (Tacconi, priv. communication) under good (0.8″) and excellent seeing (0.35″) conditions, respectively, show that this ULIRG has a single nucleus. So far, there are no hints that this extraordinary ULIRG has a similar morphology as NGC 6240 where the projected seperation of the two nuclei is 0.75 kpcs. At the distance of IRAS F235785307 this would correspond to ″, allowing to barely resolve the two nuclei.
5 Conclusions
We have obtained moderate resolution near-infrared spectroscopy of a sample of ULIRGs previously studied in the mid-infrared with ISO. A first goal was the search for near-infrared indications of AGN activity, namely broad components to the hydrogen recombination lines or , and detection of the coronal line 1.962 m. Most spectra do not show these indicators and appear starburst-like. In none of the 24 ULIRGs do we detect a broad velocity component of the hydrogen recombination lines. In IRAS 04114E we have evidence for a line with a luminosity of L☉ (no extinction correction applied). The agreement of near- and mid-infrared classification is good, in line with previous suggestions that AGN in ULIRGs are often visible over a wide wavelength range, and with the majority of ULIRGs being predominantly starburst-powered.
We have revisited the ‘-deficit’ in ULIRGs found by Goldader et al. (1995, 1997b). Using the line pair , for extinction correction, we confirm their result by finding a -deficit. However, when using the two near-infrared lines and , the inferred extinction is significantly higher and no deficit of ionizing luminosity is found on average. This is consistent with most of the luminosity in these sources being powered by star formation at A mag.
Many ULIRGs are found to be strong emitters of . ULIRGs that are optically classified as LINER or starburst also populate different regions in a diagnostic diagram using the ratios and . These observations are consistent with LINERs in infrared galaxies being due to supernova and superwind related shocks. Age effects and/or different location and obscuration of the wind and starburst regions may contribute to making a particular source a starburst or LINER type.
Two unusual objects were identified in the sample. IRAS F001837111 which ISO observation suggest to be an obscured AGN exhibits extremely wide and strong lines of . IRAS F235785307 is one of the most luminous infrared galaxies in according to our knowledge.
Acknowledgements.
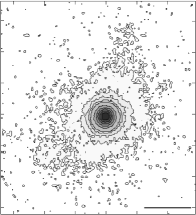
We like to thank Matthew D. Lehnert for helpful discussion during the data analysis and interpretation of the results and as well Sylvain Veilleux for interesting conversation about part of the results. Additionally, we are grateful to the staff of ESO for their support with data acquisition and reduction. Finally, we would like to thank the anonymous referee for valuable comments. This research has made use of the NASA/IPAC Extragalactic Database (NED) which is operated by the Jet Propulsion Laboratory, California Institute of Technology, under contract with the National Aeronautics and Space Administration.Appendix A K band Image of IRAS19458+0944
The 5 minute Ks-band image taken at NTT/SOFI during the second run (Fig. 4) shows a single system which seems to be almost relaxed. In an aperture of 4 arcseconds, the magnitude in Ks is 13.1 mag (Vega).
References
- Aitken et al. (1981) Aitken, D. K., Roche, P.F., & Philips, M. M. 1981, MNRAS, 196, 101
- Alexander et al. (1999) Alexander, T., Sturm, E., Lutz, D., et al. 1999, ApJ, 512, 204
- Alexander et al. (2000) Alexander, T., Lutz, D., Sturm, E., et al. 2000, ApJ, 536, 710
- Allen et al. (1991) Allen, D. A., Norris, R. P., Meadows, V. S., & Roche, P. F. 1991, MNRAS, 248, 528
- Alonso-Herrero et al. (2000) Alonso-Herrero, A., Rieke, M. J., Rieke, G. H., & Shields, J. C. 2000, ApJ, 530, 688
- Armus et al. (1989) Armus, L., Heckman, T. M., & Miley, G. K. 1989, ApJ, 347, 727
- Balick et al. (1980) Balick, B., Smith, M. G., & Gull, T.R. 1980, PASP, 92, 22
- Black & van Dishoeck (1987) Black, J. H., & van Dishoeck, E. F. 1987, ApJ, 322, 412
- Boksenberg et al. (1975) Boksenberg, A., Shortridge, K., Allen, D. A., et al. 1975, MNRAS, 173, 381
- Borne et al. (2000) Borne, K. D., Bushouse, H., Lucas, R. A., & Colina, L. 2000, ApJ, 529, L77
- Burston et al. (2001) Burston, A. J., Ward, M. J., & Davies, R.I. 2001, MNRAS, 326, 403
- Cohen (1983) Cohen, R. D. 1983, ApJ, 273, 489
- Devillard (1997) Devillard, N., 1997, The Messenger, 87, 19, The eclipse software
- Duc et al. (1997) Duc, P.-A., Mirabel, I. F., & Maza, J. 1997, A&AS, 124, 533
- Fesen & Kirshner (1980) Fesen, R. A. & Kirshner, R. P. 1980, ApJ, 242, 1023
- Fisher et al. (1995) Fisher, K. B., Huchra, J. P., Strauss, M. A., et al. 1995, ApJS, 100, 69
- Forbes & Ward (1993) Forbes, D. A., & Ward, M. J. 1993, ApJ, 416, 150
- French (1980) French, H. B. 1980, ApJ, 240, 41
- Genzel & Cesarsky (2000) Genzel, R., & Cesarsky, C. 2000, ARA&A, 38, 761
- Genzel et al. (1998) Genzel, R., et al. 1998, ApJ, 498, 579
- Goldader et al. (1995) Goldader, J. D., Joseph, R. D., Doyon, R., & Sanders, D. B. 1995, ApJ, 444, 97
- Goldader et al. (1997a) Goldader, J. D., Joseph, R. D., Doyon, R., & Sanders, D. B. 1997a, ApJS, 108, 449
- Goldader et al. (1997b) Goldader, J. D., Joseph, R. D., Doyon, R., & Sanders, D. B. 1997b, ApJ, 474, 104
- Graham et al. (1987) Graham, J. R., Wright, G. S., & Longmore, A. J. 1987, ApJ, 313, 847
- Greenhouse et al. (1991) Greenhouse, M. A., Woodward, C. E., Thronson, H. A. Jr., et al. 1991, ApJ, 383, 164
- Greenhouse et al. (1997) Greenhouse, M. A., et al. 1997, ApJ, 476, 105
- Heckman et al. (1987) Heckman, T. M., Armus, L., & Miley, G. K. 1987, ApJ, 93, 276
- Hummer & Storey (1987) Hummer, D. G., & Storey, P. J. 1987, MNRAS, 224, 801
- Johansson (1987) Johansson, I. 1987, A&A, 182, 179
- Joseph et al. (1984) Joseph, R. D., Wright, G. S., & Wade, R. 1984, Nature, 311, 132
- Kawara et al. (1988) Kawara, K., Taniguchi, Y., & Nishida, M. 1988, ApJ, 328, L41
- Kessler et al. (1996) Kessler, M. F., et al. 1996, A&A, 315, L27
- Kewley et al. (2001) Kewley, L. J., Heisler, C. A., Dopita, M. A., & Lumsden, S. 2001, ApJS, 132, 37
- Kim et al. (1998) Kim, D.-C., Veilleux, S., & Sanders, D. B. 1998, ApJ, 508, 627
- Koorneef (1983) Koorneef, J. 1983, A&A, 128, 84
- Leibowitz & Danziger (1983) Leibowitz, E. M., & Danziger, I. J. 1983, MNRAS, 204, 273
- Lester et al. (1988) Lester, D. F., Harvey, P.M., & Carr, J. 1988, ApJ, 329, 641
- Lowe et al. (1979) Lowe, R. P., Moorhead, J. M., & Wehlau, W. H. 1979, ApJ, 228, 191
- Lutz et al. (1998) Lutz, D., Spoon, H. W. W., Rigopoulou, D., Moorwood, A. F. M, & Genzel, R. 1998, ApJ, 505, L103
- Lutz et al. (1999) Lutz, D., Veilleux, S., & Genzel, R. 1999, ApJ, 517, L13
- Lutz et al. (2002) Lutz, D., et al. 2002, A&A, 396, 439
- Lutz et al. (2003) Lutz, D., et al. 2003, A&A, 409, 876
- Maiolino et al. (1998) Maiolino, R., Krabbe, A., Thatte, N., & Genzel, R. 1998, ApJ, 493, 650
- Marconi et al. (1994) Marconi, A., Moorwood, A. F. M., Salvati, M., & Oliva, E. 1994, A&A, 291, 18
- Mathis (1990) Mathis, J.S. 1990, ARA&A, 28, 37
- McLeod et al. (1993) McLeod, K. K., Rieke, G. H., Rieke, M. J., & Kelly, D. M. 1993, ApJ, 412, 111
- Moorwood & Oliva (1988) Moorwood, A. F. M., & Oliva, E. 1988, A&A, 203, 278
- Moorwood et al. (1998) Moorwood, A. F. M., Cuby, J.-G., & Lidman, C. 1998, The Messenger, 91, 9
- Mouri et al. (1990) Mouri, H., Nishida, M., Taniguchi, Y., & Kawara, K. 1990, ApJ, 360, 55
- Mouri et al. (1993) Mouri, H., Kawara, K., & Taniguchi, Y. 1993, ApJ, 406, 52
- Murphy et al. (1999) Murphy, T. W., Soifer, B. T., Matthews, K., Kiger J. R., & Armus L. 1999, ApJ, 525, L85
- Murphy et al. (2000) Murphy, T. W., Soifer, B. T., Matthews, K., & Armus, L. 2000, AJ, 120, 1675
- Murphy et al. (2001) Murphy, T. W., Soifer, B. T., Matthews K., Armus L., & Kiger, J.R. 2001, AJ, 121, 97
- Nussbaumer & Storey (1988) Nussbaumer, H., & Storey, P.J. 1988, A&A, 193, 327
- Oliva et al. (1989) Oliva, E., Moorwood, A. F. M., & Danziger, I. J. 1989, A&A, 214, 307
- Peimbert & Spinrad (1970) Peimbert, M., & Spinrad, H. 1970, A&A, 7, 311
- Perault (1987) Perault, M. 1987, Structure et evolution des nuages moleculaires, Ph.D.-Thesis
- Rigopoulou et al. (1999) Rigopoulou, D., Spoon, H. W. W., Genzel, R., et al. 1999, AJ, 118, 2625
- Rieke & Lebofsky (1981) Rieke, G. H., & Lebofsky, M. J. 1981, ApJ, 250, 87
- Rieke & Lebofsky (1985) Rieke, G. H., & Lebofsky, M. J. 1985, ApJ, 288, 618
- Rieke et al. (1980) Rieke, G. H., Lebofsky, M. J., Thompson, R. I., Low, F. J., & Tokunaga, A. T. 1980, ApJ, 238, 24
- Sanders & Mirabel (1996) Sanders, D. B., & Mirabel, I. F. 1996, ARA&A, 34, 749
- Sanders et al. (1988a) Sanders, D. B., Soifer, B. T.,Elias, J. H., et al. 1988, ApJ, 325, 74
- Sanders et al. (1988b) Sanders, D. B., Soifer, B. T., Elias, J. H., Neugebauer, G., & Matthews, K. 1988, ApJ, 328, L35
- Sekiguchi & Wolstencroft (1993) Sekiguchi, K., & Wolstencroft, R. D. 1993, MNRAS, 263, 349
- Shields (1993) Shields, J. C. 1993, ApJ, 419, 181
- Shull & Hollenbach (1978) Shull, J. M., & Hollenbach, D. J. 1978, ApJ, 220, 525
- Simpson et al. (1996) Simpson, C., Forbes, D. A., Baker, A. C., & Ward, M.J. 1996, MNRAS, 283, 777
- Spoon et al. (2004) Spoon, H. W. W., et al. 2004, ApJS, 154, 184
- Sternberg & Dalgarno (1989) Sternberg, A., & Dalgarno, A. 1989, ApJ, 338, 197
- Stirpe (1990) Stirpe, G. M. 1990, A&AS, 85, 1049
- Strauss et al. (1990) Strauss, M. A., Davis, M., Yahil, A., & Huchra, J. P. 1990, ApJ, 361, 49
- Strauss et al. (1992) Strauss, M. A., Huchra, J. P., Davis, M., et al. 1992, ApJS, 83, 29
- Taniguchi et al. (1999) Taniguchi, Y., Yoshino, A., Ohyama, Y., & Nishiura, S. 1999, ApJ, 514, 660
- Tecza et al. (2000) Tecza, M., Genzel, R., Tacconi, L. J., et al. 2000, ApJ, 537, 178
- Tran et al. (2001) Tran, Q.D., et al. 2001, ApJ, 552, 527
- Valdés et al. (2005) Valdés, J. R., et al. 2005, A&A, 434, 149
- van der Werf et al. (1993) van der Werf, P. P., Genzel, R., Krabbe, A., et al. 1993, ApJ, 405, 522
- Vanzi & Rieke (1997) Vanzi, L., & Rieke, G. H. 1997, ApJ, 479, 694
- Veilleux & Osterbrock (1987) Veilleux, S., & Osterbrock, D. E. 1987, ApJS, 63, 295
- Veilleux et al. (1995) Veilleux, S., Kim, D.-C., Sanders, D. B., Mazzarella, J. M., & Soifer, B. T. 1995, ApJS, 98, 171
- Veilleux et al. (1997a) Veilleux, S., Goodrich, R. W., & Hill G. J. 1997a, ApJ, 477, 631
- Veilleux et al. (1997b) Veilleux, S., Sanders, D. B., & Kim, D.-C. 1997b, ApJ, 484, 92
- Veilleux et al. (1999a) Veilleux, S., Kim, D.-C., & Sanders, D. B. 1999a, ApJ, 522, 113
- Veilleux et al. (1999b) Veilleux, S., Sanders, D. B., & Kim, D.-C. 1999b, ApJ, 522, 139
- Veron-Cetty & Veron (1986) Veron-Cetty, M., & Veron, P. 1986, A&AS, 66, 335
- Welch (1970) Welch, G. A. 1970, ApJ, 161, 821
- Wilson et al. (1976) Wilson, A. S., Penston, M. V., Fosbury, R. A. E., & Boksenberg, A. 1976, MNRAS, 177, 673