Protostellar holes: Spitzer Space Telescope observations of the protostellar binary IRAS 16293-2422
Abstract
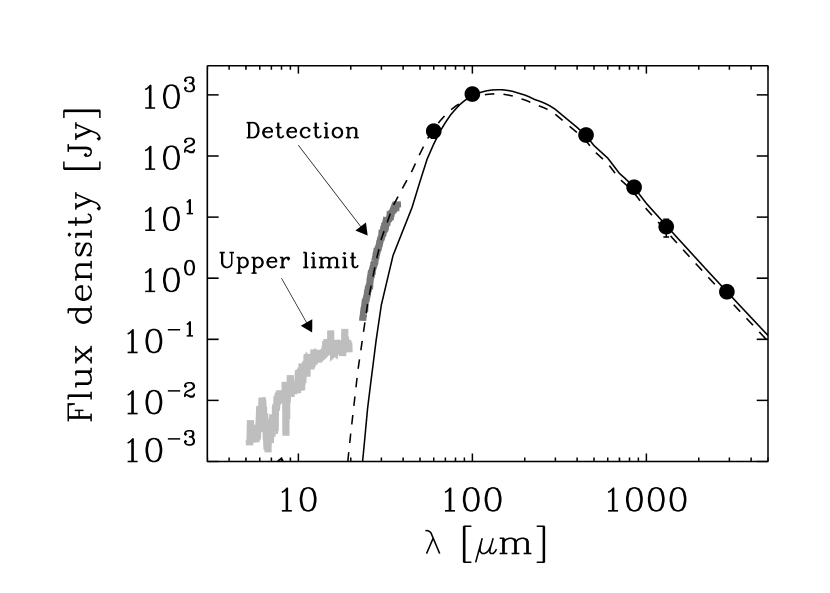
Mid-infrared (23–35 m) emission from the deeply embedded “Class 0” protostar IRAS 16293-2422 is detected with the Spitzer Space Telescope infrared spectrograph. A detailed radiative transfer model reproducing the full spectral energy distribution (SED) from 23 m to 1.3 mm requires a large inner cavity of radius 600 AU in the envelope to avoid quenching the emission from the central sources. This is consistent with a previous suggestion based on high angular resolution millimeter interferometric data. An alternative interpretation using a 2D model of the envelope with an outflow cavity can reproduce the SED but not the interferometer visibilities. The cavity size is comparable to the centrifugal radius of the envelope and therefore appears to be a natural consequence of the rotation of the protostellar core, which has also caused the fragmentation leading to the central protostellar binary. With a large cavity such as required by the data, the average temperature at a given radius does not increase above 60–80 K and although hot spots with higher temperatures may be present close to each protostar, these constitute a small fraction of the material in the inner envelope. The proposed cavity will also have consequences for the interpretation of molecular line data, especially of complex species probing high temperatures in the inner regions of the envelope.
1 Introduction
In the earliest stages of their evolution, low-mass young stellar objects are thought to be deeply embedded in an envelope of cold gas and dust. The objects therefore emit large fractions of their emission at far-infrared through submillimeter wavelengths. André et al. (1993) introduced the term “Class 0” for such protostars with where is the luminosity originating longwards of 350 m. The typical mid-infrared 10–20 m fluxes of these sources are predicted to be very weak, below 1 mJy. With the Spitzer Space Telescope’s high sensitivity, it now becomes possible to search for these objects in the mid-infrared and test models for their structure. This paper presents Spitzer/IRS observations of the deeply embedded low-mass protostar IRAS 16293-2422. These observations, together with a detailed dust radiative transfer model (Schöier et al., 2002, 2004), constrain the properties of the innermost region of the protostellar envelope.
In recent years, a substantial step forward in studies of deeply embedded protostars is the quantitative characterization of the physical structure of their envelopes through observations with submillimeter cameras combined with dust radiative transfer models (e.g., Shirley et al., 2000, 2002; Motte & André, 2001; Jørgensen et al., 2002). The submillimeter observations are predominantly sensitive to the cold material in the outer envelope, which is why the radiative transfer models constrain the structure of the envelope, such as its density and temperature profiles, on larger scales. Thus, the mid-infrared data probing the inner warm region are highly complementary.
Of all the protostars studied in this manner, IRAS 16293-2422 has gained particular attention: it is a protobinary with a separation of 800 AU (Mundy et al., 1992) and a total luminosity of 27 . With this luminosity, material in the inner 100 AU of the envelope will have temperatures higher than 100 K due to the heating from the central protostar(s) (Schöier et al., 2002). Interpretations of, e.g., the chemistry in these regions rely on extrapolation of the larger scale envelope parameters to small scales. A way to test the extrapolation is through aperture-synthesis observations of the dust continuum emission compared to the predictions from the models. Schöier et al. (2004) analyzed 1 mm observations from the Owens Valley Radio Observatory Millimeter Array and suggested that the envelope around IRAS 16293-2422 in fact has an inner cavity with a size corresponding to the well resolved binary. The projected binary separation of 800 AU would suggest a minimum inner radius for the envelope of 400 AU because the binary would clear a cavity through dynamical interaction. Still, these data are mostly sensitive to the cold dust in the envelope. Independent constraints can be obtained at mid-infrared wavelengths where it is possible to study the warm dust close to the central protostar. IRAS 16293-2422 is also known to drive prominent outflows (Walker et al., 1988), and the associated cavities may further allow the mid-infrared radiation to escape.
2 Observations
IRAS 16293-2422A was observed by the “Cores to Disks” (c2d) legacy team (Evans et al., 2003) using the infrared spectrograph (IRS) on 2004 August 29 (AOR key 11826944 (catalog ads/sa.spitzer#11826944)). The source was observed in staring mode with the SH and LH modules (m and m; ) and SL1 and SL2 modules (m; ). The observations were centered on the south eastern component in the protostellar binary at , (Looney et al., 2000).
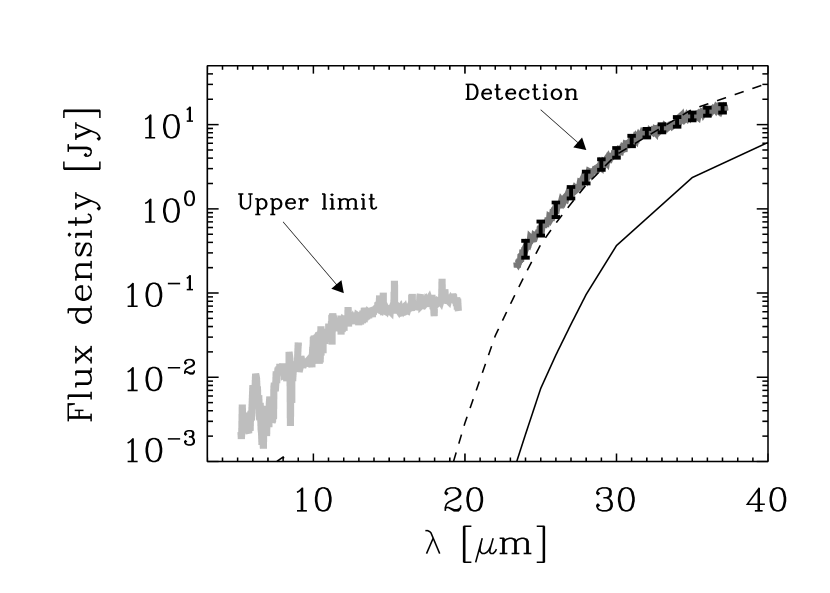
Data reduction started from the BCD images using S10.5.0 Spitzer archive data. The processing includes bad-pixel correction, extraction, defringing and order matching using the c2d analysis pipeline (Lahuis et al. in prep.). The source is not detected shortward of 23 m but rises steeply from 23–35 m (Fig. 1). For these wavelengths an optimized source profile extraction was used to separate the source from the extended cloud emission. H2 and PAH emission is also detected: both are extended and not directly associated with the source.
3 Dust radiative transfer model
3.1 Background
The model for the outer envelope structure by Schöier et al. (2002) cannot reproduce the mid-infrared flux seen by Spitzer (Fig. 1) and we therefore reexamine these models. In short, such models calculate the dust radiative transfer through a spherical envelope illuminated by a central source supplying the total luminosity using the 1D radiative transfer code Dusty (Ivezić et al., 1999). The inputs into the models are the spectrum of the central source (approximated as a blackbody with a specific effective temperature, ), the inner and outer radii of the envelope, and , and the density distribution of the envelope. The density distribution is typically described by a power-law profile, , leaving two free parameters: the slope and normalization, . The latter can be specified through the total dust optical depth at a specified wavelength (e.g., for the optical depth at 100 m). The spectrum of the central source and the inner radius of the envelope are not constrained by the submillimeter emission. As in Schöier et al. (2002) and Jørgensen et al. (2002) we adopt the opacities of coagulated dust grains with thin ice mantles at a density of cm-3 from Ossenkopf & Henning (1994). For further discussions of the models we refer to the cited papers.
The detection of IRAS 16293-2422 in the mid-infrared suggests that the envelope surrounding the source is less optically thick at these wavelengths compared to the model of Schöier et al. (2002), which severely underestimates the emission at mid-infrared wavelengths (Fig. 1). Its dust optical depth toward the central illuminating source is at 25 m. One option to reproduce the entire SED is to increase the inner radius of the envelope. This is consistent with the high angular resolution millimeter interferometric data by Schöier et al. (2004) who suggested the presence of an inner cavity in the envelope with a radius of 400 AU resolved by the interferometer. With such a cavity, the column density of material along the line of sight is decreased, whereas the total mass of the envelope and thereby the submillimeter emission remains largely unaffected.
3.2 Results
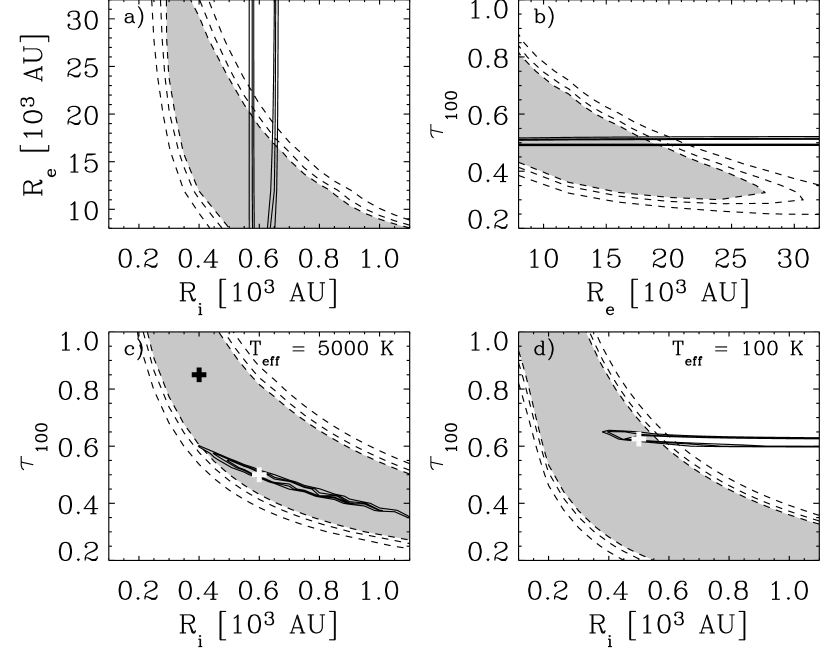
To test the idea of a larger inner radius, a grid of models is calculated varying and as in Schöier et al. - but now also letting vary. The slope of the density distribution, , is fixed to 1.9, which provides a good fit to the brightness distribution in single-dish observations on a few thousand AU scales and aperture synthesis observations on a few hundred AU scales (Schöier et al., 2002, 2004). To perform the fits and estimate the statistic, the mid-infrared spectrum is rebinned into fourteen m bins. The error in each measurement is taken to be the standard deviation of the flux measurements in each bin with an addition of 10% of the resulting flux, representing the uncertainty in the absolute flux calibration and relative calibration across the spectrum.
The confidence plots are shown in Fig. 2. As panels a)-c) illustrate, the mid-infrared SED provides good constraints on the size of the inner cavity whereas it is completely insensitive to the emission from the outermost regions of the envelope. Both the submillimeter and mid-infrared SEDs are well fitted by a model similar to that presented in Schöier et al. (2002) with the additional constraint from the IRS spectrum that AU (corresponding to ) (Fig. 2c). The reduced for the best fit model is and for the fits to the mid-infrared and far-infrared/submillimeter parts of the SED, respectively. A cavity of 400 AU radius suggested by the model of Schöier et al. (2004) is not ruled out by the mid-infrared observations (Fig. 2). That model fits the submillimeter SED and millimeter interferometer data which resolve the envelope cavity. Still, the mid-infrared data place stronger constraints on the thickness of the envelope in that particular case compared to just considering the submillimeter SED.
One natural concern is whether the spectral shape of the central source influences the result. In particular, the central circumstellar disks could be bright at mid-infrared wavelengths compared to the stellar blackbodies. Still, if the envelope is highly optically thick at 23–35 m the effect of changing the SED of the central source will be small. Fig. 2d illustrates the extreme example where the total luminosity of the central object is coming from a 100 K blackbody. The change in spectrum affects the larger scale emission of the envelope somewhat in the optically thin (long wavelength) regime but the requirement that the envelope only is marginally optically thick at 23–35 m still constrains the minimum cavity size.
3.3 Going to 2D?
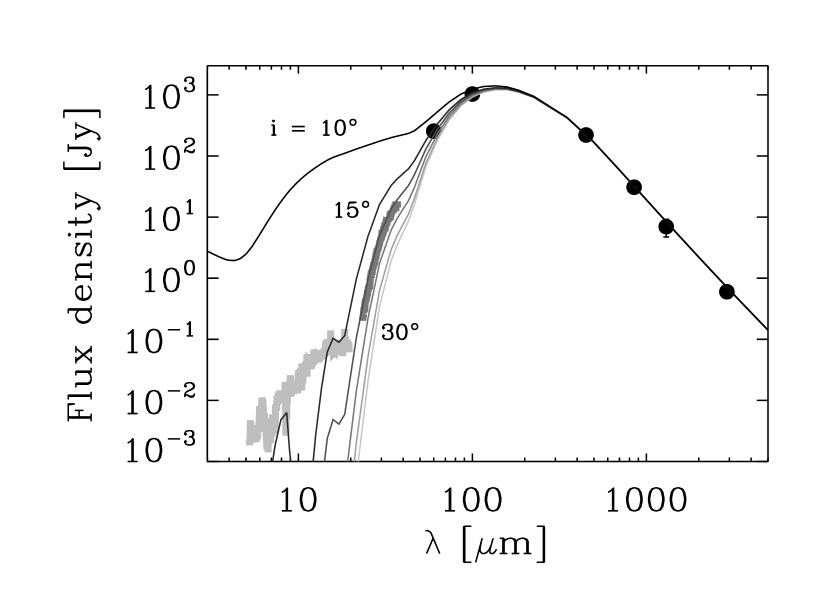
Another question is whether the 1D models truly represent the structure of the envelopes at the level of detail suggested by these observations. An alternative explanation for the increased mid-infrared radiation is that the 1D models are not a good representation of the structure of the envelope, since they do not contain any outflow cavities. Whitney et al. (2003) showed that the mid-infrared SED strongly depends on the inclination angle if a large outflow cavity is present in the envelope. To illustrate the sensitivity to the inclination angle, a 2D radiative transfer model was calculated using a dust Monte Carlo code (Dullemond & Turolla, 2000; Dullemond & Dominik, 2004). In this model, a conical slice of the envelope is cut out mimicking an outflow cavity. The cavity is assumed to have an opening angle of 30∘ and to be completely devoid of material. Otherwise the 2D structure is identical to the 1D model of Schöier et al. (2002), i.e., extending inwards to about 30 AU. Fig. 3 compares the SED for the 2D model with varying inclination angles. For lines-of-sight down or close to the cavity the mid-infrared flux is indeed increased and a good fit to the mid-infrared SED is obtained with an inclination angle of 17–20∘.
Introducing the outflow cavity, however, does not alleviate the need for an inner cavity inferred from the high angular resolution millimeter data: Fig. 4 compares the predicted visibilities at 1.37 mm from the 1D envelope models with increasing cavity sizes and the 2D model presented above. The 1D spherical model with a small inner cavity and the similar model with an outflow cavity are virtually indistinguishable and both produce too much flux on intermediate baselines (10–30 k). In contrast the visibilities from the models of Schöier et al. (2004) and this paper drop quickly at these projected baselines, as required by comparison to the interferometer data.
The mid-infrared and high angular resolution millimeter data are complementary: the best constraints on the 1D cavity model are obtained from the mid-infrared data probing the warm dust but the existence of the inner cavity is demonstrated by the millimeter interferometer data (which also provides constraints on the circumstellar disks embedded in the envelope). It should be emphasized that the data do not exclude the presence of an outflow cavity, but that an inner cavity is still required even though an outflow cavity can reproduce the mid-infrared data. An even more complicated multi-dimensional structure can also not be excluded.
4 Discussion
The inner cavity in the IRAS 16293-2422 envelope inferred here is of comparable size to the separation of the binaries. Does this simply reflect the centrifugal radius due to rotation in the core before the collapse into the binary? Zhou (1995) examined large scale CS single-dish observations and found that two regimes of rotation applied to the IRAS 16293-2422 core indicative of differential rotation: the inner region of the envelope rotating with s-1 and the outer region about factor 6 slower. A similar rotation rate in the inner envelope was found through single-dish observations by Narayanan et al. (1998). From comparison of the line observations to the Terebey et al. (1984) models of slowly rotating, infalling cores, Zhou found a centrifugal radius (where gravity is balanced by rotation) of 600 AU (corresponding to a collapse timescale of 1 years in the Terebey et al. (1984) model for the sound speed derived by Zhou). This similarity to the inner radius derived from the mid-infrared observations is striking: the requirement of an inner envelope cavity from the strength of the mid-infrared emission may simply reflect the centrifugal radius of the protostellar envelope.
Boss (1999) examined the properties of rotating collapsing cores. In these simulations cores with similar ratios between their rotation and gravitational energy such as IRAS 16293-2422 (; based on the estimates of the rotation rate by Zhou (1995) and the envelope structure in this paper) do indeed collapse and form a binary. It therefore seems that the conclusion about the inner cavity in the IRAS 16293-2422 envelope is a natural consequence of its rotation, which has also resulted in the protostellar binary. On the other hand, if the binary had formed by other means, the dynamical interaction between the binary components and the envelope would likely have resulted in clearing of the inner cavity.
The temperatures and densities in the outer envelope are very similar in both models with small and large inner cavities. The interpretation of the chemistry of molecular species probing these regions will therefore not be affected by the revised models in Schöier et al. (2004) and this paper. The interpretation of line emission coming from the inner “hot core” (e.g., Ceccarelli et al., 2000; Schöier et al., 2002) will clearly be affected, however. In the cavity model preferred here, the envelope temperature does not rise above 60–80 K. Locally, of course, the temperature will be higher since the binary separation is comparable to the cavity size. In particular, at the edge of the cavity close to each of the binary components the temperature should be higher than that obtained from the spherically symmetric calculations, whereas in orthogonal directions to the binary the temperature is expected to be lower. However, since each binary component can heat the envelope material above 100 K only within about 100 AU, it will be a small fraction of the envelope which has temperatures higher than 100 K typical of a “hot core”. It therefore appears likely that the complex organic species have a different origin than passively heated material in the protostellar envelope. An alternative could be accretion shocks in each of the circumstellar disks or, as suggested by the high angular resolution submillimeter observations by Chandler et al. (2005), a result of the shock associated with the IRAS 16293-2422A outflow.
References
- André et al. (1993) André, P., Ward-Thompson, D., & Barsony, M. 1993, ApJ, 406, 122
- Boss (1999) Boss, A. P. 1999, ApJ, 520, 744
- Ceccarelli et al. (2000) Ceccarelli, C., Castets, A., Caux, E., Hollenbach, D., Loinard, L., Molinari, S., & Tielens, A. G. G. M. 2000, A&A, 355, 1129
- Chandler et al. (2005) Chandler, C. J., Brogan, C. L., Shirley, Y. L., & Loinard, L. 2004, ApJ, in press. (astro-ph/0506435)
- Dullemond & Dominik (2004) Dullemond, C. P., & Dominik, C. 2004, A&A, 417, 159
- Dullemond & Turolla (2000) Dullemond, C. P., & Turolla, R. 2000, A&A, 360, 1187
- Evans et al. (2003) Evans, N. J., et al. 2003, PASP, 115, 965
- Ivezić et al. (1999) Ivezić, Ž., Nenkova, M., & Elitzur, M. 1999, User Manual for DUSTY, University of Kentucky Internal Report
- Jørgensen et al. (2002) Jørgensen, J. K., Schöier, F. L., & van Dishoeck, E. F. 2002, A&A, 389, 908
- Looney et al. (2000) Looney, L. W., Mundy, L. G., & Welch, W. J. 2000, ApJ, 529, 477
- Motte & André (2001) Motte, F., & André, P. 2001, A&A, 365, 440
- Mundy et al. (1992) Mundy, L. G., Wootten, A., Wilking, B. A., Blake, G. A., & Sargent, A. I. 1992, ApJ, 385, 306
- Narayanan et al. (1998) Narayanan, G., Walker, C. K., & Buckley, H. D. 1998, ApJ, 496, 292
- Ossenkopf & Henning (1994) Ossenkopf, V., & Henning, T. 1994, A&A, 291, 943
- Schöier et al. (2002) Schöier, F. L., Jørgensen, J. K., van Dishoeck, E. F., & Blake, G. A. 2002, A&A, 390, 1001
- Schöier et al. (2004) Schöier, F. L., Jørgensen, J. K., van Dishoeck, E. F., & Blake, G. A. 2004, A&A, 418, 185
- Shirley et al. (2002) Shirley, Y. L., Evans, N. J., & Rawlings, J. M. C. 2002, ApJ, 575, 337
- Shirley et al. (2000) Shirley, Y. L., Evans, N. J., Rawlings, J. M. C., & Gregersen, E. M. 2000, ApJS, 131, 249
- Terebey et al. (1984) Terebey, S., Shu, F. H., & Cassen, P. 1984, ApJ, 286, 529
- Walker et al. (1988) Walker, C. K., Lada, C. J., Young, E. T., & Margulis, M. 1988, ApJ, 332, 335
- Whitney et al. (2003) Whitney, B. A., Wood, K., Bjorkman, J. E., & Wolff, M. J. 2003, ApJ, 591, 1049
- Zhou (1995) Zhou, S. 1995, ApJ, 442, 685