Discovery of Fast X-ray Oscillations During the 1998 Giant Flare from SGR 1900+14
Abstract
We report the discovery of complex high frequency variability during the August 27, 1998 giant flare from SGR 1900+14 using the Rossi X-ray Timing Explorer (RXTE). We detect an Hz oscillation (QPO) during a 1 s interval beginning approximately 1 min after the initial hard spike. The modulation amplitude is energy dependent, reaching a maximum of 26% (rms) for photons above 30 keV, and is not detected below 11 keV, with a 90% confidence upper limit of 14% (rms). Remarkably, additional QPOs are detected in the average power spectrum of data segments centered on the rotational phase at which the 84 Hz signal was detected. Two signals, at 53.5 and 155.1 Hz, are strongly detected, while a third feature at 28 Hz is found with lower significance. These QPOs are not detected at other rotational phases. The phenomenology seen in the SGR 1900+14 flare is similar to that of QPOs recently reported by Israel et al. (2005) from the December 27, 2004 flare from SGR 1806-20, suggesting they may have a common origin, perhaps torsional vibrations of the neutron star crust. Indeed, an association of the four frequencies (in increasing order) found in SGR 1900+14 with = 2, 4, 7, and 13 toroidal modes appears plausible. We discuss our findings in the context of this model and show that if the stars have similar masses then the magnetic field in SGR 1806-20 must be about twice as large as in SGR 1900+14, broadly consistent with magnetic field estimates from pulse timing.
1 Introduction
The giant flares produced by highly magnetized neutron stars, “magnetars,” are amongst the most energetic of stellar phenomena. Three such flares have been recorded since the advent of satellite borne high energy detectors. The most recent event, from SGR 1806-20 (hereafter, 1806), was also the most luminous, generating upwards of erg in a matter of minutes (Terasawa et al., 2005; Palmer et al., 2005). At its peak the prodigious photon flux paralyzed almost all satellite instruments which viewed the event. The magnetic instability which powers such flares is likely associated with large scale fracturing of the neutron star crust (Flowers & Ruderman, 1977; Thompson & Duncan, 1995; Duncan, 1998; Thompson & Duncan, 2001; Schwartz et al., 2005), and will almost certainly excite large scale seismic motions within the star.
Recently, Israel et al. (2005) presented evidence from Rossi X-ray Timing Explorer (RXTE) observations of transient, high frequency quasi-periodic oscillations (QPOs) during the pulsating tail of the giant flare from 1806. They found 92.5 Hz QPOs approximately 200 s after the onset of the flare. These QPOs appear to be associated with a spectrally hard, unpulsed emission component, and are only detected during particular rotational phases. The presence of lower frequency, and Hz QPO features was also claimed. Israel et al. (2005) suggested that these QPOs may be due to global oscillation modes of the neutron star. In particular, they propose an association with torsional (toroidal) vibrations of the neutron star crust (Schumaker & Thorne, 1983; McDermott, van Horn & Hansen, 1988; Strohmayer, 1991; Duncan, 1998). Toroidal oscillations can be readily excited by crust fracturing, as demonstrated by the devastating 2004 Sumatra-Andaman earthquake (Park et al., 2005), and have periods within the range observed. Coupling to the magnetosphere via the magnetic field threading the crust appears to be a plausible method of modulating the X-ray flux during the flare, but a detailed model of this process is needed. We note that Barat et al. (1983) suggested torsional vibrations might explain a claimed 23 ms modulation during the initial spike of the March 5, 1979 flare from SGR 0526-66.
Motivated by the work of Israel et al. (2005) we investigated the fast timing properties of the only other giant flare observed with high sensitivity instrumentation; the August 27, 1998 event from SGR 1900+14 (hereafter, 1900, Hurley et al. 1999). Feroci et al. (2001) carried out a detailed study of the BeppoSAX and Ulysses data from this flare. They found a clear signal of the neutron star’s spin frequency ( Hz) and its harmonics in power spectra of the event, and modelled the pulsating tail with a trapped fireball model. Guidorzi et al. (2004) investigated the flare’s fast timing properties with BeppoSAX, but could not search the entire event due to a dearth of high time resolution data. Nevertheless, they presented evidence for a power law noise component extending above 100 Hz.
In this Letter we report the results of a timing study of this flare using the Proportional Counter Array (PCA) onboard RXTE. We detect a transient QPO at Hz during a s interval approximately 1 minute after flare onset, and a pair of persistent QPOs at 53.5 and 155.5 Hz associated with the rotational phase of the 84 Hz signal. After describing our timing study we conclude with a discussion of our findings in the context of neutron star toroidal oscillation modes.
2 Observations and Data Analysis
During the August 27, 1998 flare from 1900, RXTE was pointed at the cataclysmic variable AM Her, about away from it. The PCA was configured in one of the “good xenon” data modes (Goodxenon16s) with s resolution. This mode was identical to one running at the time of the 1806 flare except for a longer read-out cycle (16 s compared with 2 s for 1806) that led to data gaps during the flare. Nevertheless, high time resolution, unsaturated data are available for portions of the pulsating tail. Fig. 1 shows the lightcurve of the flare from both the Standard1 (bottom) and Goodxenon16s (top) modes. The Standard1 mode produces 1/8 s resolution light curves across the full PCA bandpass (nominally 2 - 90 keV). The gaps in the Goodxenon16s data occur because the buffer is filled before it can be read out. The buffer can store 16,000 events, and is read out every 16 s, so above a mean rate of s-1 gaps are inevitable.
Because of the gaps we first searched each good data interval separately, starting with the first interval following the peak of the flare (severe deadtime at the peak precludes a meaningful search there). We calculated power spectra with a Nyquist frequency of 2048 Hz using the good data in each interval. Based on the results of Israel et al. (2005) we averaged the power spectra to Hz frequency resolution to best match their reported QPO coherence values. We did not find any candidate detections in the first three data intervals, however, the power spectrum of the fourth interval (marked by the vertical dotted lines in Fig. 1) shows a significant peak at Hz. Fig. 2 shows the power spectrum from this interval in the 10 – 2048 Hz band at 1 Hz resolution. We estimated the significance using a distribution with 16 degrees of freedom, which is the distribution expected based on the number of independent frequency bins averaged. We fitted the observed distribution of noise powers with a function and confirmed that it is consistent with the expected noise distribution (see the inset to Fig. 2). The peak at 84 Hz has a single trial probability of based on this noise distribution. Multiplying by the number of frequency bins searched (2048) and a “confirmation bias” reflecting the fact that this was the fourth spectrum searched we arrive at a significance of , a fairly robust detection. The peak power corresponds to an average amplitude (rms) of 10.2%.
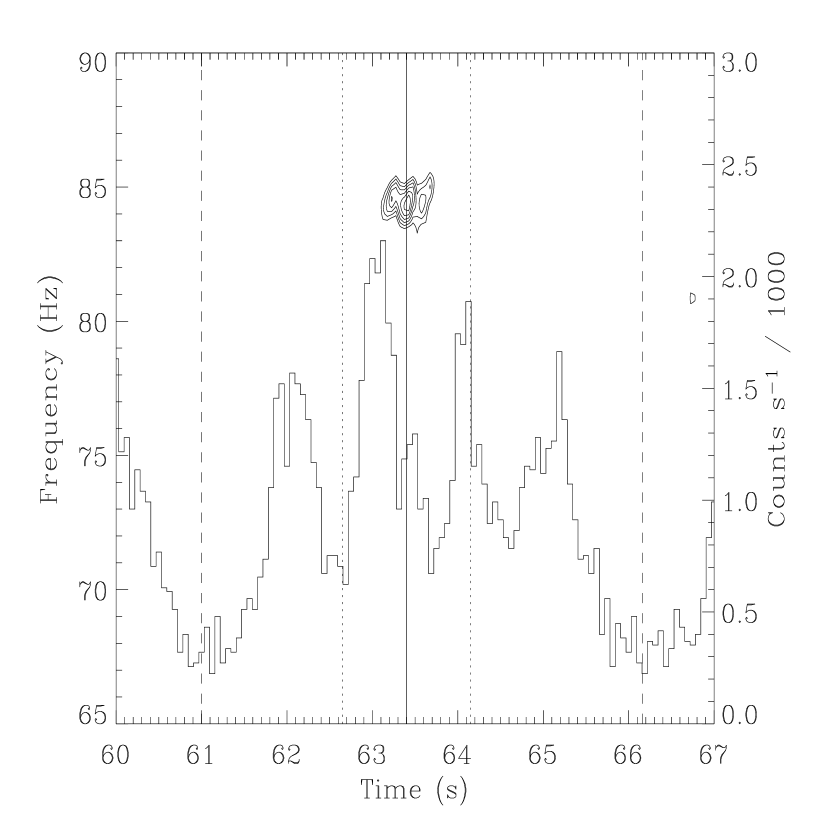
We next constructed a dynamic power spectrum using the statistic (Strohmayer & Markwardt, 1999). Fig. 3 shows a contour plot of this spectrum and the light curve of the fourth data segment. The 84 Hz signal is clearly localized in time near the largest peak of the four-peaked profile that emerged during the pulsating tail (Hurley et al., 1999; Feroci et al., 2001). Although the signal is not centered on the peak, we cannot rule out some association with its right flank. This behavior is similar to that reported by Israel et al. (2005), in that the oscillations are not centered on a peak. To quantify the amplitude variation with energy we computed power spectra for different energy bands, restricting the time range to the interval in which the signal was detected. The amplitude measurements are corrected for background, using data prior to the flare as an estimate of the total background. The amplitude (rms) in the 12 – 90 keV band is , increasing to for photons above 30 keV. For photon energies less than 18 keV we have a 90% confidence upper limit of about 14%. We note that a detailed spectral study of the flare is complicated by the fact that 1900 was not in the PCA field of view.
Israel et al. (2005) found that the QPOs in 1806 had a dependence on rotational phase. To test for such behavior we computed an average power spectrum using 1.5 s intervals centered on and beginning at the rotational phase of the 84 Hz signal. For the spin period we used the results of Woods et al. (1999). The resulting power spectrum from 20 independent intervals is plotted in Fig. 4 (middle and upper curves), and clearly shows an additional pair of QPOs, and perhaps a third. The time interval of this spectrum extends about 90 s beyond the 84 Hz detection. We fit this spectrum with a power law continuum and a pair of Lorenztian profiles for the two strongest QPOs. This model fits well, with a . The frequencies of the strongest QPOs are and Hz, with coherence values of 22 and 55, respectively. Their average amplitudes (rms) are and %. These QPOs are very significant; removal of the 53 and 155 Hz components increases by 72 and 134, respectively. The middle and top curves in Fig. 4 show the same power spectrum at different frequency resolution, 4 and 4/3 Hz, respectively. At the higher frequency resolution (top) there is a suggestive peak at about 28 Hz. Including a Lorentzian for this feature improves by 22.1, which is a bit better than a deviation, so we consider this a tentative detection. Finally, the strength of these features is a function of rotational phase. To confirm this we computed average power spectra in the same manner but centered on rotational phases away from that of the 84 Hz signal. Fig. 4 (bottom) shows the average power spectrum for phases centered s from that of the 84 Hz signal. The QPOs are clearly not detected. This analysis also confirms that the detected signals cannot be detector artifacts, but must be intrinsic to the source.
3 Discussion
Our results show striking similarities with those obtained for the 1806 flare by Israel et al. (2005). First, we find a frequency within 8% of the 92.5 Hz feature in 1806, suggesting the same underlying mechanism. Second, the strongest signal is transient, appears to be associated with a particular rotational phase and is not centered on a profile peak. Although the 92 Hz signal in 1806 persists for longer, this could be due to its larger overall luminosity, and we may have missed occurrences of the 84 Hz signal due to data gaps. In both flares the amplitude is greater at higher photon energies. However, there is no obvious hard DC component associated with the 84 Hz QPO in 1900, as in 1806 (Israel et al., 2005).
The firm detection of multiple QPOs associated with a specific rotational phase provides compelling evidence that the modulations are related to a particular region on the stellar surface, perhaps the site of a crust fracture, or a certain magnetic field bundle. Moreover, the comparisons to 1806 strongly suggest we are seeing a similar phenomenon in 1900. Israel et al. (2005) conjectured that toroidal oscillations of the neutron star might explain the observed frequencies. We now explore the implications of our findings in the context of this model.
For a non-rotating, non-magnetic star, Duncan (1998) estimates the period of the fundamental () toroidal mode (denoted ) to be
| (1) |
where km and . The periods of higher order modes ( modes have frequencies that are too high) are given by
| (2) |
where the factor in square brackets is a magnetic correction, G, and is the crustal density in units of g cm-3. Duncan (1998) argues that is appropriate since the mode periods are largely set by conditions in the deep crust. In deriving equation (2) it is assumed that magnetic tension boosts the crustal shear modulus isotropically. However, the field configuration and corresponding non-isotropic effects could alter the magnetic correction dramatically (Messios, Papadopoulos & Stergioulas, 2001).
Israel et al. (2005) suggest that their 92.5 Hz QPO, and a weaker feature at 30.4 Hz could be due to the and modes, respectively. Preferential excitement of higher modes is not unreasonable, being set by the fracture geometry: such an effect was seen in the spectrum of Earth modes excited by the 2004 Sumatra-Andaman earthquake (Park et al., 2005). With at least three frequencies in 1900 we can ask if identification with a sequence of modes of different is plausible. We find only one reasonably plausible sequence, that where the frequencies are due to the (53 Hz), (84 Hz) and (155 Hz) modes (see Figure 4). With this sequence the inferred mode frequency is Hz, lower than that for 1806, but, intriguingly, consistent with the frequency of our tentatively detected 28 Hz QPO. Although the mode frequencies in this sequence do not precisely match our QPO centroid frequencies, magnetic field corrections could plausibly account for the modest offsets.
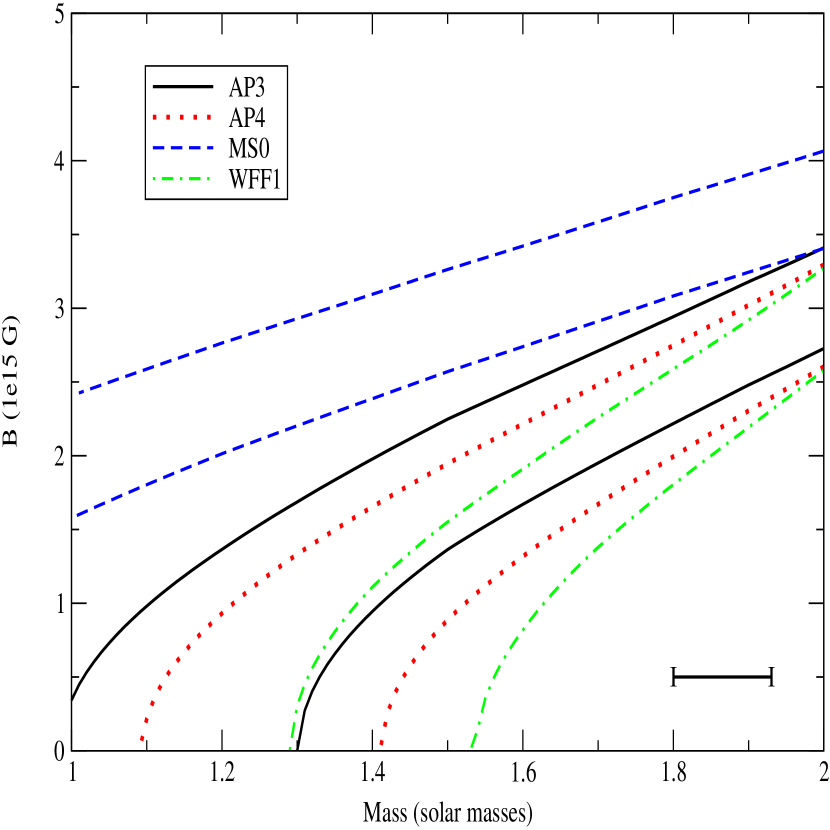
The different inferred mode frequencies imply that the stellar parameters must differ. Given an equation of state (EOS), equations (1)-(2) specify the relationship between mass and magnetic field necessary to give an oscillation at a desired frequency. Fig. 5 shows, for several EOS, the stellar parameters that give oscillations at 28 Hz (1900) and 30.4 Hz (1806). If the stars have similar magnetic field strengths, their masses must differ by more than . This seems unlikely unless magnetar masses differ significantly from those of other non-accreting neutron stars; a study of radio pulsars by Thorsett & Chakrabarty (1999) found the masses to be consistent with a narrow Gaussian distribution, . More likely the stars have similar masses but different magnetic fields. If we assume that both stars have masses , we can immediately rule out the softest EOS; and the hardest EOS predicts magnetic fields for both systems that are far larger than those inferred from timing studies (Woods et al., 2002). Neither the AP3 nor the AP4 EOS can be ruled out, given that the inferred mode frequency of 28 Hz has a Hz uncertainty. However, the magnetic fields that one would infer from these EOS agree well with those derived from timing measurements of both stars, which suggests that 1806 has a field strength approximately double that of 1900 (Woods & Thompson, 2005).
Feroci et al. (2001) and Thompson & Duncan (2001) have explored the radiative mechanisms associated with magnetar flares. They associate the four-peaked profile during the 1900 flare with X-ray “jets” produced by the strong polarization dependence of scattering in the G field. These jets form close to the surface and likely reflect the multipole structure of the magnetic field. Our detection of QPO signals shortly after the emergence of the four-peaked profile, in association with one of these “jets”, is consistent with a mechanism that produces motions at or near the stellar surface. Indeed, the presence of beamed emission offers a plausible scenario to achieve large amplitudes from modest surface displacements. For example, perturbations to the magnetic field geometry could produce changes in the jet angle with respect to a distant observer, creating a large change in observed flux.
4 Summary
The discovery of high frequency QPOs with the right scaling during a second magnetar flare is strong evidence that we may be seeing the influence of global toroidal modes of neutron star crusts on the X-ray emission from these objects. The recent results suggest these QPOs may be ubiquitous, in which case future observations of such flares, which we know will occur, albeit infrequently, could provide a new sensitive probe of neutron star structure. Efforts should be made to see that sensitive instrumentation is in place to observe the next such flare.
References
- Barat (1983) Barat, C. et al. 1983, A&A, 126, 400
- Duncan (1998) Duncan, R.C., 1998, ApJ, 498, L45
- Feroci et al. (2001) Feroci, M., et al., 2001, ApJ, 549, 1021
- Guidorzi et al. (2004) Guidorzi, C. et al., 2004, A&A, 416, 297
- Flowers & Ruderman (1977) Flowers, E., Ruderman, M.A., 1977, ApJ, 215, 302
- Hurley et al. (1999) Hurley, K., et al., 1999, Nature, 397, 41
- Israel et al. (2005) Israel, G., et al., 2005, ApJ, 628, L53
- Lattimer & Prakash (2001) Lattimer, J.M., Prakash, M., 2001, ApJ, 550, 426
- McDermott, van Horn & Hansen (1988) McDermott, P.N., van Horn, H.M., Hansen, C.J., 1988, ApJ, 325, 725
- Messios, Papadopoulos & Stergioulas (2001) Messios, N., Papadopoulos, D.B., Stergioulas, N., 2001, MNRAS, 328, 1161
- Palmer et al. (2005) Palmer, D.M., et al., 2005, Nature, 434, 1107
- Park et al. (2005) Park, J., et al., 2005, Science, 308, 1139
- Schumaker & Thorne (1983) Schumaker, B.L., Thorne, K.S., 1983, MNRAS, 203, 457
- Schwartz et al. (2005) Schwartz, S.J., et al., 2005, ApJ, 627, L129
- Strohmayer (1991) Strohmayer, T.E., 1991, ApJ, 372, 573
- Strohmayer & Markwardt (1999) Strohmayer, T.E., Markwardt, C.B., 1999, ApJ, 516, L81
- Terasawa et al. (2005) Terasawa, T., et al., 2005, Nature, 434, 1110
- Thompson & Duncan (2001) Thompson, C., & Duncan, R. C. 2001, ApJ, 561, 980
- Thompson & Duncan (1995) Thompson, C., Duncan, R.C., 1995, MNRAS, 275, 255
- Thorsett & Chakrabarty (1999) Thorsett, S.E., Chakrabarty, D., 1999, ApJ, 512, 288
- Woods et al. (2002) Woods, P.M., et al., 2002, ApJ, 576, 381
- Woods et al. (1999) Woods, P.M. et al. 1999, ApJ, 524, L55
- Woods & Thompson (2005) Woods, P.M., Thompson, C., to appear in Compact Stellar X-ray Sources, eds. W.H.G. Lewin and M. van der Klis, Cambridge University Press