A Millimeter Continuum Survey for Massive Protoclusters in the Outer Galaxy
Abstract
Our search for the earliest stages of massive star formation turned up twelve massive pre-protocluster candidates plus a few protoclusters. For this search, we selected 47 FIR-bright IRAS sources in the outer Galaxy. We mapped regions of several square arcminutes around the IRAS source in the millimeter continuum in order to find massive cold cloud cores possibly being in a very early stage of massive star formation. Masses and densities are derived for the 128 molecular cloud cores found in the obtained maps. We present these maps together with near-infrared, mid-infrared, and radio data collected from the 2MASS, MSX, and NVSS catalogs. Further data from the literature on detections of high-density tracers, outflows, and masers are added. The multi-wavelength datasets are used to characterize each observed region. The massive cloud cores () are placed in a tentative evolutionary sequence depending on their emission at the investigated wavelengths. Candidates for the youngest stages of massive star formation are identified by the lack of detections in the above-mentioned near-infrared, mid-infrared, and radio surveys. Twelve massive cores prominent in the millimeter continuum fulfill this requirement. Since neither FIR nor radio emission have been detected from these cloud cores massive protostars must be very deeply embedded in these cores. Some of these objects may actually Pre-Proto-cluster cores: an up to now rare object class, where the initial conditions of massive star formation can be studied.
1 INTRODUCTION
1.1 Motivation
Massive star formation (MSF) is far less understood than low-mass star formation, despite of its high impact on the dynamics of the interstellar medium and its importance for galactic evolution. There are two crucial questions: What are the earliest stages of massive star formation? Can we identify regions which are going to form massive stars together with their low-mass companions? Evans et al. (2002) pointed out that there are no clear examples for Pre-Proto-cluster Cores (PPclCs), as they named the high-mass analogs of the low-mass pre-stellar cores (Ward-Thompson et al., 1994). PPclCs may even not exist. Low-mass stars may already form while the cloud core still gathers mass to form massive stars. Then there would be no cold massive cloud core without signs of star formation, but still, a massive cloud core is needed to form a star cluster containing one or more massive stars. Evans et al. (2002) use a cloud of with an average density of about and a temperature of 10 K as a template for such a PPclC – a cold source prominent at millimeter wavelengths (5 Jy @ 1 mm for a 5.5 kpc distant core). When a PPclC starts to collapse, certainly forming more than one protostar, a massive protocluster is born deeply embedded in the core. The appearance in the millimeter continuum certainly does not change much in comparison with the original cold massive core, although the central temperature has increased. Therefore, if a cloud core, prominent in the millimeter continuum, lacks strong far-infrared emission, it is a candidate for a PPclC or a young protocluster. The main goal of our millimeter continuum survey has been to find candidates for these earliest stages of massive star formation.
1.2 The survey
But where to look for these early stages? Candidate cloud cores may be found in the vicinity of regions with on-going MSF. On-going MSF reveals itself by dust heated by the UV radiation of forming massive stars. The dust re-emits the absorbed energy at far infrared (FIR) and millimeter wavelengths. Thus, evolved protoclusters and young massive clusters can be revealed as luminous infrared point sources (Henning, 1990; Henning et al., 2000; Osterloh et al., 1997). Our strategy has been to use the brightest IRAS sources as lighthouses to guide us to regions of presumably young MSF sites (cf. Henning et al. 1992) and then have a closer look at longer wavelengths in search for younger objects, i.e. massive cloud cores off-set from the bright IRAS sources. Comparisons with observations at other wavelengths help to characterize the detected cloud cores.
We selected bright FIR sources in the outer Galaxy (to avoid source confusion) from the IRAS Point Source Catalog (PSC) to map them in the millimeter continuum. Large maps of 44 star-forming regions were obtained and are presented here. We compared the maps to publicly available surveys performed from near infrared (NIR) to radio wavelengths in order to characterize the objects found in our millimeter continuum maps. We used the 2MASS111The Two Micron All Sky Survey (2MASS) is a joint project of the University of Massachusetts and the Infrared Processing and Analysis Center/California Institute of Technology, funded by the National Aeronautics and Space Administration and the National Science Foundation (http://pegasus.phast.umass.edu). data (K band sensitivity: 14.3 mag) in the NIR. The mid-infrared (MIR) data comes from the MSX PSC222MSX – Midcourse Space Experiment. We use the MSX6C galactic plane and high latitude catalogs available at http://vizier.u-strasbg.fr/viz-bin/Cat?V/114 (Egan et al., 2003). Processing of the data was funded by the Ballistic Missile Defense Organization with additional support from NASA Office of Space Science. (4m– 21m, 90% complete down to 0.15 to 20 Jy depending on wavelength). The 1.4 GHz radio continuum data is taken from the NVSS333Condon et al. (1998) PSC (completeness limit: 2.5 mJy). Further data from the literature on maser and outflow detections are collected in this work, too.
Similar millimeter continuum surveys of selected MSF regions have been conducted by other groups. Hunter et al. (2000) acquired 350 m continuum data for 24 ultra-compact Hii (UCHii)-regions (radio- and IRAS-colors-selected). Mueller et al. (2002) observed 51 dense cores associated with H2O masers. Sridharan et al. (2002) and Beuther et al. (2002) carried out an extensive survey of 69 objects in the 3.6 cm and 1.2 mm continuum, and in spectral lines at millimeter and radio wavelengths. In their search for young sources, they targeted FIR bright IRAS-sources with CS detections and no 5 GHz radio detection. Recently, Faúndez et al. (2004) completed a 1.2 mm continuum survey of 146 southern high-mass star forming regions selected by their IRAS colors and CS detections. The overlap between the source lists of all these surveys and our targets is limited to a few sources.
1.3 Massive pre-protocluster candidates
The millimeter continuum maps present us with many cloud cores. Criteria are needed to identify the earliest stages of massive star formation. A mass limit can be established by estimating the minimum mass needed to form a massive star. The average star formation efficiency is only a few percent (Franco et al., 1994; Rodriguez-Gaspar et al., 1995; Diaz-Miller et al., 1998). However, taking only cloud cores into account, ignoring the rest of the star-forming molecular cloud, the star formation efficiency reaches probably values of the order of 50%. Such a value has been estimated for the Orion cluster (Hillenbrand & Hartmann, 1998). According to Miller & Scalo (1979), about 12% of the stellar mass is in massive stars (). Thus, to build a star and its low-mass companions, one needs at least a cloud core. In this work we will use a lower mass limit for massive cores of .
In order to characterize the massive cloud cores, which we find in our millimeter continuum survey, we employ a phenomenalistic evolutionary model outlined in Table 1. The model starts out with the hypothetical PPclCs (stage 0). The eventually collapsing center will start to produce massive and low-mass protostars, however the outside appearance of this stage 1, the early protocluster, will hardly be different from a PPclC. All radiation will be reprocessed and emitted by the surrounding cloud core and the spectral energy distribution (SED) resembles a single temperature (modified) blackbody. In stage 2, the protocluster heats the interior of the cloud core and clears a cavity. The massive stars develop UCHii regions as the accretion flow cannot quench them anymore. The object can be detected at radio wavelengths. Due to the heating, the SED peak shifts to shorter wavelengths and resembles no longer a (modified) blackbody. When the rising MIR emission is strong enough to be detected by the MSX satellite, we speak of stage 3, an evolved protocluster, within the scope of this work. When the cluster emerges from its parental cloud and gets detectable in the NIR (2MASS), we have a young cluster, stage 4. It continues to disperse the surrounding cloud core remnants. A star cluster is born, stage 5.
In this sequence, the luminosity in the MIR and then in the NIR rises whereas the millimeter luminosity slowly decreases. Therefore, our model complies with the suggestion by Minier et al. (2004) to use the ratio of the sub-millimeter luminosity to the bolometric luminosity () as indicator of the evolutionary state as André et al. (1993) applied it in low-mass star formation. Unfortunately, we cannot derive this quantity for our cloud cores, because of the lack of reliable FIR data to derive . Our maps show that often the IRAS data cannot be assigned to a millimeter continuum core unambiguously.
The evolutionary sequences is broken down into stages in such a way, that we can assign the stages according to detections in the used surveys. However, the first two stages (0 – PPclCs and 1 – early protocluster) cannot be distinguished within this work. The on-set of star formation separates these two stages, but this event does not change the appearance in the regarded survey of the cloud core immediately. We will call the cloud cores that fall into the first two stages massive pre-protocluster candidates. They have no association at infrared and radio wavelengths (2MASS, MSX, NVSS). Taking the spatial resolution of the surveys and our observations and pointing accuracies into account, there should be no 2MASS, MSX, or NVSS association within 10″ of the millimeter continuum peak and the mass must be 100 or higher.
2 OBSERVATIONS
2.1 The Source Sample
Our strategy to find the earliest stages of MSF is to search around bright FIR sources. We use the sample of bright FIR sources that has been compiled by Henning et al. (1992) for a maser search extending the sample of Snell et al. (1988, 1990) who performed an outflow search. The sample is created by applying the following criteria to the IRAS PSC:
-
•
S Jy with a flux quality ,
-
•
Right ascension range from 0 h to 12 h,
-
•
Declination range from to .
The first criterion selects all bright FIR objects seen by IRAS. The second criterion excludes the inner part of the Galaxy to avoid source confusion, while the last criterion ensures observability from the northern hemisphere. In Galactic coordinates, this selects longitudes to along the galactic plane. These criteria are fulfilled by 67 young stellar objects excluding IRC +10216 and M82 (Snell et al., 1990; Henning et al., 1992).
From December 1998 to March 2001, we searched this sample for massive pre-protocluster candidates by mapping 47 of these sources in 44 regions in the millimeter continuum. The remaining 20 sources were not mapped because these IRAS sources are mainly located in well-studied MSF regions such as Orion and W3. The millimeter continuum maps are the focus of this work. The source list together with some basic properties of the regions is presented in Table A Millimeter Continuum Survey for Massive Protoclusters in the Outer Galaxy. The 40 millimeter continuum maps with detections are presented in Figure 1 together with 2MASS, MSX PSC and NVSS PSC data. In the bolometer maps we reached an average sensitivity of 50 mJy/beam but the sensitivity from map to map varies strongly (3 to 700 mJy/beam). Additionally, the results of the above mentioned maser search and molecular line studies (Schreyer et al., 1996) together with the results of outflow and maser searches by other groups are compiled for the 47 objects in Table A Millimeter Continuum Survey for Massive Protoclusters in the Outer Galaxy. However, these searches targeted the respective IRAS PSC positions and often the results cannot be assigned to a source in our maps, because many cloud cores are displaced from the IRAS position.
2.2 Telescopes
The millimeter continuum maps were collected at three observatories: the Heinrich Hertz Submillimeter Telescope (SMT, Mt. Graham, AZ, USA), the ”Institut de Radioastronomie Millimétrique” (IRAM) 30 m telescope (Pico Veleta, Spain), and the James Clerk Maxwell Telescope (JCMT, Mauna Kea, HI, USA). The sections below describe the instruments used at these three telescopes together with the respective observing techniques. The basic parameters of these observations are given in Table 4.
The general observing strategy is common to all telescopes and instruments. To ensure good pointing and calibration, pointing, focus, and sky-dip (to measure the atmospheric opacity) observations were performed in appropriate intervals during the observing shifts. At least once during an observing shift a planet, when available, was observed for the flux calibration. At the JCMT only secondary flux calibrators could be observed. The reader will find a discussion of the flux calibration in § 2.3.
Heinrich Hertz Submillimeter Telescope
We used the SMT with the 19-channel bolometer developed by the Max-Planck-Institut für Radioastronomie (MPIfR), Bonn, Germany. It operates at 870m. The applied mapping technique and subsequent data reduction is the same for the 19-channel bolometer and MAMBO (see below). At the SMT, the scanning speed and steps in elevation were 8″ s-1 and 8″, respectively. We achieved a resolution of 26″ estimated from planet maps.
IRAM 30 m Telescope
We used MAMBO, the 37-channel bolometer with a central wavelength of 1.3 mm developed by the MPIfR (Kreysa et al., 1998), at the IRAM 30m telescope. The on-the-fly mapping technique was applied, where the bolometers are read out while the telescope is moving over the area. The area of interest is mapped in horizontal coordinates, i.e. the telescope moves in azimuth while integrating and then steps in elevation for the next scan. We scanned in azimuth with a speed of 5″ s-1 and in steps of 5″ in elevation. Due to the sky rotation, the subscans in azimuth are not parallel in equatorial coordinates, and the maps are more or less fan-shaped. Scanning may create artifacts along the scanning direction. To minimize these artifacts and to increase the sensitivity, we mapped the sources more than once at different hour angles. The data reduction was performed using the NIC software package (Broguière et al., 1996), which employs the EKH algorithm (Emerson et al., 1979) to restore the on-the-fly maps. The beam size has been 14″ to 17″.
James Clerk Maxwell Telescope
The bolometer array used at the JCMT at 850m is SCUBA (Holland et al., 1999). Its 37 channel long-wavelength array has the same hexagonal geometry as the MPIfR bolometers. The on-the-fly observing technique with SCUBA differs substantially from the “MPIfR method”. The observation is performed in equatorial coordinates instead of in horizontal coordinates. Following the work of Emerson (1995), a number of different chop configurations is used, in order to sample as many spatial frequencies as possible. Scanning artifacts are largely suppressed this way. We used the default setting of six different chop configurations: Chop throws of 20, 30 and 65″ each with chop position angles of 0° (DEC chopping) and 90° (RA chopping) in equatorial coordinates. The software package SURF (Jenness & Lightfoot, 1998) was used for reducing the SCUBA data and rendering the maps. The achieved beam size has been about 15″.
2.3 Calibration and Flux Density Measurements
Planets with their known fluxes are used as primary flux calibrators for millimeter continuum observations. At the JCMT, the calibration has been achieved using the secondary calibrators HL Tau and CRL 618. The fluxes of the planets and of these secondary calibrators are known up to a few percent. The calibration measurements have been executed to a precision of a few percent, too. These measurements provide the conversion factor from instrumental units to physical units like mJy/beam with an accuracy of about 10%.
Uranus and the secondary calibrators are sufficiently point-like to measure the beam profile (results see Table 4). The knowledge of the beam area is not only important for source size deconvolution and the spatial resolution but also for the calibration. It is necessary to convert mJy/beam to intensities not related to the beam size. We derived the beam sizes with accuracies of 1 to 2%.
For each of the seven observing runs, we derived one flux conversion factor and the full width half maximum (FWHM) of the telescope beam, , from the calibration measurements. The total flux density of the calibrators has been determined by integrating the respective sky-subtracted map inside a manually placed polygon close to the contour, i.e. three times the root mean square (rms) of the map’s background noise. This procedure has been repeated six times to average out the different polygons. The beam size is derived assuming a spherical Gaussian beam shape. The actual conversion factors and an extensive description of the calibration procedure can be found in Posselt (2003). The main uncertainty in determining the absolute flux level in the maps is due to the variability of the atmosphere. The atmospheric opacity is frequently (every one or two hrs) monitored by “sky-dips”, then interpolated for the observations in between. Depending on the stability of the atmosphere, the error in the flux level can be a few percent up to 10%. Altogether, the absolute calibration of the maps has an accuracy between 10 and 20% including systematic and statistical errors.
Similarly to the calibration, the integrated flux densities for a cloud core are based on the mean of the integrated flux in three polygons around the source peak position. Where possible the polygon borders are close to the contour. In the case of neighboring sources the polygon border between them corresponds to the local minimum identified by eye. A peak in the millimeter continuum maps is listed as individual cloud core, if it has at least a detection. Exceptions are made if the peaks are probably spurious due to map artifacts (e.g. IRAS 04324+5106). Multiple sources were identified by eye, having at least and usually at least two closed contours around each peak. Exceptions are made if the cloud core morphology as a whole encourages the interpretation as multiple sources (e.g. IRAS 03211+5446). To estimate roughly the beam-deconvolved angular diameter of the source, , a spherical source is assumed, having a map area equal to the mean area of the three polygons. Thus, can be estimated by , where is the corresponding beam size of the observation run as described above.
3 RESULTS
We detected millimeter continuum emission at a -level in almost all of our 44 targeted regions. Only in one region (IRAS 05281+3412 (catalog IRAS 05281+3412)), we did not detect any emission despite a high sensitivity (). In three other regions, no emission was detected, however due to limited sensitivity () only strong emission can be ruled out. Figure 1 displays the maps of the 40 regions with detections. The mean source area as well as , flux densities and the rms of the observations are given in Table 5.
3.1 Physical Quantities
Masses:
In order to derive gas masses for each millimeter condensation from the observed millimeter continuum emission, the following common formula has been applied:
| (1) |
where is the distance, the Planck function at the dust temperature and is the mass absorption coefficient of dust at the wavelength . The measured flux density is integrated over the map area as decribed above and listed in Table 5. This approach assumes optically thin dust emission which is justified by the long wavelength. The assumed gas to dust ratio is . The linear y interpolated dust opacities from Ossenkopf & Henning (1994)444thin ice mantles, density cm-3 have beeen used.
Furthermore, we need to assume a dust temperature . Individual estimates of dust temperatures for each IRAS source derived from IRAS m and m data are listed in Schreyer et al. (1996) and repeated in in Table A Millimeter Continuum Survey for Massive Protoclusters in the Outer Galaxy, though these color temperature are not physical dust temperatures. Mueller et al. (2002) obtain a mean temperature of K from their radiative transfer models of 31 objects. Similarly, Hunter et al. (2000) derive an average dust temperature of 35 K. It is safe to assume temperatures between 20 and 50 K. We list the masses for a temperature of K. For K, the gas masses are about 30% of the values in Table 6. The distances are in most cases kinematic distances which imply uncertainties of up to 50%. A small source of systematic uncertainty is the contribution of CO line emission within the observed continuum bands. Sandell (2000) finds a line flux contribution of about 8% at 850m for NGC 6334 by comparing 850m broadband JCMT UKT14 photometry with position-switched spectra for both sources. McCutcheon et al. (2000) adopt this value for their 1.3 mm observations. NGC 6334 is a MSF region similar to the star-forming regions investigated here. CO measurements of some of our sources indicate a line flux contribution of less than 2% (e.g. Snell et al. 1988; Carpenter et al. 1990).
Column densities:
The molecular hydrogen column densities N(H) through the core centers are derived as follows:
| (2) |
where is the mass of a hydrogen atom, and is the solid angle of the beam. The flux density is the peak flux density of each individual core.
Core densities:
Assuming that the source has the same extent along the line of sight as in the plane of the sky, one can derive the volume-averaged hydrogen number density by
| (3) |
where is the estimated beam-deconvolved angular diameter of the source as described in § 2.3. For crowded fields of “overlapping” sub-sources the considered map area is sometimes slightly smaller than the beam area. Therefore, cannot be determined by beam deconvolution. In these cases we use the angular diameter of the beam to get a safe lower limit on the core density even if the peaks are closer together. The actual source diameters are listed in column 8 of Table 5 where “B” marks the cases where the beam size limited the size determination.
3.2 The Millimeter Continuum Maps
We show the millimeter continuum maps as contour maps together with 2MASS K-band images and mark the positions of MIR and radio sources taken from the MSX and NVSS PSC catalogs, respectively. Thus, each panel in Figure 1 features:
-
•
A grey-scale image representing the K-band 2MASS image.
-
•
Contours representing the (sub-)millimeter map. The spacing of the contours is given below the panel in multiples of , the rms of the map’s background noise (Table 5). The first level is always . The spacing between levels is indicated by the increment . If the increment changes, a thick contour is drawn at the level indicated in bold font.
-
•
The IRAS sources plus positional error denoted by a diamond together with an error ellipse.
-
•
Entries in the MSX point source catalog denoted by a plus sign (resolution 18″, positional uncertainty 2″).
-
•
NVSS radio point sources indicated by triangles (resolution 45″, positional uncertainty ).
As we aim to find particularly early stages of massive star formation, protoclusters or PPclCs, the most interesting millimeter sources are those which have no association at shorter wavelengths and in the radio continuum. The detected twelve massive pre-protocluster candidates are compiled in § 4.3.
3.3 Source descriptions
Each short description of the observed regions and the millimeter continuum maps is titled with the name of the IRAS source in it. Regions with pre-protocluster candidates are marked. The telescope used for the observation and the respective wavelength are noted, too. When the description mentions of NIR, MIR, or radio observations, the 2MASS K-band images, the MSX PSC, or the NVSS PSC are meant, if not noted otherwise. For the NIR sources also 2MASS J-band and H-band were taken into account to identify embedded sources by their reddening. A classification of the massive cloud cores according to Table 1 is tried.
IRAS 01195+6136 (catalog IRAS 01195+6136) (JCMT 850m):
This region is also known as S 187 (Sharpless, 1959). No millimeter continuum emission was detected in the immediate vicinity of IRAS 01195+6136 (catalog IRAS 01195+6136). Only a small clump was detected 4′ southwest of IRAS 01195+6136 (catalog IRAS 01195+6136) and 2′ south of a star cluster. The panel in Figure 1 only shows the extract of the millimeter continuum map with the clump and the star cluster. This extract includes IRAS 01198+6136 (catalog IRAS 01198+6136) close to the cluster.
IRAS 02244+6117 (catalog IRAS 02244+6117) (IRAM 1.27 mm):
The millimeter continuum emission has the shape of a band extending from north to south delineating the border of a large emission nebula to the east. The Digitized Sky Survey (DSS) images suggest that we see the border of a bubble created by W 4 (associated with the open cluster IC 1805) about 30′ to the east. Kraemer et al. (2003) published MSX images of IRAS 02244+6117 (catalog IRAS 02244+6117), showing an arc of sources parallel to the millimeter continuum emission shifted to the north-west and IRAS 02245+6115 (catalog IRAS 02245+6115), a compact Hii region. The dust cloud causing the millimeter continuum emission can be seen as an extinction band against the background in the MSX 8.3m image.
IRAS 02575+6017 (catalog IRAS 02575+6017) (IRAM 1.27 mm):
This source is also known as AFGL 4029. We classify the centrally peaked massive core as a young cluster since it is associated with strong NIR/MIR sources. The envelope of the core looks compressed on the western side, which can be explained by inspecting the respective DSS plate, showing an emission arc at the border of the millimeter continuum emission. This arc is the edge of the extended Hii region S 199, which is excited by an O7 star (HD 18326). It is possible that we see triggered star formation here. The region of IRAS 02575+6017 (catalog IRAS 02575+6017) has been studied at different wavelengths by Deharveng et al. (1997), Zapata et al. (2001), and Ogura et al. (2002), however with different results on the star formation history of this region. To the south, a small patch of millimeter continuum emission close to another IRAS source is found. The two IRAS sources may be related since the above-mentioned arc encompasses both of them.
IRAS 02593+6016 (catalog IRAS 02593+6016) (IRAM 1.27 mm):
This IRAS source is located in the Hii region S 201. Due to its MIR appearance it is also known as AFGL 416. Despite being only 12′ east of the border of the extended Hii region S 199 (see IRAS 02575+6017 (catalog IRAS 02575+6017)) there is no apparent connection between these two regions. The region itself is powered by an O9.5 star (Mampaso et al., 1989).
In comparison with the DSS plate showing a bipolar emission nebula, the millimeter continuum structure intersects the optical emission nebula and, thus, is responsible for the dark lane in the nebula. Three molecular cores can be identified in the millimeter continuum emission. The highest peak is closest to the IRAS position, but there is a clear separation. If the offset to the MSX source close to the peak is real, this core would be a candidate for a massive protocluster (§ 4.3). However with the close MSX source and the millimeter continuum peak almost within the IRAS error ellipse, we classify this massive core as an evolved protocluster.
IRAS 03064+5638 (catalog IRAS 03064+5638) (SMT 870m) core #1a: pre-protocluster candidate:
For this region, also known as AFGL 5090, we have only a shallow map. We classify the massive core #1b as a young cluster: a faint IR cluster, an MSX detection, and radio emission are present. The prominent K-band source in the cluster is extremely red. The MSX detection is likely to be the same object deeply embedded in cloud core #1b. Core #1a, however is a massive pre-protocluster candidate. Our millimeter continuum observations and the CS () detection by Carpenter et al. (1993) indicate that there is still a large amount of gas associated with the cluster. In contrast to Carpenter et al. (1993), we use a distance of 4.1 kpc (Henning et al., 1992), because it corresponds better to the Galactic velocity field (Brand & Blitz, 1993). Note that the CS-traced gas mass estimated by Carpenter et al. (1993) is a factor of 5 lower than our derived gas mass estimate from millimeter continuum emission using the same distance of 2.2kpc. This may indicate that most of the gas is not concentrated in high-density cores traced by CS. Other reasons can be a different dust opacity, CS abundance, or dust-to-gas mass ratio.
IRAS 03211+5446 (catalog IRAS 03211+5446) (SMT 870m) core #1: pre-protocluster candidate:
An emission nebula, NIR sources together with an MSX as well as a radio point source are found at the position of massive cloud core #2, thus classified as a young cluster, while the IRAS source is about 1′ to the east. The massive core #1 does not show any association making it a pre-protocluster candidate. The relatively shallow millimeter continuum emission map indicates a rather large gas mass still remaining in this star-forming region. Targeting the IRAS source, no other indications of on-going star formation except for an H2O maser are known (Table A Millimeter Continuum Survey for Massive Protoclusters in the Outer Galaxy), though these non-detections may have missed the double-peaked cloud core.
IRAS 03236+5836 (catalog IRAS 03236+5836) (JCMT 850m):
The millimeter continuum map around IRAS 03236+5836 (catalog IRAS 03236+5836) (AFGL 490) reveals a “bridge” to IRAS 03233+5833 (catalog IRAS 03233+5833). Both IRAS sources coincide with prominent molecular cores. The “bridge” hosts another two, however less prominent cores. Both prominent cores have MSX detections as well. The source AFGL 490 is identified as a deeply embedded intermediate-mass young stellar object surrounded by a disk (Schreyer et al., 2002). It is of great interest because it is in a transition stage to a Herbig Be star. In contrast to IRAS 05281+3412 (catalog IRAS 03236+5836), the other IRAS source (03233+5833 (catalog IRAS 03233+5833)) is hardly studied.
IRAS 03595+5110 (catalog IRAS 03595+5110) (SMT 870m):
This region is known as the Hii region S 206 (NGC 1491, AFGL 5111). The “fluffy” structure of the millimeter continuum emission and the large extent in the FIR (listed in the IRAS small structure catalog) suggest that this is a developed region without ongoing star formation, especially without outflow activity (Mookerjea et al., 1999). But still there are two molecular cores with masses of almost each. One of them is associated with an MSX point source.
IRAS 04073+5102 (catalog IRAS 04073+5102) (SMT 870m) core #1, 2, 6, 7: pre-protocluster candidates:
The Hii region S 209 (AFGL 550) may be one of the most distant galactic Hii regions known. It is associated with IRAS 04073+5102 (catalog IRAS 04073+5102) and IRAS 04072+5100 (catalog IRAS 04072+5100). Brand & Blitz (1993) used IRAS 04073+5102 (catalog IRAS 04073+5102) to derive their velocity field of the outer galaxy. Therefore, we adopted their distance of 8.2 kpc, whereas Caplan et al. (2000) chose a distance of 9.8 kpc. In contrast to these far distances, Bica et al. (2003b) put the NIR cluster at a distance of 4.9 kpc.
The shallow millimeter continuum map shows a ring-like structure. A star cluster and some associated radio sources are not exactly in the center of this ring, but they possibly shaped the ring. Since the millimeter continuum emission coincides with a dark region in the faint optical emission nebula, the molecular cores are located in front of the Hii region. The most prominent core (#1) with is close to IRAS 04073+5102 (catalog IRAS 04073+5102) and an MSX source but clearly separated more than 10″, thus it is classified as a pre-protocluster candidate like three other cores in the ring (#2, #6, #7), which do not have any associations with sources at other wavelengths. The cores #3 and #4 have NIR (core #3 also MIR) detections which put them into stage 4 – young clusters. IRAS 04072+5100 (catalog IRAS 04072+5100) is close to cloud core #5 and associated with an MSX source and faint NIR emission – another young cluster.
IRAS 04269+3510 (catalog IRAS 04269+3510) (SMT 870m):
This IRAS source is a Herbig Be star also known as LkH 101. This B0 - 0.5 star has a massive disk (Tuthill et al., 2002). Barsony et al. (1991) identified a surrounding young star cluster (age yr) with more than 100 members including low-mass objects and brown dwarf candidates. The Herbig Be star illuminates the reflection nebula NGC 1579. The dark regions of this nebula match the two condensations seen in the millimeter continuum emission. The 10 cores have no counterparts at other wavelengths. Note that the distance to this object is uncertain. Stine & O’Neal (1998) and Tuthill et al. (2002) put the region at distances of 150 pc and 340 pc, respectively. We adopt the original distance of 800 pc determined by Herbig (1971), because Tuthill et al. (2002) cannot rule out neither the 150 pc nor the 800 pc.
IRAS 04324+5106 (catalog IRAS 04324+5106) (IRAM 1.27 mm):
This region is also known as AFGL 5124. The many strongly peaked patches around two major components of the millimeter continuum emission are scanning artifacts. However, the observing procedure (chopping while scanning) should preserve the fluxes and, thus, the detected halo around the two major components should be real although it is probably not that clumpy. The two major components are associated with NIR emission. Additionally, the massive core #1, classified as young cluster, has been detected by the MSX and NVSS surveys. The coordinates of the radio source F3R 4467 (Fürst et al., 1990) match the coordinates of core #2 also showing NIR emission. However, this is likely to be a strange coincidence since the resolution of the observations by Fürst et al. (1990) is too low to detect a different point source than the NVSS point source.
IRAS 04329+5047 (catalog IRAS 04329+5047) (SMT 870m):
AFGL 5125 or S 211 seems to be an older star-forming region than AFGL 5124 (above). It belongs to the same cloud complex, but looks much more evolved. A star cluster has appeared. In the shallow millimeter continuum emission map, we detected remnants of the parental molecular cloud on the outskirts of the cluster, though the remnants are still massive and may form massive stars. The northern edge is associated with IRAS 04329+5047 (catalog IRAS 04329+5047) from our sample, while the southern edge is associated with IRAS 04329+5045 (catalog IRAS 04329+5045). Core #1 is associated with an MSX source, therefore the massive cloud fragment is classified as evolved protoclusters.
IRAS 05100+3723 (catalog IRAS 05100+3723) (JCMT 850m):
This IRAS source is associated with LBN 784, also known as AFGL 5137 or S 228. The dust emission has a compact, almost circular shape but features two peaks. The IRAS source coincides with the southern peak (core #1a). Dense gas is detected, too (Table A Millimeter Continuum Survey for Massive Protoclusters in the Outer Galaxy). An NIR source along with a nebula (Carpenter et al., 1993) lead to the classification as a young cluster. The most prominent K-band object on the 2MASS image just the north-east of the IRAS PSC coordinates shows red NIR colors. It is quite deeply embedded in the cloud. The northern core shows no sign of ongoing star formation.
IRAS 05197+3355 (catalog IRAS 05197+3355) (SMT 870m):
An NIR cluster of reddened stars is associated with IRAS 05197+3355 (catalog IRAS 05197+3355). However, the area of the cloud core is free of NIR sources. Only the IRAS position is close to the peak. The MSX source is more than 10″ away. The core could host a protocluster. The envelope of the cloud core is relatively fragmented.
IRAS 05281+3412 (catalog IRAS 05281+3412) (JCMT 850m):
No millimeter continuum emission was detected towards this IRAS source. Thus, no map is shown in Figure 1. Other efforts to detect tracers of molecular gas failed as well (Table A Millimeter Continuum Survey for Massive Protoclusters in the Outer Galaxy). IRAS 05281+3412 (catalog IRAS 05281+3412) is associated with the open cluster NGC 1931. The molecular gas apparently was dispersed by the stellar cluster.
IRAS 05327-0457 (catalog IRAS 05327-0457) (IRAM 1.27 mm):
This region is in Orion about 30′ north of the Orion Nebula. The dust emission seems to trace the northern outskirts of the Orion A molecular cloud. Mookerjea et al. (2000) observed IRAS 05327-0457 (catalog IRAS 05327-0457) in the FIR. Their radiative transfer models predict a flux of about 10 Jy at 1 mm. However, they have no millimeter continuum data to constrain the dust emissivity, making their extrapolation difficult. We have not detected any dust emission from the IRAS source, neither do CO observations show the source. As in our measurements, the molecular cloud has a border at the IRAS position in the CO line maps by Chini et al. (1997). It is puzzling why the prominent FIR source reported by Mookerjea et al. (2000) has no millimeter continuum counterpart.
IRAS 05341-0530 (catalog IRAS 05341-0530) (SMT 870m):
This IRAS source is located on the eastern border of the Orion Nebula. A shallow observation of this area revealed no millimeter continuum detection. However, other tracers of dense molecular gas have been detected (Table A Millimeter Continuum Survey for Massive Protoclusters in the Outer Galaxy).
IRAS 05345+3157 (catalog IRAS 05345+3157) (JCMT 850m):
The IRAS source is associated with a star cluster and a nebulosity. However, the star cluster is not associated with any millimeter continuum emission. The cluster has apparently “burned” a hole into the molecular cloud leaving an arc of dust emission to the north and east. Two prominent condensations are detected in the arc 1′ north-east of the IRAS source which may be forming stars of intermediate mass. At least core #1 is associated with an MSX source. Interferometric HCO+ observations by Molinari et al. (2002) do not show these two prominent cores, but a clumpy cloud.
IRAS 05355+3039 (catalog IRAS 05355+3039) (JCMT 850m):
A small dust cloud is surrounding IRAS 05355+3039 (catalog IRAS 05355+3039). The IRAS source is associated with a nebulosity (actually about 7.5″ south). Ishii et al. (2002) find that NIR emission is not only scattered light, but also PAH emission. Additionally, there is an MSX source at the position of the nebulosity. Since the dust emission is surrounding the nebulosity, the embedded source probably cleared a cavity in its parental could. The part of the ellipse in the north-western corner of the map is the error ellipse of IRAS 05354+3041 (catalog IRAS 05354+3041).
IRAS 05375+3540 (catalog IRAS 05375+3540) (JCMT 850m):
This and the following IRAS source (05377+3548 (catalog IRAS 05377+3548)) are the FIR-brightest IRAS sources in the molecular cloud S 235. This molecular cloud was studied by Evans & Blair (1981) and Evans et al. (1981) in the NIR and MIR as well as with molecular line emission. They distinguish two velocity components of this cloud. The dust emission recorded in this map belongs to the km/s component.
IRAS 05375+3540 (catalog IRAS 05375+3540) is associated with the optical nebulosity S 235 A. The K-band image shows two bright objects in this nebulosity. An MSX source and a radio source are also located at the IRAS source position. Already Evans & Blair (1981) identified an infrared source there (EB IRS 3). However the peak of core #1a (230 M⊙) is about 20″ south of the the IRAS source. NIR sources at the core’s center lead to the classification as a young cluster. The core has two smaller extensions to the north and to the south. Another bright K-band source is 20″ south of the maximum of the dust emission. It is associated with S 235 B and the infrared source EB IRS 4. The massive cloud core hosts H2O masers as signs of deeply embedded on-going star formation, as also pointed out by Felli et al. (1997).
The map targeting IRAS 05375+3540 (catalog IRAS 05375+3540) encompasses the IRAS source 05375+3536 (catalog IRAS 05375+3536) which is close to S 235 C. A second, smaller condensation has been detected to the south slightly east of IRAS 05375+3536 (catalog IRAS 05375+3536).
IRAS 05377+3548 (catalog IRAS 05377+3548) (JCMT 850m):
The second velocity component of the molecular cloud S 235 is at km/s (see IRAS 05375+3540 (catalog IRAS 05375+3540)). It hosts the bright source IRAS 05377+3548 (catalog IRAS 05377+3548), but also IRAS 05374+3549 (catalog IRAS 05374+3549). The millimeter continuum emission from this cloud part is most intriguing. It features many separated prominent cores and various elongated structures. The western area is populated with NVSS radio sources. A large emission nebula can be found in the DSS in the same area. MSX sources with apparent counterparts are associated with three cores (#2a, #4 and #7), with the star BD+35 1201, an O9.5V star, and a red NIR object (MSX6C: G173.6098+02.8183). The cores 2a and 4 show K-band counterparts. These objects were also detected by Evans & Blair (1981) as EB IRS 1 and 2. The components 2b and 2c are elongated and pointing towards component 2a. We interpret these structures as pillars eroded by the radiation of the forming stars in core 2a. The cores 1 and 3 are similar in mass (50-60 M⊙) and shape to the cores 2a and 4. The lack of NIR and MIR emission suggests that these cores are younger and less evolved than the cores 2a and 4. They may be intermediate-mass pre-stellar cores. The two patches of dust emission to the east (components 7, 8, and 9) are approximately at the eastern edge of the molecular could mapped by Evans & Blair (1981). Core #9 is massive with MIR and NIR emission, thus classified as a young cluster.
IRAS 05480+2544 (catalog IRAS 05480+2544) and IRAS 05480+2545 (catalog IRAS 05480+2545) (IRAM 1.27 mm):
Our map covers two bright IRAS sources. IRAS 05480+2545 (catalog IRAS 05480+2545) is associated with millimeter continuum emission and an MSX source while this is not the case for the other IRAS source. At the north-eastern edge of the cloud core, where the MSX source is located, the 2MASS K-band image shows extended emission and several reddened sources. An explanation could be that embedded young stars (the MSX source) are emerging at this side of the cloud core. The IRAS source 05480+2544 is associated with the Hii region BFS 48 (Blitz et al., 1982).
IRAS 06006+3015 (catalog IRAS 06006+3015) (IRAM 1.27 mm):
This source is associated with AFGL 5176 in S 241. We detected a massive core with an envelope. The peak coincides with the IRAS position. Mueller et al. (2002) found a weak source in their 350 m continuum map. The mass derived from our data agrees with the mass obtained by Mueller et al. (2002). No MSX point sources or NVSS radio point sources are present at the dust core. However, there is a moderately bright and red NIR source at the IRAS position leading to a classification as a young cluster.
IRAS 06013+3030 (catalog IRAS 06013+3030) (SMT 870m):
A shallow observation of this area revealed no millimeter continuum detection. Other tracers of dense molecular gas have not been detected either (Table A Millimeter Continuum Survey for Massive Protoclusters in the Outer Galaxy). No molecular gas remained in the reflection nebula which is associated with this IRAS source. Only the recently reported star cluster remains as sign of past star formation activities (Bica et al., 2003b).
IRAS 06055+2039 (catalog IRAS 06055+2039) (IRAM 1.27 mm)(JCMT 850m):
IRAS 06055+2039 (catalog IRAS 06055+2039) is associated with S 252 A, which was described in detail by Kömpe et al. (1989). While Shepherd & Churchwell (1996) found that the main peak in 12CO is located slightly east of the IRAS source, the strongest CS(J=2-1) emission was reported north of IRAS 06055+2039 (catalog IRAS 06055+2039) by Carpenter et al. (1995b). Mueller et al. (2002) detected a 350 m source at the IRAS position.
There are two maps for IRAS 06055+2039 (catalog IRAS 06055+2039): one obtained at the JCMT at a wavelength of 850m (JCMT) and one obtained at the IRAM 30m telescope at 1300m (IRAM). In both maps there is a strong, nearly spherically shaped millimeter peak about east of the IRAS source. MSX point sources and a NVSS radio point source are associated with the IRAS source, but not with the millimeter continuum peak. In the 2MASS K-band image, an extended star cluster around the IRAS source can be seen. Dense gas and masers but no outflow were detected towards this source (Table A Millimeter Continuum Survey for Massive Protoclusters in the Outer Galaxy). It would be an excellent candidate for a massive pre-protocluster but it has “only” a mass of 97 (cf. § 1.3). At m, the source is slightly elongated, and in the direction of its elongation, one can find further small dust clumps. They may represent remnants of a fragmentation process.
IRAS 06056+2131 (catalog IRAS 06056+2131) (IRAM 1.27 mm)(JCMT 850m) and 06058+2138 (IRAM 1.27 mm)(JCMT 850m) core #1: pre-protocluster candidate:
This region, adjacent to the Hii region S 247, is intriguing not only because of its two bright IRAS sources, but even more because these IRAS sources are connected by a bridge of material seen at 850m (JCMT). Our maps obtained at the IRAM 30m telescope were not large (and sensitive) enough to detect this bridge. This bridge may be caused either by tidal forces between the two IRAS sources or may be a remnant of the fragmentation process. This filament is located close to the ionization front limiting the visible Hii region S 247 (Kömpe et al., 1989). (The NVSS sources are inside S 247.) Massive cloud cores reside at each endpoint of the bridge which are associated with the targeted IRAS sources.
After the multi-line study by Kömpe et al. (1989), Carpenter et al. (1995a, b) made a large-scale molecular line and NIR study of the Gemini OB association which includes these two IRAS sources. A detailed FIR study was conducted by Ghosh et al. (2000). All these investigations characterize this region as an active star-forming region. The detected millimeter continuum cores are associated with embedded NIR star clusters and MIR sources. However, core #1 of IRAS 06058+2138 (catalog IRAS 06058+2138) is separated by more than 10″ from MSX and notable NIR sources. Thus, this is a pre-protocluster candidate. The other cores are classified as young clusters. Masers are found in the region. Obviously the Hii region S 247 is more evolved than the cloud cores and may now compress the molecular cores to the east. Ghosh et al. (2000) suggests that IRAS 06058+2138 (catalog IRAS 06058+2138) is the youngest of the three bright IRAS sources 06056+2131, IRAS 06058+2138 (catalog IRAS 06058+2138), and IRAS 06061+2151 (catalog IRAS 06061+2151) (further up to the north-east, see next paragraph).
Cloud core #1 of IRAS 06058+2138 (catalog IRAS 06058+2138) is rather spherical. We derive a radial density profile for this core in Appendix A. The problems and limitations of such an analysis are discussed there, too.
IRAS 06061+2151 (catalog IRAS 06061+2151) (IRAM 1.27 mm):
This is the third bright IRAS source in the molecular cloud surrounding S 247. This source was also included in the above mentioned studies of the other two IRAS sources ( IRAS 06056+2131 (catalog IRAS 06056+2131), IRAS 06061+2151 (catalog IRAS 06058+2138)). Recently, Anandarao et al. (2004) have found H2 emission knots indicating a jet originating from the deeply embedded star cluster associated with IRAS 06061+2151 (catalog IRAS 06061+2151) ( 30 mag). Based on their NIR study of the cluster, they identified several Class I and II sources and a massive protostar. This protostar is close to the position of the MSX source. However, the peak of the millimeter continuum emission is 10″ west of the cluster and the MSX source. Thus, there might be a deeply embedded protostar of intermediate mass in the center of the cloud core.
IRAS 06063+2040 (catalog IRAS 06063+2040) (JCMT 850m):
This object is associated with AFGL 5183 and the ultra-compact Hii region S 252 C. IRAS 06063+2040 (catalog IRAS 06063+2040) is a part of the western molecular cloud fragment of S 252, though it is not in the dense ridge which delineates the visible Hii region on the western side (Felli et al., 1977).
We detect extended millimeter emission covering a rich NIR cluster. The emission has a cometary structure extending from a prominent core to the north towards the IRAS source. A bright NIR object and an NVSS source coincide exactly with the IRAS source. On the western slope close to the peak (7″), there are an MSX point source and 2MASS K-band sources. The rich near-infrared cluster has a gas reservoir to form more stars.
IRAS 06068+2030 (catalog IRAS 06068+2030) (JCMT 850m):
IRAS 06068+2030 (catalog IRAS 06068+2030) belongs to the eastern molecular cloud fragment of S252 and is associated with the compact Hii region S 252 E. The region was investigated by, e.g., Felli et al. (1977), Kömpe et al. (1989), and Carpenter et al. (1995a, b). A near-infrared cluster is also present at this position (Bica et al., 2003a).
The millimeter emission reveals the presence of two dust cores and an extended envelope. It surrounds an NIR cluster associated with IRAS 06068+2030 (catalog IRAS 06068+2030), an MIR, and radio source with an opening to the east. Core #1 is located south of the cluster, core #2 is located north-west of it. The envelope is extending from core #2 to the north-east showing a radio source and two MSX sources on the cluster’s side. The cluster may have shaped the opening in its parental cloud.
IRAS 06073+1249 (catalog IRAS 06073+1249) (SMT 870m) core #2: pre-protocluster candidate:
The Hii region S270 is associated with this IRAS source. Neither Carpenter et al. (1990) nor Fich (1993) found structures in the radio continuum emission. Carpenter et al. (1993) mapped the region in J, H, K and CS(). There is a star cluster in the NIR at the IRAS position. In CS, Carpenter et al. (1993) found two maxima, one at the IRAS position, but the stronger second peak is situated around 70 east of IRAS 06073+1249 (catalog IRAS 06073+1249). The millimeter continuum emission also has two peaks, however the stronger peak is coincident with the IRAS source, while the second weak millimeter peak lies around 50 east of IRAS 06073+1249 (catalog IRAS 06073+1249). The main millimeter continuum peak (core #1) is coincident with an MSX point source, an NVSS radio point source and a bright 2MASS K-band source – a young cluster. The core #2 is a massive pre-protocluster candidate, since it is not detected in any of these other surveys.
IRAS 06099+1800 (catalog IRAS 06099+1800) (SMT 870m):
IRAS 06099+1800 (catalog IRAS 06099+1800) is located between two large Hii regions S 255 and S 257, it is associated with the star cluster S 255-2. Mezger et al. (1988) observed the region at 350 m and 1300 m and identified three components, FIR1 - FIR3. The star cluster S 255-2 was investigated by Howard et al. (1997) and Itoh et al. (2001). Both concluded that S255-2 is a very young stellar cluster with massive stars in different evolutionary stages.
The millimeter continuum emission has the shape of a bar extending in north-south direction and separates the Hii regions (note the NVSS sources east and west). The bar breaks up in several individual cloud cores. Apart from the sources already found by Mezger et al. (1988) – FIR1 (core #1), FIR2 (core #2), and FIR3 (core #4a) – three more, weaker sub-sources are apparent. Where available in Mezger et al. (1988), the masses agree with the masses derived here. The dust cores are massive and very dense. The cloud core #2 is associated with the IRAS source and NIR sources, thus a young cluster. Crowther & Conti (2003) published the MSX map of the cluster. The northern cloud core (# 1) hosts an MSX source and an UCHii region which shows two peaks separated by (Kurtz et al., 1994). This UCHii region is also present as radio source in the NVSS catalog. While the star cluster that formed in the southern core already emerged from its parental cloud, the forming massive star(s) still have an UCHii region. However, the core gives already rise to an MSX detection leading to a classification as an evolved protocluster.
IRAS 06105+1756 (catalog IRAS 06105+1756) (SMT 870m) core #1a, 1b, 2, 3: pre-protocluster candidate:
This object is associated with S 258, and there are not many observations reported in the literature (Table A Millimeter Continuum Survey for Massive Protoclusters in the Outer Galaxy). The millimeter continuum map displays a cloud core with a fragmented envelope. The cloud core is located east of IRAS 06105+1756 (catalog IRAS 06105+1756), however, it is still within the error ellipse of the IRAS position. Since an NVSS radio point source and an MSX point source coincide much better with the IRAS source and a small cluster of NIR sources, we attribute the IRAS source rather to the cluster than to core #1a, which is then a pre-protocluster candidate. There is another millimeter continuum source about 4 east of IRAS 06105+1756 (catalog IRAS 06105+1756). We notice no sign of star formation associated with any of the cloud fragments. Since the fragments have enough mass to form massive stars, they are classifiead as pre-protocluster candidates, too.
IRAS 06114+1745 (catalog IRAS 06114+1745) (JCMT 850m):
There is not much known about the nature of IRAS 06114+1745 (catalog IRAS 06114+1745), associated with AFGL 5188. Carpenter et al. (1995b) found an emission maximum in CS () about 1 south of the IRAS source. This would correspond to the least massive (6) core #3. The IRAS source itself is located on the southern border of the most massive core #1a (17). Furthermore, it corresponds to an MSX point source, an NVSS radio point source and a bright object in the star cluster seen in 2MASS K-band emission. The 2MASS K-band also shows an agglomeration of sources around the southern core #3. It seems that star formation has lead to the disruption of the molecular cloud with some intermediate-mass cores still surviving.
IRAS 06117+1350 (catalog IRAS 06117+1350) (IRAM 1.27 mm):
This source, associated with AFGL 902, is located in the western part of the Hii region S 269. Using near-infrared observations, Eiroa et al. (1994) identified IRAS 06117+1350 (catalog IRAS 06117+1350) as a double source, IRS2e and IRS2w, separated by roughly 4. Jiang et al. (2003) studied the rich embedded cluster associated with S 269 in the near infrared. From line ratios, an H2 molecular jet, strong Br emission, and an IR excess they inferred that both IRS2e and IRS2w are massive young stellar objects in an evolutionary stage comparable to low-mass class I sources. We classify the massive core as a young cluster, because of the bright NIR source.
The millimeter continuum emission extends from its peak associated with the young stellar objects, IRS2e and IRS2w, to the south-west. The emission extends to the locations of the more deeply embedded objects (subregion 2 in Jiang et al. 2003). The millimeter peak is coincident with an MSX point source, too. A few NVSS radio sources can be found in the optical Hii region. This emission nebula is probably located in front of the molecular cloud. Otherwise one would expect dark areas in the optical nebula associated with the millimeter structure which is not the case.
IRAS 06155+2319 (catalog IRAS 06155+2319) (IRAM 1.27 mm):
IRAS 06155+2319 (catalog IRAS 06155+2319) is associated with the Hii region BFS 51. The embedded cluster around the IRAS source was investigated by Carpenter et al. (1990, 1993). The north-south-elongated millimeter continuum emission is located north-east of IRAS 06155+2319 (catalog IRAS 06155+2319), similar to the CS emission detected by Carpenter et al. (1993). Both the CS and the millimeter continuum emission morphology show a slightly steeper gradient to the east compared to the opposite side.
The millimeter continuum emission peak is associated with a deeply embedded NIR source. Other bright NIR sources are associated with the IRAS source and a NVSS radio source at the western side of the molecular cloud. Much fainter millimeter continuum emission is found close to IRAS 06156+2321 (catalog IRAS 06156+2321). The bright K-band object within the millimeter emission structure is highly reddened. It is not present in the 2MASS J-band image.
IRAS 06308+0402 (catalog IRAS 06308+0402) (JCMT 850m):
This IRAS source, located about 1∘ south of the Rosette Nebula, is embedded in very extended dust emission with many intermediate-mass dust cores. The most massive one (core #1a) has a mass of 12 M⊙. An NIR star cluster is embedded in this molecular cloud. While some of the stars in the apparent center of the cluster are not deeply embedded in the cloud, most of the NIR objects show high reddening. The IRAS source is located close to the cluster center.
A molecular outflow and H2O masers have been detected towards IRAS 06308+0402 (catalog IRAS 06308+0402) further indicating on-going star formation. This region and its molecular cloud Monoceros OB2 have been studied e.g. by Cox et al. (1990) and Phelps & Lada (1997), who both suggested sequential star formation triggered by the nearby stellar association NGC 2244.
IRAS 06319+0415 (catalog IRAS 06319+0415) (SMT 870m):
This source is also called AFGL 961 and it is a well studied object in the Rosette Nebula Giant Molecular Cloud. This pre-main sequence binary consists of early B-type stars, the western part powering an extended outflow while bow shocks indicate past outflow activity of both components (Aspin, 1998).
The strong millimeter peak has nearly spherical morphology and corresponds to the IRAS source, an MSX point source and a bright object in the 2MASS K-band emission within positional uncertainties. The high mass of 550 M⊙ and the relatively high number density at the peak position () mark IRAS 06308+0402 (catalog IRAS 06319+0415) as one of the most dense massive cores.
Phelps & Lada (1997) investigated the NIR sources around core #1. The masive core is classified as young cluster since the NIR sources are apparent in the 2MASS K-band image. One of the theories of Phelps & Lada (1997) for the region is sequential star formation, triggered by the nearby OB-association NGC 2244, but they also took spontaneous star formation into consideration. Recent X-ray observations with Chandra by Townsley et al. (2003) provide observational evidence for strong wind shocks in the Rosette Nebula. This could support the sequential star formation theory.
We note that a distance of 1.4 kpc has been adopted by Townsley et al. (2003) for NGC 2244 and the Rosette Nebula, while we use 1.6 kpc for the dust emission around IRAS 06319+0415 (catalog IRAS 06319+0415).
IRAS 06380+0949 (catalog IRAS 06380+0949) (SMT 870m):
A shallow observation of this part of NGC 2264 revealed no millimeter continuum detection.
IRAS 06384+0932 (catalog IRAS 06384+0932) (JCMT 850m):
IRAS 06384+0932 (catalog IRAS 06384+0932) is located on the southern edge of the NGC 2264 molecular cloud. It is associated with the prominent NIR source known as Allen’s source (Allen, 1972) or NGC 2264 IRS1. A multi-wavelength study by Schreyer et al. (2003) suggests that NGC 2264 IRS1 is a young B-type star with low-mass companions located in a low-density cavity surrounded by a clumpy, shell-like, and dense cloud remnant. Several outflow systems and their driving sources were identified using interferometer data. The associated core #1a is thus classified as a young cluster. The other massive core (#1b), also a young cluster, is associated with a very red NIR source, only detected by 2MASS in the K-band, also listed by Bica et al. (2003a).
The single-dish map of the millimeter continuum emission surrounding NGC 2264 IRS1 shows a multiply-peaked cloud. Ward-Thompson et al. (2000) have already observed this part of the NGC 2264 molecular cloud at 1300m , 800m, 450m and 300m and identified five sources: MMS1 to MMS5, also marked on our map. The two sources MMS5 and MMS4 cannot be resolved in our map (850m). Ward-Thompson et al. (2000) could separate these two sources only at shorter wavelengths. The masses we derived differ by a factor of 2 from their masses for MMS2 and MMS4 combined together with MMS5 and by a factor of 5 from the mean mass of MMS3. While also the column densities correspond roughly to each other, their volume densities are up to two orders of magnitudes larger because Ward-Thompson et al. (2000) averaged over a smaller source area (the source’s FWHM) and thus a smaller extension along the line of sight to convert the column density to a volume density.
North of IRAS 06384+0932 (catalog IRAS 06384+0932), we detected further patches of millimeter continuum emission closer to IRAS 06382+0939 (catalog IRAS 06382+0939)555This source almost passed our selection criteria: Jy.. A deeper map was obtained by Wolf-Chase et al. (2003), who investigated this cloud part at far-infrared, submillimeter and millimeter wavelengths. They also detected the cloud core #2, which is close to the origin of the massive molecular outflow NGC 2264 D (Margulis et al., 1988) and might harbor the driving source.
IRAS 06412-0105 (catalog IRAS 06412-0105) (JCMT 850m):
We detected a relatively low-mass dust core in this region. It is coincident with a bright object in the 2MASS K-band, an MSX point source and an NVSS radio point source. All these emissions line up very well, but are separated by 1 from the IRAS source in the west. To reconcile this discrepancy we inspected the IRAS ISSA images. These images show a source elongated in east-west direction with the IRAS PSC position (, ) located in the western part of the emission and not in the center. The cataloged position does not accurately describe the peak and center of the IR emission. We fitted Gaussians to the 4 IRAS maps and found as center coordinates (, ) without any trend with the wavelength. This position aligns much better with the NIR, MIR and millimeter continuum emission (the latter one being , ). We conclude that IRAS measurements, e.g. the luminosity of 2000 L⊙, can be attributed to the cloud core, however observations with better resolution pointing to the IRAS position might have missed the core and resulted in the non-detections as the observations listed in Table A Millimeter Continuum Survey for Massive Protoclusters in the Outer Galaxy. This example demonstrates very clearly that newer FIR data is needed.
IRAS 06567-0355 (catalog IRAS 06567-0355) (JCMT 850m):
This IRAS source is associated with the bipolar nebula NS 14 (Neckel & Staude, 1984), also known as Hii region BFS 57. Detailed observations of this cloud core, associated with an MSX and a NVSS source, were performed by Neckel et al. (1989) and Howard et al. (1998). Both conclude that a trapezium of stars (spectral types B0 to A5) power a small Hii region. The millimeter continuum map by Neckel et al. (1989) corresponds to our findings. The mass estimate for the cloud core #1, a young cluster, of 200 M⊙ matches with their estimate. They fitted the SED with three dust components and concluded a gas mass of 355 M⊙ for the coldest component (10 K).
We detected millimeter continuum emission from another IRAS source ( 06567-0350 (catalog IRAS 06567-0350)) 5′ to the north. A star cluster is embedded in this cloud fragment (Lada & Lada, 2003), also giving rise to MSX detections.
IRAS 06581-0846 (catalog IRAS 06581-0846) and IRAS 06581-0848 (catalog IRAS 06581-0848) (JCMT 850m):
No dust emission was detected from either IRAS source. Extended diffuse millimeter continuum emission can be found in the western neighborhood of the IRAS positions. The young star cluster in this region was reported by Ivanov et al. (2002) as a new discovery. This region is also known as the Hii region BSF 64. In the mapped region, the NVSS catalog lists two sources and so does the MSX catalog. The cloud remanent is still massive and for the NIR sources classified as young cluster.
IRAS 07029-1215 (catalog IRAS 07029-1215) (JCMT 850m):
This IRAS source is located within the Hii region S 297 and is also associated with the reflection nebula vdB 94 (van den Bergh, 1966). The Hii region is powered by the B1II/III star HD 53623 (Houk & Smith-Moore, 1988). West of the IRAS source, a dark cloud can be found. Little is known about IRAS 07029-1215 (catalog IRAS 07029-1215). The millimeter continuum maps show emission from three distinct filaments, the eastern one containing the IRAS source, many MSX and NVSS radio point sources. There is only weak dust emission at the IRAS position. The central filament contains the strongest emission peak (core #1a) and is known as UYSO 1 (Forbrich et al., 2004). UYSO 1 seems to be a very young intermediate-mass protostellar object with neither 2MASS K-band, MSX nor NVSS point source counterparts. The western filament contains a weak emission peak within the dark cloud. This source (core #3) also has no counterparts at the other wavelengths considered.
IRAS 07299-1651 (catalog IRAS 07299-1651) (IRAM 1.27 mm):
This region has designations as a reflection nebula (DG 121, Dorschner & Gürtler 1963) and as an H emission nebula (RCW 7, Rodgers et al. 1960). The IRAS source is coincident with a single millimeter continuum peak with a small, rugged envelope. The 28 M⊙ core has an NIR counterpart and an MSX detection. Walsh et al. (1999, 2001) study the ultra-compact Hii region and the methanol maser embedded in the detected cloud core. Despite a similar sensitivity of the IRAM and the JCMT maps of this source, we did not detect the cloud core in the latter.
4 DISCUSSION
4.1 Masses and Densities
Distances, dust temperatures and dust opacities are the main uncertainties for the mass estimates. Accurate distances are crucial since masses etc. depend quadratically on the distance, but the distances are difficult to obtain. Most distances are kinematic distances already compiled by Henning et al. (1992) and, if necessary, corrected using new molecular line data and the velocity field of the outer galaxy by Brand & Blitz (1993). Kinematic distances have fairly large uncertainties (up to 50%), especially in the distant outer galaxy where the rotation curve is uncertain. The mass estimate depends also on the assumed effective temperature, as mentioned in §3.1. And still the dust opacities are uncertain within a factor of 2.
Given these difficulties, a comparison of the mass estimates with Mueller et al. (2002) is in order for those source we have in common. Considering the combination of our larger number of cloud components, the masses agree within 40 % for IRAS 06006+3015, 20 % for IRAS 03236+5836 and IRAS 06055+2039, and 10 % for IRAS 05377+3548, which is reasonable. Mueller et al. (2002) also used the dust opacities by Ossenkopf & Henning (1994). The temperature and distances were adjusted for the comparison.
The total gas masses derived in the described way range from 1 to 5000 for all measured objects, including all the faint and small sources. Similar values are reported by Beuther et al. (2002), Hunter et al. (2000), and Faúndez et al. (2004) (, 260 , and 6 , respectively). Our total range extends to smaller values and does not reach these high masses, because we are interested in individual cores and break down the total masses into sub-sources for each peak.
Column densities estimated for the core centers are of the order of cm-2 to cm-2. These values are comparable to those of other surveys (e.g. Beuther et al. 2002). Faúndez et al. (2004) stated column densities considerably smaller than cm-2, but did not report individual values (average density , Garay 2005).
Number densities vary from to cm-3 for most sources. Only in the case of IRAS 06099+1800 (components #1 and #2) and IRAS 04269+3510 (both components) the number densities reach cm-3. For IRAS 06099+1800 an underestimation of the source size due to sub-source crowding is a likely explanation. IRAS 04269+3510 is located relatively nearby at a distance of 0.8 kpc. The source size equals nearly the beam size. Therefore, the deconvolved source size and subsequently the core density have high uncertainties.
4.2 MIR sources and massive molecular cloud cores
With the large maps (on average larger than ), we identified a large amount of cores and clumps with a variety of morphologies, rarely spherically shaped and often overlapping. Single sources were detected in only 23% of the 40 mapped regions, a percentage similar to the findings of Faúndez et al. (2004) (27%). We detected many cores not associated with IRAS sources. Only 50% of the bright IRAS sources are themselves associated with a millimeter continuum peak. Thus, data collected in previous studies only on the IRAS sources have only limited value for the interpretation of the early phases of star-forming cores. It seems to be useful to check for associations to other infrared catalogs. In the following, we analyze the association of our cloud components to the MSX point source catalog.
Mass vs Distance:
The mass distribution of the cloud components, we identified, is displayed in Figure 14 giving the source counts for logarithmic mass intervals. Each of the 128 cloud components is considered separately. We note that we take into account only the JCMT observations for IRAS 06055+2039 and only the IRAM observations for IRAS 06056+2131 and IRAS 06058+2138 to avoid double-counting. The turn-over occurs at masses of 100 . Figure 14 also includes the information at which distances the cores are found. It is conspicuous that the massive cores are predominantly found at large distances. This is a result of several selection effects. Massive cores are rare and, therefore, unlikely to be found close to the sun. On the other hand, the minimum detectable mass rises with the distance, which explains the lack of small masses at large distances. For example with the average sensitivity we reached, it is not possible to detect a 30 core more distant than 6 kpc. Furthermore, a cluster of small cores may not be resolved at large distances and thus looks like one massive core. The distances, especially in the outer Galaxy, have severe uncertainties which affect the masses and the mass distribution. However, an 50% error in the distance would lead to a mass wrong by a factor between 0.25 and 2.25. Concerning the mass bins (width 0.5 in ), this leads to a an uncertainty of only one bin. Because of these selection effects one would need to restrict distances to a small range effects in order to derive a realistic mass function of the detected cores. Then, however, the numbers get too low to establish significant statistical results.
Source associations:
We investigate the correlation of millimeter continuum peaks (cloud cores) and MSX PSC entries (§ 1.2). The regions of IRAS 04269+3510 () cannot be considered, because they were not observed by the MSX satellite The remaining 126 components (36 massive, i.e. , and 90 less massive cores) are broken down into three classes:
-
1.
The MSX point source lies within 10 of the millimeter continuum peak. In this case, both sources represent probably the same object as the positional error of MSX is about 4 to 6 () (Egan et al., 2003), similar to that of the millimeter observations.
-
2.
In the cases where the MSX point source is separated from the millimeter peak by 10 to 1, one can exclude that the MSX source represents the core center, it is a different nearby source.
-
3.
The last group includes those millimeter sources without any MSX point source in their vicinities up to 1.
We use angular distances and not linear distances because of the large distance range of our sources. A criterion using linear distances would be too coarse for nearby sources or beyond the resolution for distant sources.
The analysis shows that there are more MSX point sources in the vicinities of massive cloud cores than near less massive cores (Figures 15 and 16). Qualitatively, the black bars (cores with MSX sources within 10″) in the Figures 15 and 16 do not drop as fast as the total hight of the bars (total number of core per mass bin) after the turn over at . In numbers, we found that 44% of the massive cloud cores have an MSX source within 10″ (16 of 36), whereas less than 6% of them have no MSX source within 1′ (2 of 36). For the less massive cores, there are only 26% with a nearby MSX source (23 of 90) and even 23% of them have no MSX source within 1′ (21 of 90). This might be a projection effect since the high-mass cores are predominantly located at large distances (Figure 14) and a selection effect since only the brightest MIR sources are detected by MSX in these distances. However, analyzing only the 84 components closer than 2.5 kpc yields a similar result (Figure 16). In the “near” sample, 50% of the massive cores have close MSX sources (5 of 10) and all 10 cores have a MSX source within 1′, whereas only 26% of the other cores have a close MSX source and 26% have no MSX source within 1′. Of course we are dealing with low-number statistics here. There are only 10 massive cores closer than 2.5 kpc in our survey. One could assume that the high fraction of the massive cores with nearby MSX sources might be attributed solely to projection effects among the large number of the far massive cores. Can the high fraction of near massive cores with an nearby MSX source be explained just by coincidence? If we assume that the probability for an MSX source being nearby a molecular cloud core is about 26% independent of the core mass, then the probability to get five out of ten massive cores with nearby MSX source is only 7%. These 7% are an upper limit for the probability of a spurious result, but it only takes into account the sources closer than 2.5 kpc. It is difficult to draw quantitative conclusions from such low-number statistics, but qualitatively we can say that there is a higher fraction of MSX point source associations to massive millimeter peaks than to less massive ones. Thus, these associations apparently live longer to be present more frequently. Possibly massive cores can sustain star formation longer than low-mass cores despite the faster formation of massive stars.
4.3 Massive Pre-Protocluster Candidates and PPclCs
A very intriguing question concerns the initial conditions for massive star formation. PPclCs to study these conditions are rarely found. Unfortunately, PPclCs and protoclusters in an early stage cannot be told apart within the scope of this work. Both types of objects will appear as strong millimeter continuum emission peaks without any other association in the collected data. Whether a massive protostar is going to form or is already present in the center of a massive core can only be decided when sensitive FIR observations with a better spatial resolution become available.
As laid out in § 1.3, we call those cloud cores massive pre-protocluster candidates, which have no association at infrared and radio wavelengths (2MASS, MSX, NVSS) within 10″ of the peak and have a mass higher than 100 . An association to sources at MIR/NIR wavelengths hints to a later stage of massive star formation. We were able to identify twelve massive pre-protocluster candidates in our survey:
- IRAS 03064+5638 #1a
-
Quiescent part of a double-peaked cloud core.
- IRAS 03211+5446 #1
-
Another quiescent part of a double-peaked cloud core.
- IRAS 04073+5102 #1, #2, #6, #7
-
A ring of cloud cores around a star cluster. Triggered star formation may take place here.
- IRAS 06058+2138 #1
-
A single-peaked cloud core, but the MSX and IRAS sources are offset by 20″.
- IRAS 06073+1249 #2
-
A relatively small cloud core compared to the main component, but still massive.
- IRAS 06105+1756 #1a, #1b, #2, #3
-
The cloud core #1a has an IRAS and an MSX source on its flanks, but more than 10″ away. The other components show further fragmentation, but even the fragments are more massive than 100 .
These massive pre-protocluster candidates are presumably the earliest stages of massive star formation in our sample or even PPclCs, where initial conditions of massive star formation may be studied. Observations in the FIR with higher sensitivity and spatial resolution, e.g., by Spitzer, SOFIA, or Herschel are needed to characterize the spectral energy distribution of the core centers and to reveal possible deeply embedded sources. High-resolution interferometric observations (Plateau de Bure, ALMA) looking for outflows can help to confirm the evolutionary stage of the cores. Interferometric observations are also needed to check whether these cores are really single-peaked or whether they fragment and only form low-mass stars.
Some more cores should be mentioned as pre-protocluster candidates though they do not meet all of the above-mentioned criteria: The cloud core close to IRAS 06055+2039 is almost an massive pre-protocluster candidate. Our mass estimate just falls short of the somewhat arbitrary 100 limit. The mass estimated for IRAS 06055+2039 by Mueller et al. (2002) is above 100 . IRAS 02593+6061 #1 is clearly offset from the IRAS position and the MSX source is only on the slope of the core, slightly closer than 10″. The cloud cores #1 and #3 of IRAS 05377+3548 are rather early pre-protostar than pre-protocluster candidates with intermediate masses (57 and 59 respectively). A similar case is core #1a of IRAS 07029-1215 (UYSO 1), but Forbrich et al. (2004) detected an outflow confirming the presence of a very young protostar.
The mass range of the pre-protocluster candidates goes up to 2900 , but this source is located at a distance of 8.2 kpc and individual cloud cores almost certainly are not resolved. The next massive not so distant protocluster candidate is 03064+5638 #1a with 1400 at 4.1 kpc. The column densities are relatively high ( to ) compared to the other cloud cores. The core densities (mean density ) however, are rather moderate when compared to the other cores in this survey .
5 SUMMARY
We used the 47 of the FIR-brightest IRAS sources in the outer galaxy (which are in 44 fields) to search for early stages of star formation, ie. millimeter continuum emission from molecular cloud cores. We presented relatively large millimeter continuum maps of the 40 regions with detections. For these regions, we compiled NIR, MIR, radio, and molecular line data including information on outflow and maser activities in these regions in addition to the maps. This collection of data allows to characterize the regions and to estimate the evolutionary stages of the cloud cores. The IRAS sources themselves are not the youngest, most deeply embedded sources, but guided us to sites of on-going star formation. Caution has to be exercised with observational data from the literature obtained by observations pointed to IRAS sources alone. It may not be clear to which source the measured flux has to be attributed. Only 50% of the bright IRAS sources are themselves associated with a millimeter continuum peak. This study can provide a good starting point for subsequent detailed investigations of especially intriguing sources, e.g. the candidates for massive pre-protoclusters.
The masses and core densities have been estimated for all detected cloud components. They compare well to the findings of similar surveys, except that our mass range starts at lower masses. The reason is our attempt to separate the cloud components. A look at the high-mass cores and their associations with MIR sources shows that these associations are more frequent than for lower-mass cores. We suspect that massive cores can sustain star formation over a longer time despite the fast evolution of massive stars. When we focus on massive protocluster candidates, they only have moderate densities compared to the range of core densities estimated here.
The strategy of taking the FIR-brightest IRAS sources as lighthouses guiding us to young, massive star-forming regions, proved successful. We identified twelve massive pre-protocluster candidates.
Appendix A An exemplary Radial Density Profile from single dish observations
In this appendix, we present the radial intensity and the resulting radial density profile of the best-suited source of our survey. Pre-requisites as spherical symmetry of the cloud core envelope and the restriction to radii larger than the beamwidth show the limitation of the method if applied to single-dish data.
Density profiles of molecular cores are often used to discriminate between different models of molecular cloud collapse. In the case of clustered low-mass star formation it appears that cloud core envelopes resemble rather finite-sized Bonnor-Ebert spheres (Bonnor, 1956) than singular isothermal spheres used in the ’standard’ isolated star formation model by Shu et al. (1987) (e.g. Motte & André 2001; Bacmann et al. 2000; Henriksen et al. 1997; Bonnor 1956). Concerning massive-star formation, there is only a poor database of density distributions. Recent papers reported the following values for the exponent in the radial density profile : with exceptions showing (van der Tak et al., 2000), (Hatchell et al., 2000), (Mueller et al., 2002), and (for , Beuther et al. (2002)). We mention here that using their own method Beuther et al. (2002) found for the submillimeter maps of Hatchell et al. (2000). The difference to the original value derived by another method indicates the current difficulties in acquiring density profiles of cloud cores in massive-star-forming regions.
As the beam profile of the each observation is not sufficiently known for a proper deconvolution, we use the asymptotic expansion for an observed monochromatic luminosity by Adams (1991). A presumed radial power-law density profile can be derived by direct measurements of the radial beam-folded intensity profile for radii greater than one full beamwidth in the case of spherical symmetry. The exponents and are related by , where refers to the temperature profile exponent, . The temperature profile exponent lies between and (Chandler & Richer, 2000). We choose , following Beuther et al. (2002). The quantity is a correction factor depending only on frequency and temperature in the form of with (Adams, 1991). For comparison with Beuther et al. (2002) we choose K. The correction factors for the IRAM 1300 m and the JCMT 850 m maps are and respectively. The correction term is due to deprojection effects caused by the dual-beam mapping technique. In our case is below (Motte & André, 2001) and is only considered in the error estimate.
To derive a radial density profile using the asymptotic expansion by Adams (1991), an (almost) spherical symmetric cloud core is needed that is considerable larger than the beamwidth. The more distant the considered source is and the lower the linear resolution, the more unlikely it is that the interesting inner part of the molecular cloud core is covered, needed e.g. to identify a Bonnor-Ebert sphere when using this method.
As shown in Table 4, the beamwidths in our survey range from 14.1″ to 26″ in the worst case. Furthermore, we deal with large distances and many multiple sources. After checking for the largest and most ’spherical’ dust emission cores at moderate distances, we consider the one around IRAS 06058+2138 as the most suitable and useful source to get an exemplary density distribution. IRAS 06058+2138 also has the advantage of having maps at two wavelengths, an IRAM 1300 m map and a JCMT 850 m map. We provide the analysis of the intensity profile as a comparison to the values derived by the other surveys. However, one should keep in mind that only projection effects may render the cloud core spherical. A thorough discussion of the problems with 1D-fitting can be found in Steinacker et al. (2004).
A.1 Density Profile of Core IRAS 06058+2138 #1
To get the radial intensity profile, we average the two-dimensional intensity distribution in the map in circular annuli of 1.5″ around the peak position for . For the IRAM map, the values are plotted against the average radius of the corresponding ring in Figure 17. The data are fitted using the Levenberg-Marquardt method (Press et al., 1986) with one power law in the radial range from the beamwidth to 60″. The possibility of a better fit with two power laws was also investigated, using the same break value at 32″ as used by Beuther et al. (2002) for comparison.
The fitted curves are shown in Figure 17. The resulting values for and , as well as the mean results of the comparable surveys of Beuther et al. (2002) and Mueller et al. (2002) are summarized in Table 7. The error of is approximately 0.3, taking into account an error of for concerning ring widths and the peak position, an error of the temperature distribution of for and as the largest possible projection error (Beuther et al., 2002; Motte & André, 2001).
The radial density profiles of the IRAM and the JCMT map are comparable, but is about an order of magnitude better for the IRAM data. There is good agreement with the mean density profile exponent of Mueller et al. (2002) for the one power law case. Within the error bars there is also an agreement with the surveys of van der Tak et al. (2000) and Hatchell et al. (2000). In the case with two power laws the values agree very well with those of Beuther et al. (2002). A flatter inner part and a steeper outer part in the density profile is recognizable. A comparable behavior in the case of low-mass star formation is regarded as agreement with a theoretical description of the cloud core as a Bonnor-Ebert sphere (Motte & André, 2001; Bacmann et al., 2000; André et al., 1999).
Facilities: HHT (19-channel bolometer), IRAM:30m (MAMBO), JCMT (SCUBA)
References
- Adams (1991) Adams, F. C. 1991, ApJ, 382, 544
- Allen (1972) Allen, D. A. 1972, ApJ, 172, L55
- Anandarao et al. (2004) Anandarao, B. G., Chakraborty, A., Ojha, D. K., & Testi, L. 2004, A&A, 421, 1045
- André et al. (1999) André, P., Bacmann, A., Motte, F., & Ward-Thompson, D. 1999, in The Physics and Chemistry of the Interstellar Medium, Proceedings of the 3rd Cologne-Zermatt Symposium, held in Zermatt, September 22-25, 1998, Eds.: V. Ossenkopf, J. Stutzki, and G. Winnewisser, GCA-Verlag, Herdecke, p. 241
- André et al. (1993) André, P., Ward-Thompson, D., & Barsony, M. 1993, ApJ, 406, 122
- Aspin (1998) Aspin, C. 1998, A&A, 335, 1040
- Bacmann et al. (2000) Bacmann, A., André, P., Puget, J.-L., Abergel, A., Bontemps, S., & Ward-Thompson, D. 2000, A&A, 361, 555
- Barsony et al. (1991) Barsony, M., Schombert, J. M., & Kis-Halas, K. 1991, ApJ, 379, 221
- Baudry et al. (1997) Baudry, A., Desmurs, J. F., Wilson, T. L., & Cohen, R. J. 1997, A&A, 325, 255
- Beuther et al. (2002) Beuther, H., Schilke, P., Menten, K. M., Motte, F., Sridharan, T. K., & Wyrowski, F. 2002, ApJ, 566, 945
- Bica et al. (2003a) Bica, E., Dutra, C. M., & Barbuy, B. 2003a, A&A, 397, 177
- Bica et al. (2003b) Bica, E., Dutra, C. M., Soares, J., & Barbuy, B. 2003b, A&A, 404, 223
- Blitz et al. (1982) Blitz, L., Fich, M., & Stark, A. A. 1982, ApJS, 49, 183
- Bonnarel et al. (2000) Bonnarel, F., Fernique, P., Bienaymé, O., Egret, D., Genova, F., Louys, M., Ochsenbein, F., Wenger, M., & Bartlett, J. G. 2000, A&AS, 143, 33
- Bonnor (1956) Bonnor, W. B. 1956, MNRAS, 116, 351
- Brand & Blitz (1993) Brand, J. & Blitz, L. 1993, A&A, 275, 67
- Broguière et al. (1996) Broguière, D., Neri, R., & Sievers, A. 1996, NIC Bolometer Users Guide, IRAM
- Bronfman et al. (1996) Bronfman, L., Nyman, L.-A., & May, J. 1996, A&AS, 115, 81
- Caplan et al. (2000) Caplan, J., Deharveng, L., Peña, M., Costero, R., & Blondel, C. 2000, MNRAS, 311, 317
- Carpenter et al. (1990) Carpenter, J. M., Snell, R. L., & Schloerb, F. P. 1990, ApJ, 362, 147
- Carpenter et al. (1995a) —. 1995a, ApJ, 445, 246
- Carpenter et al. (1995b) —. 1995b, ApJ, 450, 201
- Carpenter et al. (1993) Carpenter, J. M., Snell, R. L., Schloerb, F. P., & Skrutskie, M. F. 1993, ApJ, 407, 657
- Chan et al. (1996) Chan, S. J., Henning, T., & Schreyer, K. 1996, A&AS, 115, 285
- Chandler & Richer (2000) Chandler, C. J. & Richer, J. S. 2000, ApJ, 530, 851
- Chini et al. (1997) Chini, R., Reipurth, B., Ward-Thompson, D., Bally, J., Nyman, L.-A., Sievers, A., & Billawala, Y. 1997, ApJ, 474, L135
- Condon et al. (1998) Condon, J. J., Cotton, W. D., Greisen, E. W., Yin, Q. F., Perley, R. A., Taylor, G. B., & Broderick, J. J. 1998, AJ, 115, 1693
- Cox et al. (1990) Cox, P., Deharveng, L., & Leene, A. 1990, A&A, 230, 181
- Crowther & Conti (2003) Crowther, P. A. & Conti, P. S. 2003, MNRAS, 343, 143
- Deharveng et al. (1997) Deharveng, L., Zavagno, A., Cruz-Gonzalez, I., Salas, L., Caplan, J., & Carrasco, L. 1997, A&A, 317, 459
- Diaz-Miller et al. (1998) Diaz-Miller, R. I., Franco, J., & Shore, S. N. 1998, ApJ, 501, 192
- Dorschner & Gürtler (1963) Dorschner, J. & Gürtler, J. 1963, Astronomische Nachrichten, 287, 257
- Egan et al. (2003) Egan, M. P., Price, S. D., Kraemer, K. E., Mizuno, D. R., Carey, S. J., Wright, C. O., Engelke, C. W., Cohen, M., & Gugliotti, M. G. 2003, Air Force Research Laboratory Technical Report, AFRL-VS-TR-2003-1589
- Eiroa et al. (1994) Eiroa, C., Casali, M. M., Miranda, L. F., & Ortiz, E. 1994, A&A, 290, 599
- Emerson (1995) Emerson, D. T. 1995, in ASP Conf. Ser. 75: Multi-Feed Systems for Radio Telescopes, p. 309
- Emerson et al. (1979) Emerson, D. T., Klein, U., & Haslam, C. G. T. 1979, A&A, 76, 92
- Evans et al. (1981) Evans, N. J., Beichman, C., Gatley, I., Harvey, P., Nadeau, D., & Sellgren, K. 1981, ApJ, 246, 409
- Evans & Blair (1981) Evans, N. J. & Blair, G. N. 1981, ApJ, 246, 394
- Evans et al. (2002) Evans, N. J., Shirley, Y. L., Mueller, K. E., & Knez, C. 2002, in ASP Conf. Ser. 267: Hot Star Workshop III: The Earliest Phases of Massive Star Birth, 17
- Faúndez et al. (2004) Faúndez, S., Bronfman, L., Garay, G., Chini, R., Nyman, L.-Å., & May, J. 2004, A&A, 426, 97
- Felli et al. (1977) Felli, M., Habing, H. J., & Israel, F. P. 1977, A&A, 59, 43
- Felli et al. (1997) Felli, M., Testi, L., Valdettaro, R., & Wang, J.-J. 1997, A&A, 320, 594
- Fich (1993) Fich, M. 1993, ApJS, 86, 475
- Forbrich et al. (2004) Forbrich, J., Schreyer, K., Posselt, B., Klein, R., & Henning, T. 2004, ApJ, 602, 843
- Franco et al. (1994) Franco, J., Shore, S. N., & Tenorio-Tagle, G. 1994, ApJ, 436, 795
- Fürst et al. (1990) Fürst, E., Reich, W., Reich, P., & Reif, K. 1990, A&AS, 85, 805
- Garay (2005) Garay, Guido. 2005, Massive and dense cores: the maternities of high mass stars, Talk at IAU Symposium 227, Acireale, Italy
- Ghosh et al. (2000) Ghosh, S. K., Iyengar, K. V. K., Karnik, A. D., Rengarajan, T. N., Tandon, S. N., & Verma, R. P. 2000, Bulletin of the Astronomical Society of India, 28, 515
- Hatchell et al. (2000) Hatchell, J., Fuller, G. A., Millar, T. J., Thompson, M. A., & Macdonald, G. H. 2000, A&A, 357, 637
- Henning (1990) Henning, Th. 1990, Fundamentals of Cosmic Physics, 14, 321
- Henning et al. (1992) Henning, Th., Cesaroni, R., Walmsley, M., & Pfau, W. 1992, A&AS, 93, 525
- Henning et al. (2000) Henning, Th., Klein, R., Launhardt, R., Schreyer, K., & Stecklum, B. 2000, in ISO Survey of a Dusty Universe, Proceedings of a Ringberg Workshop Held at Ringberg Castle, Tegernsee, Germany, 8-12 November 1999, Edited by D. Lemke, M. Stickel, and K. Wilke, Lecture Notes in Physics, vol. 548, p. 333
- Henriksen et al. (1997) Henriksen, R., André, P., & Bontemps, S. 1997, A&A, 323, 549
- Herbig (1971) Herbig, G. H. 1971, ApJ, 169, 537
- Hillenbrand & Hartmann (1998) Hillenbrand, L. A. & Hartmann, L. W. 1998, ApJ, 492, 540
- Holland et al. (1999) Holland, W. S., Robson, E. I., Gear, W. K., Cunningham, C. R., Lightfoot, J. F., Jenness, T., Ivison, R. J., Stevens, J. A., Ade, P. A. R., Griffin, M. J., Duncan, W. D., Murphy, J. A., & Naylor, D. A. 1999, MNRAS, 303, 659
- Houk & Smith-Moore (1988) Houk, N. & Smith-Moore, M. 1988, in Michigan Spectral Survey, Ann Arbor, Dept. of Astronomy, Univ. Michigan (Vol. 4) (1988), 0–+
- Howard et al. (1997) Howard, E. M., Pipher, J. L., & Forrest, W. J. 1997, ApJ, 481, 327
- Howard et al. (1998) —. 1998, ApJ, 509, 749
- Hunter et al. (2000) Hunter, T. R., Churchwell, E., Watson, C., Cox, P., Benford, D. J., & Roelfsema, P. R. 2000, AJ, 119, 2711
- Ishii et al. (2002) Ishii, M., Hirao, T., Nagashima, C., Nagata, T., Sato, S., & Yao, Y. 2002, AJ, 124, 430
- Itoh et al. (2001) Itoh, Y., Tamura, M., Suto, H., Hayashi, S. S., Murakawa, K., Oasa, Y., Nakajima, Y., Kaifu, N., Kosugi, G., Usuda, T., & Doi, Y. 2001, PASJ, 53, 495
- Ivanov et al. (2002) Ivanov, V. D., Borissova, J., Pessev, P., Ivanov, G. R., & Kurtev, R. 2002, A&A, 394, L1
- Jenness & Lightfoot (1998) Jenness, T. & Lightfoot, J. F. 1998, in ASP Conf. Ser. 145: Astronomical Data Analysis Software and Systems VII, Vol. 7, p. 216
- Jiang et al. (2003) Jiang, Z., Yao, Y., Yang, J., Baba, D., Kato, D., Kurita, M., Nagashima, C., Nagata, T., Nagayama, T., Nakajima, Y., Ishii, M., Tamura, M., & Sugitani, K. 2003, ApJ, 596, 1064
- Kömpe et al. (1989) Kömpe, C., Baudry, A., Joncas, G., & Wouterloot, J. G. A. 1989, A&A, 221, 295
- Kraemer et al. (2003) Kraemer, K. E., Shipman, R. F., Price, S. D., Mizuno, D. R., Kuchar, T., & Carey, S. J. 2003, AJ, 126, 1423
- Kreysa et al. (1998) Kreysa, E. et al. 1998, in Proc. SPIE, Vol. 3357, 319
- Kurtz et al. (1994) Kurtz, S., Churchwell, E., & Wood, D. O. S. 1994, ApJS, 91, 659
- Lada & Lada (2003) Lada, C. J. & Lada, E. A. 2003, ARA&A, 41, 57
- Mampaso et al. (1989) Mampaso, A., Vilches, J. M., Riera, A., Phillips, J. P., & Pismis, P. 1989, A&A, 220, 235
- Margulis et al. (1988) Margulis, M., Lada, C. J., & Snell, R. L. 1988, ApJ, 333, 316
- McCutcheon et al. (2000) McCutcheon, W. H., Sandell, G., Matthews, H. E., Kuiper, T. B. H., Sutton, E. C., Danchi, W. C., & Sato, T. 2000, MNRAS, 316, 152
- Mezger et al. (1988) Mezger, P. G., Chini, R., Kreysa, E., Wink, J. E., & Salter, C. J. 1988, A&A, 191, 44
- Miller & Scalo (1979) Miller, G. E. & Scalo, J. M. 1979, ApJS, 41, 513
- Minier et al. (2004) Minier, V., Burton, M., Purcell, C., Hill, T., Longmore, S., & Walsh, A. 2004, in The Dusty and Molecular Universe: A Prelude to Herschel and ALMA, meeting held in Paris, France, October 27-29, 2004, Eds.: A. Wilson. ESA Conf. Ser., 159
- Molinari et al. (2002) Molinari, S., Testi, L., Rodríguez, L. F., & Zhang, Q. 2002, ApJ, 570, 758
- Mookerjea et al. (1999) Mookerjea, B., Ghosh, S. K., Karnik, A. D., Rengarajan, T. N., Tandon, S. N., & Verma, R. P. 1999, ApJ, 522, 285
- Mookerjea et al. (2000) Mookerjea, B., Ghosh, S. K., Rengarajan, T. N., Tandon, S. N., & Verma, R. P. 2000, ApJ, 539, 775
- Motte & André (2001) Motte, F. & André, P. 2001, A&A, 365, 440
- Mueller et al. (2002) Mueller, K. E., Shirley, Y. L., Evans, N. J., & Jacobson, H. R. 2002, ApJS, 143, 469
- Neckel & Staude (1984) Neckel, T. & Staude, H. J. 1984, A&A, 131, 200
- Neckel et al. (1989) Neckel, T., Staude, H. J., Meisenheimer, K., Chini, R., & Guesten, R. 1989, A&A, 210, 378
- Ogura et al. (2002) Ogura, K., Sugitani, K., & Pickles, A. 2002, AJ, 123, 2597
- Ossenkopf & Henning (1994) Ossenkopf, V. & Henning, T. 1994, A&A, 291, 943
- Osterloh et al. (1997) Osterloh, M., Henning, T., & Launhardt, R. 1997, ApJS, 110, 71
- Palagi et al. (1993) Palagi, F., Cesaroni, R., Comoretto, G., Felli, M., & Natale, V. 1993, A&AS, 101, 153
- Phelps & Lada (1997) Phelps, R. L. & Lada, E. A. 1997, ApJ, 477, 176
- Pirogov (1999) Pirogov, L. 1999, A&A, 348, 600
- Posselt (2003) Posselt, B. 2003, Master’s thesis, Universitity of Jena
- Press et al. (1986) Press, W. H., Flannery, B. P., & Teukolsky, S. A. 1986, Numerical recipes. The art of scientific computing (Cambridge: University Press, 1986)
- Rodgers et al. (1960) Rodgers, A. W., Campbell, C. T., & Whiteoak, J. B. 1960, MNRAS, 121, 103
- Rodriguez-Gaspar et al. (1995) Rodriguez-Gaspar, J. A., Tenorio-Tagle, G., & Franco, J. 1995, ApJ, 451, 210
- Sandell (2000) Sandell, G. 2000, A&A, 358, 242
- Schreyer (1997) Schreyer, K. 1997, PhD thesis, University of Jena
- Schreyer et al. (1996) Schreyer, K., Henning, Th., Kömpe, C., & Harjunpaeae, P. 1996, A&A, 306, 267
- Schreyer et al. (2002) Schreyer, K., Henning, Th., van der Tak, F. F. S., Boonman, A. M. S., & van Dishoeck, E. F. 2002, A&A, 394, 561
- Schreyer et al. (2003) Schreyer, K., Stecklum, B., Linz, H., & Henning, Th. 2003, ApJ, 599, 335
- Sharpless (1959) Sharpless, S. 1959, ApJS, 4, 257
- Shepherd & Churchwell (1996) Shepherd, D. S. & Churchwell, E. 1996, ApJ, 472, 225
- Shu et al. (1987) Shu, F. H., Adams, F. C., & Lizano, S. 1987, Ann. Rev. Astron. Astrophys., 26, 23
- Snell et al. (1990) Snell, R. L., Dickman, R. L., & Huang, Y.-L. 1990, ApJ, 352, 139
- Snell et al. (1988) Snell, R. L., Huang, Y.-L., Dickman, R. L., & Claussen, M. J. 1988, ApJ, 325, 853
- Sridharan et al. (2002) Sridharan, T. K., Beuther, H., Schilke, P., Menten, K. M., & Wyrowski, F. 2002, ApJ, 566, 931
- Steinacker et al. (2004) Steinacker, J., Lang, B., Burkert, A., Bacmann, A., & Henning, T. 2004, ApJ, 615, L157
- Stine & O’Neal (1998) Stine, P. C. & O’Neal, D. 1998, AJ, 116, 890
- Szymczak et al. (2000) Szymczak, M., Hrynek, G., & Kus, A. J. 2000, A&AS, 143, 269
- Townsley et al. (2003) Townsley, L. K., Feigelson, E. D., Montmerle, T., Broos, P. S., Chu, Y., & Garmire, G. P. 2003, ApJ, 593, 874
- Tuthill et al. (2002) Tuthill, P. G., Monnier, J. D., Danchi, W. C., Hale, D. D. S., & Townes, C. H. 2002, ApJ, 577, 826
- Valdettaro et al. (2001) Valdettaro, R., Palla, F., Brand, J., Cesaroni, R., Comoretto, G., Di Franco, S., Felli, M., Natale, E., Palagi, F., Panella, D., & Tofani, G. 2001, A&A, 368, 845
- van den Bergh (1966) van den Bergh, S. 1966, AJ, 71, 990
- van der Tak et al. (2000) van der Tak, F. F. S., van Dishoeck, E. F., Evans, N. J., & Blake, G. A. 2000, ApJ, 537, 283
- Walsh et al. (2001) Walsh, A. J., Bertoldi, F., Burton, M. G., & Nikola, T. 2001, MNRAS, 326, 36
- Walsh et al. (1999) Walsh, A. J., Burton, M. G., Hyland, A. R., & Robinson, G. 1999, MNRAS, 309, 905
- Ward-Thompson et al. (1994) Ward-Thompson, D., Scott, P. F., Hills, R. E., & Andre, P. 1994, MNRAS, 268, 276
- Ward-Thompson et al. (2000) Ward-Thompson, D., Zylka, R., Mezger, P. G., & Sievers, A. W. 2000, A&A, 355, 1122
- Wolf-Chase et al. (2003) Wolf-Chase, G., Moriarty-Schieven, G., Fich, M., & Barsony, M. 2003, MNRAS, 344, 809
- Wouterloot et al. (1993) Wouterloot, J. G. A., Brand, J., & Fiegle, K. 1993, A&AS, 98, 589
- Wu et al. (1996a) Wu, Y., Huang, M., & He, J. 1996a, A&AS, 115, 283
- Wu et al. (1996b) —. 1996b, VizieR Online Data Catalog, 411, 50283
- Yun et al. (1999) Yun, J., Moreira, M. C., Afonso, J., & Clemens, D. P. 1999, AJ, 118, 990
- Zapata et al. (2001) Zapata, L. A., Rodríguez, L. F., & Kurtz, S. E. 2001, Revista Mexicana de Astronomia y Astrofisica, 37, 83
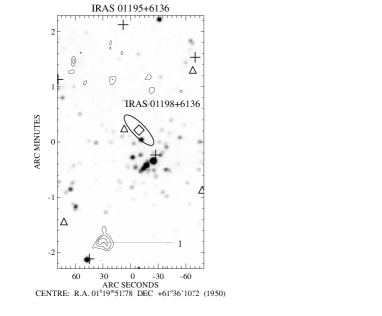
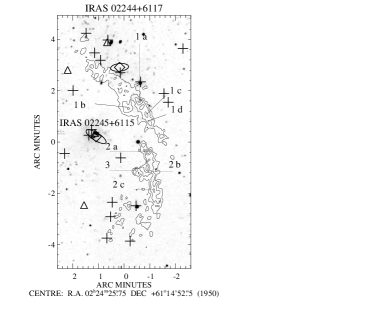
contours: (3, ) contours: (3, )
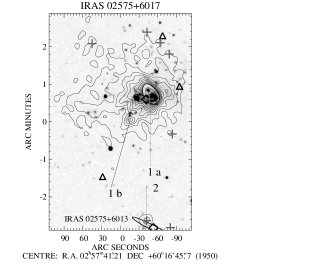
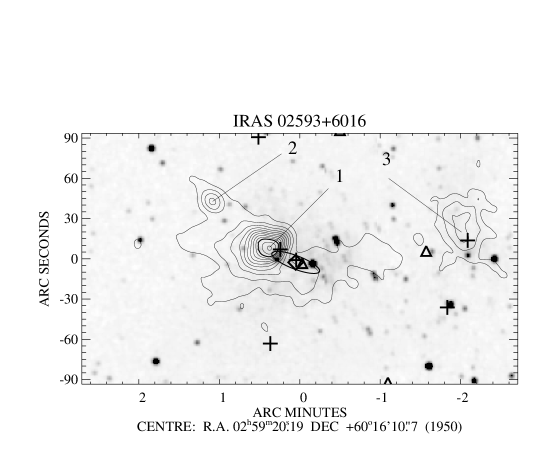
contours: (3, , , )
contours: (3, , , )
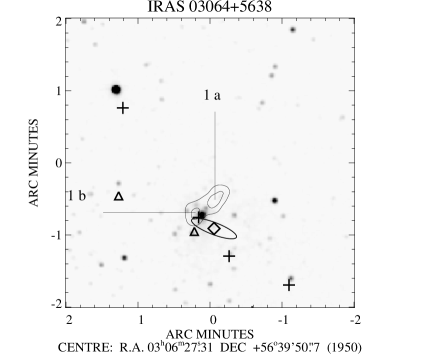
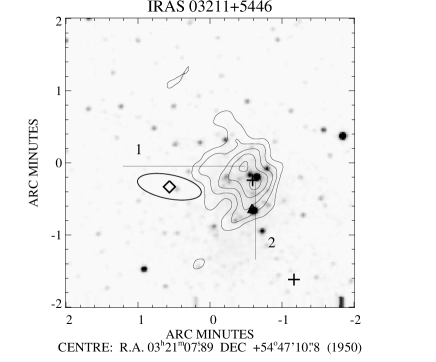
contours: (3, 4) contours: (3, )
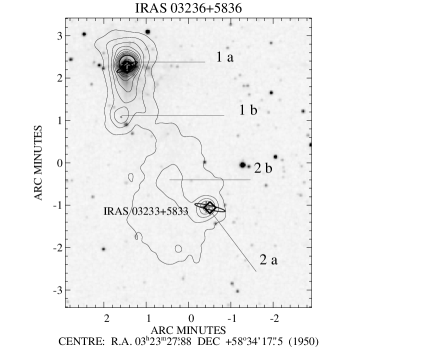
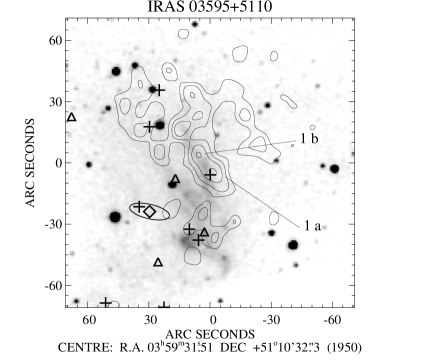
contours: (3, , , )
contours: (3, )
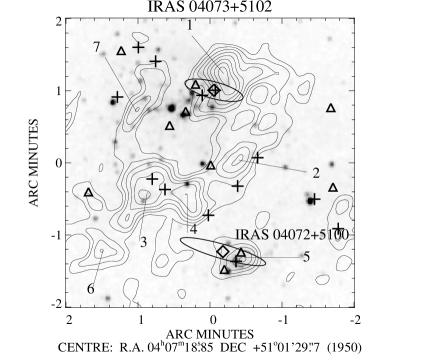
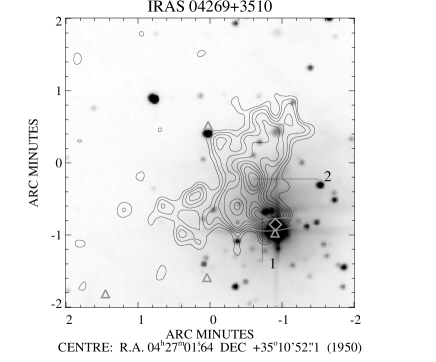
contours: (3, ) contours: (3, )
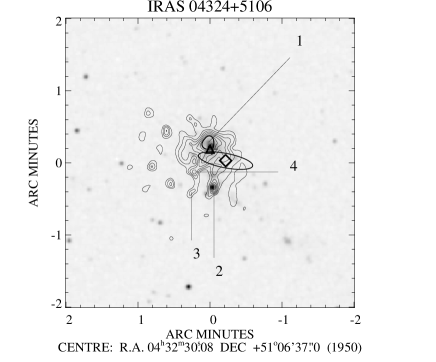
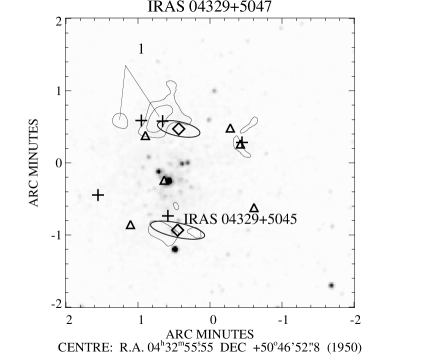
contours: (3, , , ) contours: (3, 4)
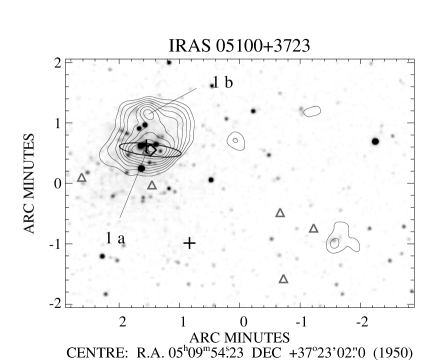
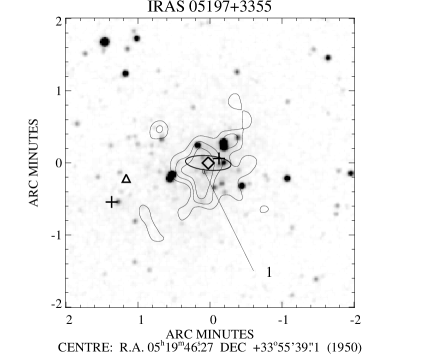
contours: (3, ) contours: (3, )
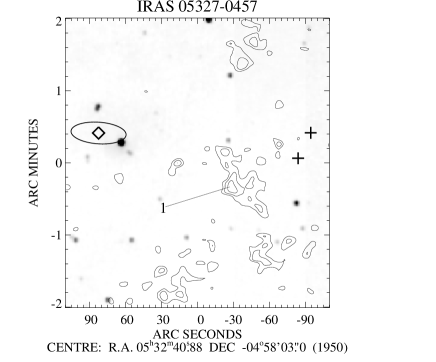
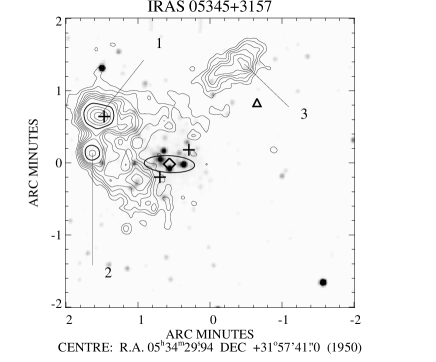
contours: (3, )
contours: (3, , , )
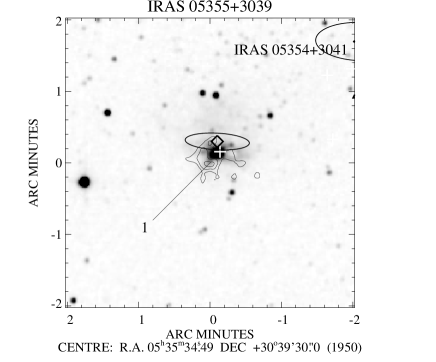
contours: (3, )
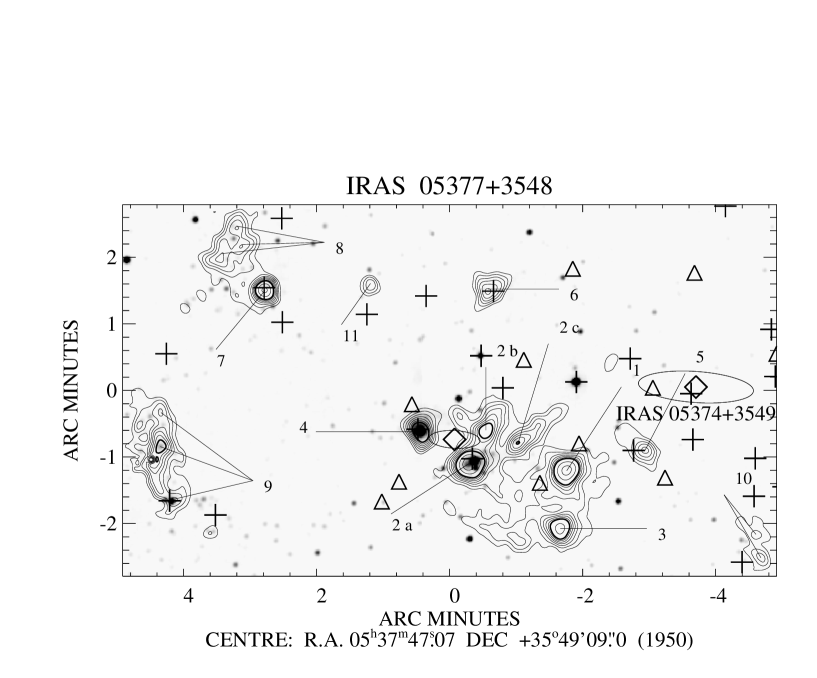
contours: (3, , , )
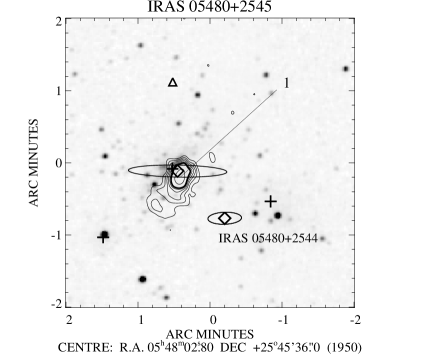
contours: (3, , , )
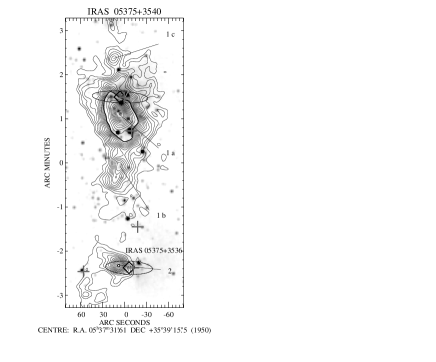
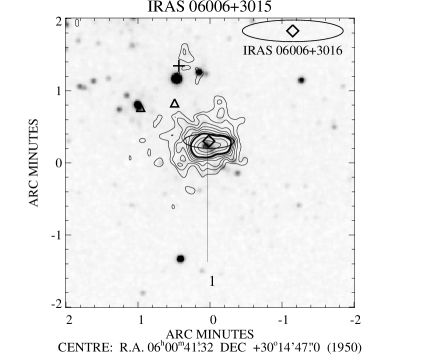
contours: (3, , , )
contours: (3, , , )
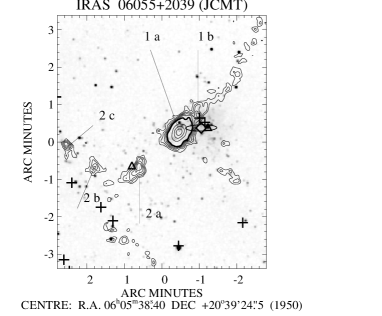
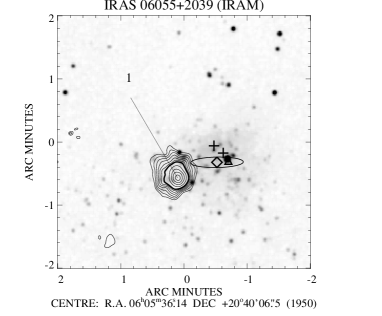
contours: (3, , , )
contours: (3, , , )
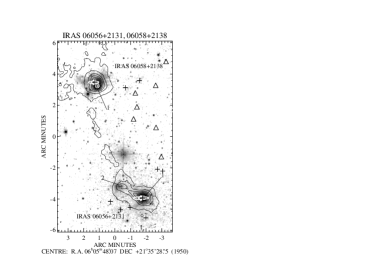
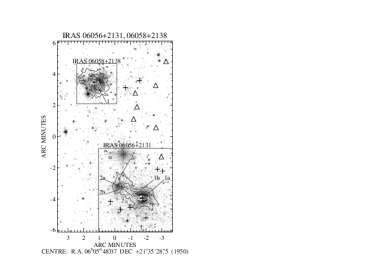
Combined JCMT maps
respective to the IRAS 06056+2131 map
contours: (3, , , )
The boxes give the extent of the IRAM maps.
contours for IRAS 06056+2131:
(3, , , )
contours for IRAS 06058+2138:
(3, , , )
with respective ’s.
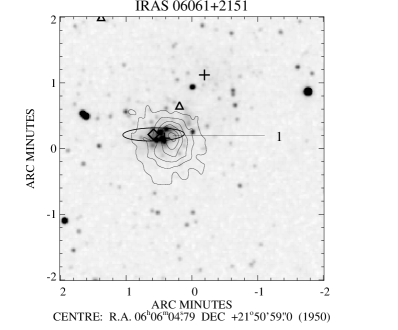
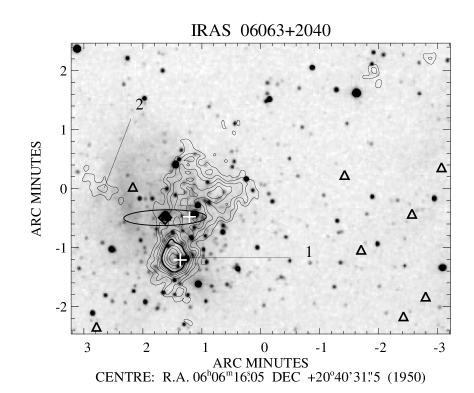
contours: (3, ) contours: (3, , , )
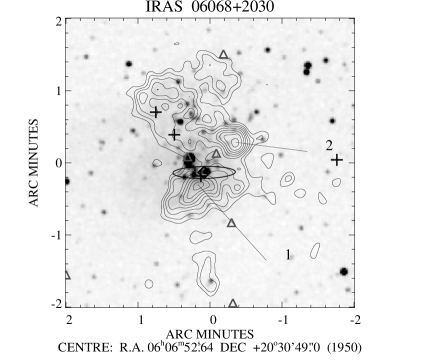
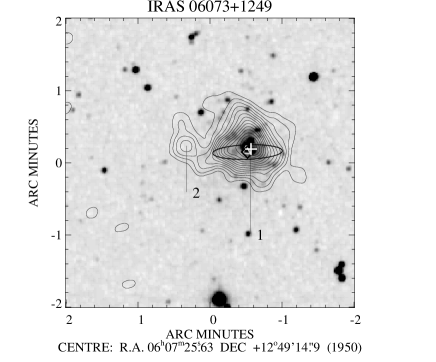
contours: (3, ) contours: (3, )
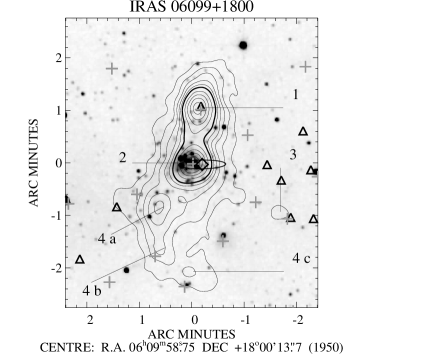
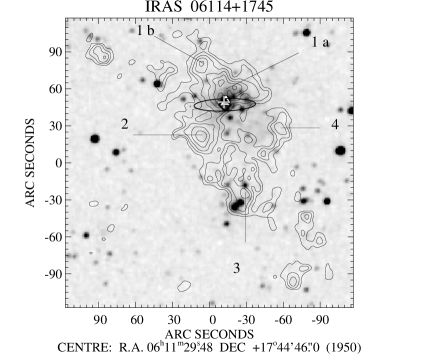
contours: (3, , , )
contours: (3, )
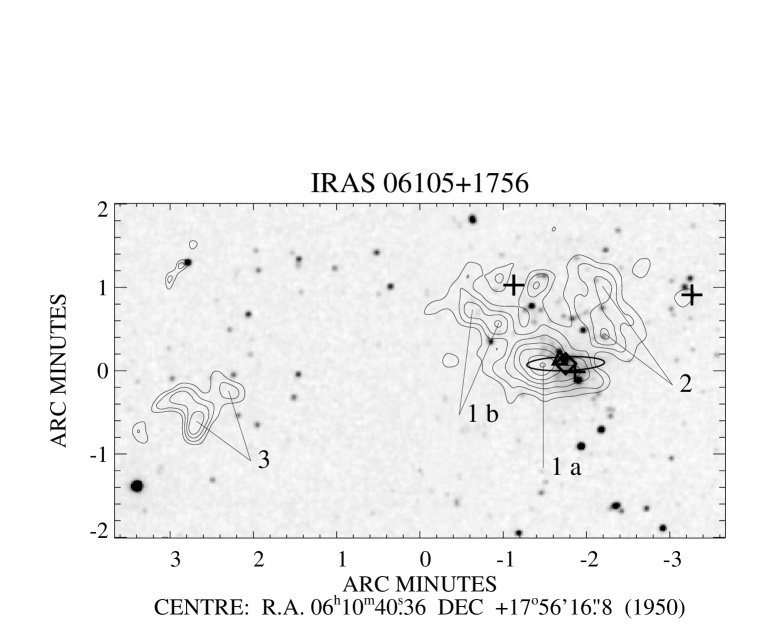
contours: (3, )
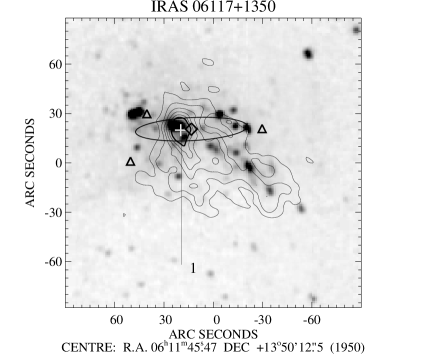
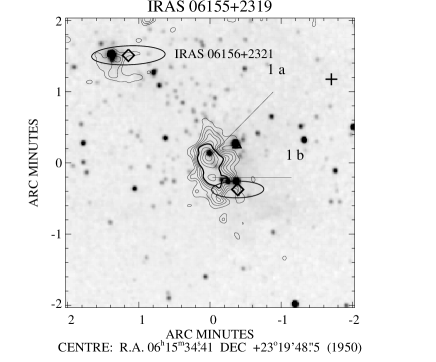
contours: (3, , , )
contours: (3, , , )
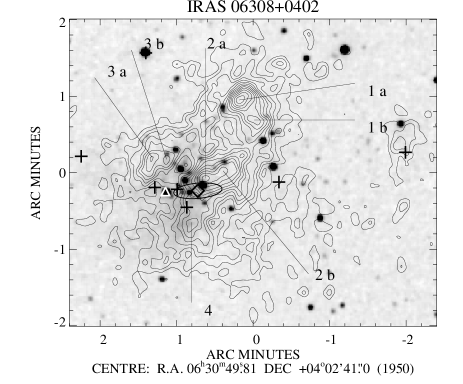
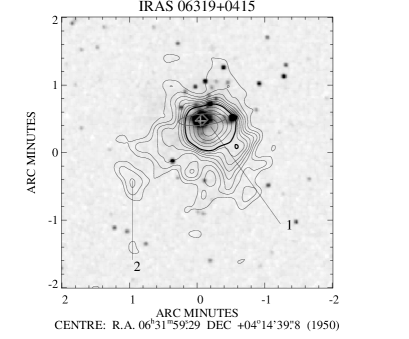
contours: (3, )
contours: (3, , , )
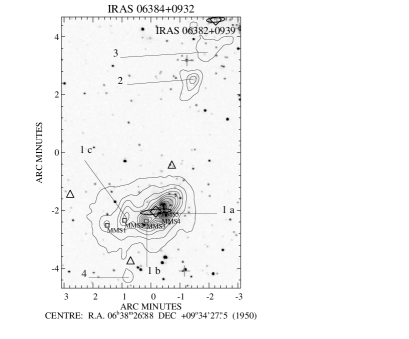
contours: (3, )
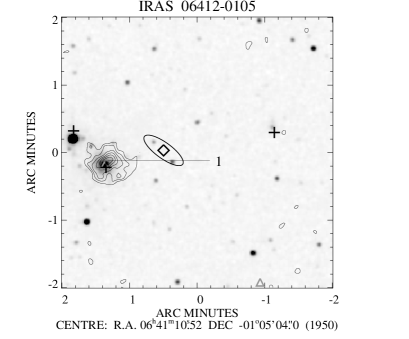
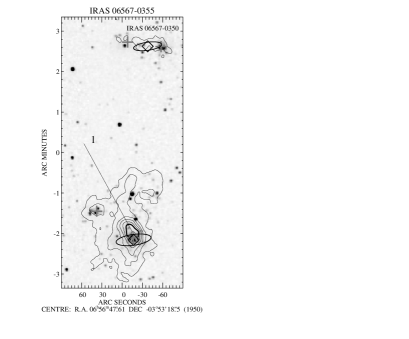
contours: (3, )
contours: (3, , , )
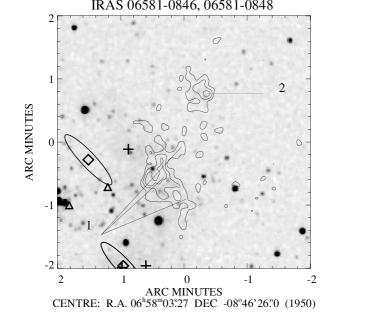
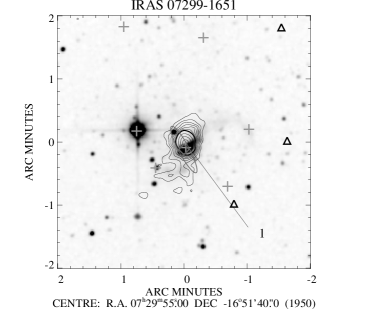
contours: (3, )
contours: (3, , , )
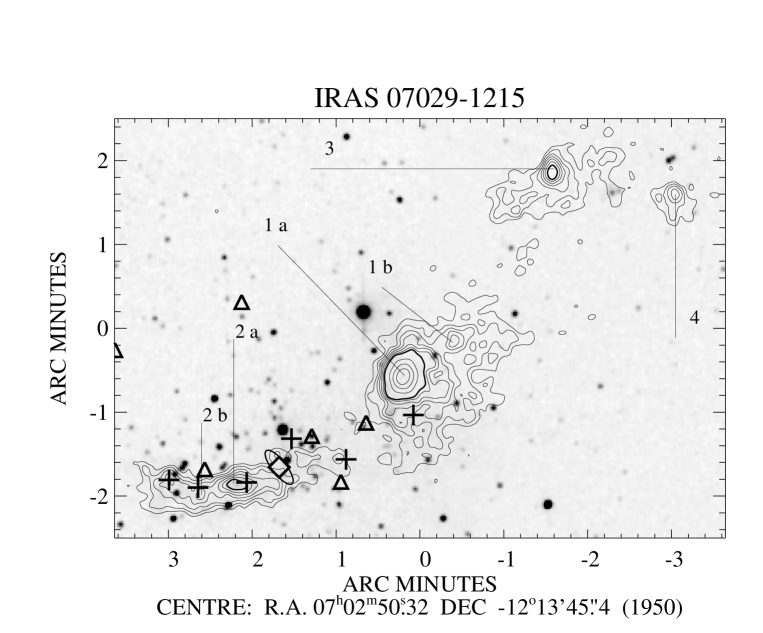
contours: (3, , , )
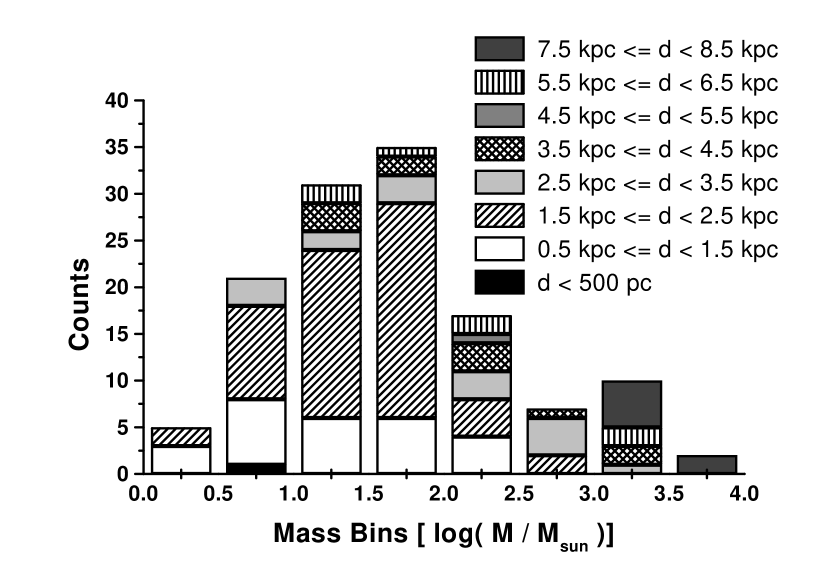
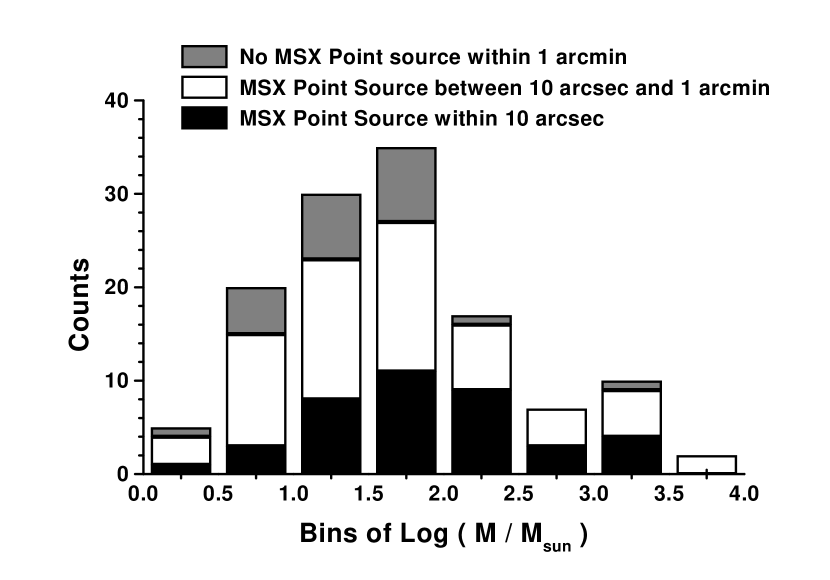
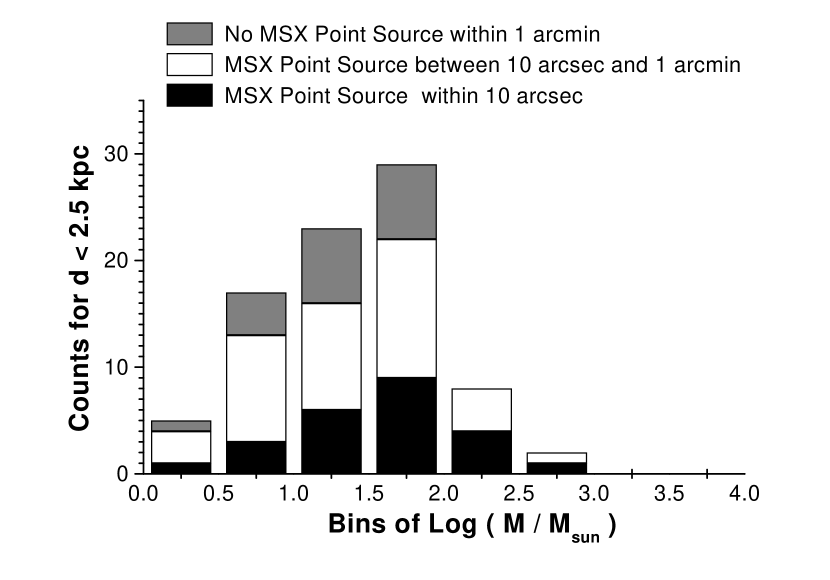
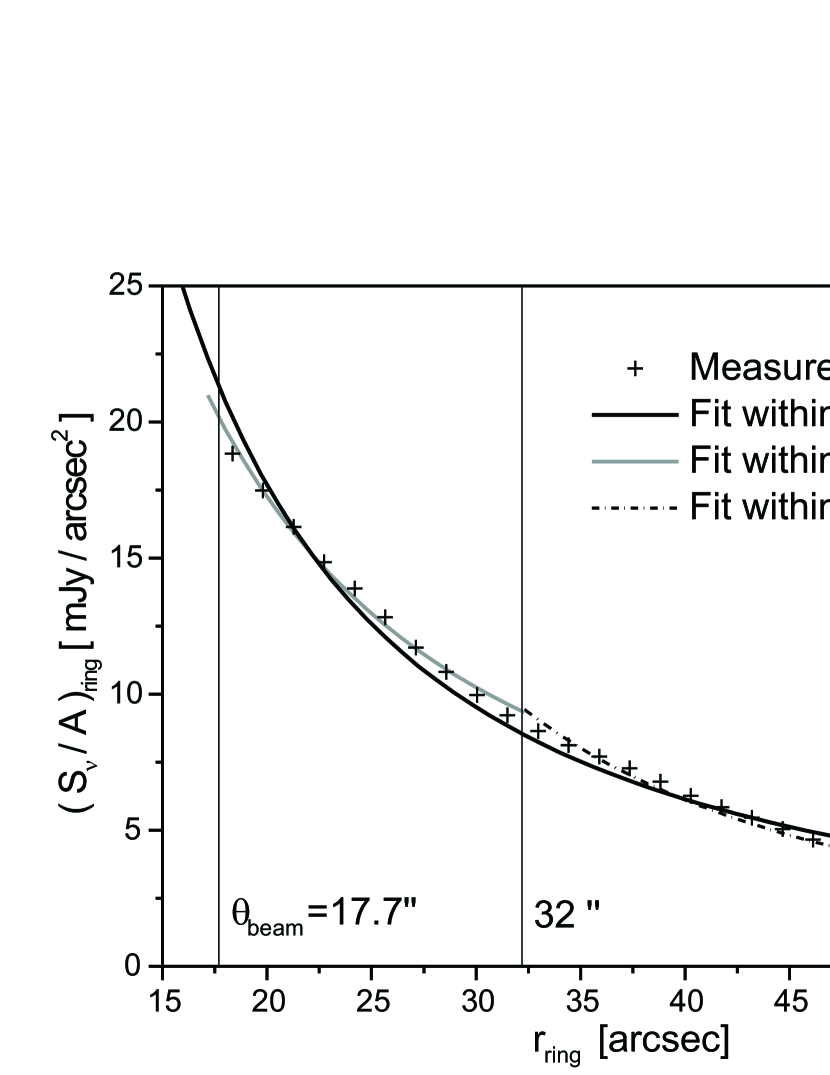
The shown intensity distribution corresponds to the IRAM map of IRAS 06058+2131 #1 (Figure 1). While the thick line represents the one power-law fit within the whole interval, the grey and dotted line correspond to the two power-law fit with a break at . For the used method to get the radial density distribution see § A, the derived exponents of the fits can be found in Table 7.
| Stage | Morphology | Detectable at | Example |
|---|---|---|---|
| 0: PPclCs | massive cloud core without collapse | mm | IRAS 06073+1249 #2 |
| 1: early protocluster | massive stars have begun to form deeply embedded in the cluster | mm | IRAS 03211+5446 #1 |
| 2: protocluster | the forming massive stars begin to clear a cavity, an Hii region begins to evolve | mm, FIR, radio | IRAS 05197+3355 #1 |
| 3: evolved protocluster | the cluster starts to emerge, but is still embedded | mm, FIR, MIR, radio | IRAS 04329+5047 #1 |
| 4: young cluster | the cluster has emerged from its parental cloud | mm, FIR, MIR, NIR | IRAS 03211+5446 #2 |
| 5: cluster | the cluster has dispersed its parental cloud | MIR, NIR | IRAS 05345+3157 IRAS 05281+3412 |
Note. — The examples for stage 0 and stage 1 are of course pre-protocluster candidates, but the assignment to stage 0 and stage 1 is arbitrary.
| IRAS name | D | ref. | LIRAS | other designations | |
|---|---|---|---|---|---|
| [kpc] | [L⊙] | [K] | |||
| 01195+6136 (catalog IRAS 01195+6136) | 2.0 | (1) | 26.7 | S187 | |
| 02244+6117 (catalog IRAS 02244+6117) | 2.2 | (1) | 29.5 | AFGL 333, W 4 | |
| 02575+6017 (catalog IRAS 02575+6017) | 3.9 | (2) | 33.0 | AFGL 4029 | |
| 02593+6016 (catalog IRAS 02593+6016) | 4.0 | (2) | 29.7 | AFGL 416, S201, G138.5+1.6 | |
| 03064+5638 (catalog IRAS 03064+5638) | 4.1 | (1) | 28.2 | AFGL 5090 | |
| 03211+5446 (catalog IRAS 03211+5446) | 3.1 | (1) | 30.8 | AFGL 5094 | |
| 03236+5836 (catalog IRAS 03236+5836) | 1.0 | (3) | 36.1 | AFGL 490 | |
| 03595+5110 (catalog IRAS 03595+5110) | 3.3 | (1) | 30.8 | AFGL 5111, NGC 1491, S206 | |
| 04073+5102 (catalog IRAS 04073+5102) | 8.2 | (4) | 8.4 | AFGL 550, S209 | |
| 04269+3510 (catalog IRAS 04269+3510) | 0.8 | (1) | 31.5 | AFGL 585, G164.4-9.0, LkH 101 | |
| 04324+5106 (catalog IRAS 04324+5106) | 6.0 | (1) | 37.5 | AFGL 5124 | |
| 04329+5047 (catalog IRAS 04329+5047) | 6.0 | (1) | 29.0 | AFGL 5125, S211 | |
| 05100+3723 (catalog IRAS 05100+3723) | 2.6 | (1) | 32.3 | LBN 784, AFGL 5137, S228 | |
| 05197+3355 (catalog IRAS 05197+3355) | 1.8 | (2) | 28.8 | S230 | |
| 05281+3412 (catalog IRAS 05281+3412) | 1.8 | (1) | 34.9 | AFGL 5144, G173.9+0.3, NGC 1931, S237 | |
| 053270457 (catalog IRAS 05327-0457) | 0.45 | (5) | 28.7 | S279 | |
| 053410530 (catalog IRAS 05341-0530) | 1.8 | (1) | 22.6 | ||
| 05345+3157 (catalog IRAS 05345+3157) | 1.8 | (1) | 31.2 | AFGL 5157, NGC 1985 | |
| 05355+3039 (catalog IRAS 05355+3039) | 1.8 | (1) | 29.2 | AFGL 5158 | |
| 05375+3540 (catalog IRAS 05375+3540) | 1.8 | (1) | 38.0 | S235B | |
| 05377+3548 (catalog IRAS 05377+3548) | 1.8 | (1) | 27.7 | S235, G173.71+2.70 | |
| 05480+2544 (catalog IRAS 05480+2544) | 2.1 | (1) | 27.4 | BFS 48 | |
| 05480+2545 (catalog IRAS 05480+2545) | 2.1 | (1) | 31.0 | BFS 48 | |
| 06006+3015 (catalog IRAS 06006+3015) | 4.7 | (1) | 26.4 | AFGL 5176, S241 | |
| 06013+3030 (catalog IRAS 06013+3030) | 4.7 | (1) | 30.0 | CED 061 | |
| 06055+2039 (catalog IRAS 06055+2039) | 2.0 | (6) | 31.2 | S252A | |
| 06056+2131 (catalog IRAS 06056+2131) | 2.0 | (6) | 32.3 | AFGL 6366S | |
| 06058+2138 (catalog IRAS 06058+2138) | 2.0 | (6) | 30.7 | AFGL 5180, S247 | |
| 06061+2151 (catalog IRAS 06061+2151) | 2.0 | (6) | 34.3 | AFGL 5182, S247 | |
| 06063+2040 (catalog IRAS 06063+2040) | 2.0 | (6) | 30.6 | AFGL 5183, S252 C | |
| 06068+2030 (catalog IRAS 06068+2030) | 2.0 | (6) | 32.0 | AFGL 5184, NGC 2175, S252 E | |
| 06073+1249 (catalog IRAS 06073+1249) | 6.0 | (2) | 38.3 | AFGL 5185, S270 | |
| 06099+1800 (catalog IRAS 06099+1800) | 0.8 | (1) | 31.1 | AFGL 896, S255 | |
| 06105+1756 (catalog IRAS 06105+1756) | 2.5 | (1) | 32.1 | S258 | |
| 06114+1745 (catalog IRAS 06114+1745) | 2.5 | (1) | 34.0 | AFGL 5188 | |
| 06117+1350 (catalog IRAS 06117+1350) | 3.8 | (1) | 33.5 | AFGL 902, S269 | |
| 06155+2319 (catalog IRAS 06155+2319) | 1.6 | (1) | 29.5 | BFS 51 | |
| 06308+0402 (catalog IRAS 06308+0402) | 1.6 | (1) | 31.8 | RNO 73 | |
| 06319+0415 (catalog IRAS 06319+0415) | 1.6 | (1) | 36.9 | AFGL 961 | |
| 06380+0949 (catalog IRAS 06380+0949) | 0.8 | (1) | 25.4 | AFGL 4519S | |
| 06384+0932 (catalog IRAS 06384+0932) | 0.76 ppphotometric distance | (1) | 30.9 | AFGL 989, NGC 2264–1, W 217 | |
| 06412-0105 (catalog IRAS 06412-0105) | 1.1 | (1) | 39.6 | ||
| 06567-0355 (catalog IRAS 06567-0355) | 2.6 | (1) | 38.9 | NS 14, BFS 57 | |
| 06581-0846 (catalog IRAS 06581-0846) | 4.0 | (1) | 18.1 | BFS 64 | |
| 06581-0848 (catalog IRAS 06581-0848) | 4.0 | (1) | 23.4 | BFS 64 | |
| 07029-1215 (catalog IRAS 07029-1215) | 1.0 | (1) | 29.1 | AFGL 5222, S297, vdB 94 | |
| 07299-1651 (catalog IRAS 07299-1651) | 1.4 | (1) | 36.8 | AFGL 5234, S302, DG 121 |
| IRAS Name | NH3(1,1) | NH3(2,2) | HCO+ | HCN | CS | Outflows | H2O | OH | CH3OH |
|---|---|---|---|---|---|---|---|---|---|
| [++/N] | [++/N] | [++/N] | [++/N] | [++/N] | [++/N] | [++/N] | [++/N] | [++/N] | |
| 01195+6136 | N | N | N | N | ++ (7) | N (1) | N (5) | ||
| 02244+6117 | ++ | N | ++ | ++ | ++ (7) | N (1) | N (5) | ||
| 02575+6017 | ++ | ++ | ++ | ++ SS strong sources (,Yun et al. 1999) | ++ (2) | ++ (7,8,9) | ++ (1,11) | N (11,13) | N (5) |
| 02593+6016 | ++ | N | ++ | ++ SS strong sources (,Yun et al. 1999) | ++ (2) | N (8) | ++ (1,11) | ++ (11,10) | N (5) |
| 03064+5638 | N | N | N | ++ SS strong sources (,Yun et al. 1999) | N (8) | N (1) | N (11) | N (5) | |
| 03211+5446 | N | N | N | N | N (8) | ++ (11) | N (11) | N (5) | |
| 03236+5836 | ++ | N | ++ | ++ SS strong sources (,Yun et al. 1999) | ++ (3) | ++ (7) | ++ (1,11) | ++ (11) | N (5) |
| 03595+5110 | N | N | N | N | N (1) | N (5) | |||
| 04073+5102 | N | N | N | N | N (9) | N (1) | |||
| 04269+3510 | N | N | ++ | ++ | ++ (7) | N (1) | N (13) | N (5) | |
| 04324+5106 | ++ | N | ++ | ++ SS strong sources (,Yun et al. 1999) | N (8) | ++ (11) | N (11) | N (5) | |
| 04329+5047 | N | N | N | ++ SS strong sources (,Yun et al. 1999) | N (9) | N (1) | N (5) | ||
| 05100+3723 | N | N | ++ | ++ | ++ (2) | N (8) | N (1) | N (5) | |
| 05197+3355 | N | N | N | ++ | N (9) | N (1) | N (5) | ||
| 05281+3412 | N | N | N | N | N (2) | N (8) | N (1) | N (5) | |
| 05327-0457 | ++ | N | ++ | ++ (1,6) | N (13) | N (5) | |||
| 05341-0530 | N | N | ++ | ++ (7) | ++ (1) | N (5) | |||
| 05345+3157 | N | N | ++ | ++ | ++ (7,8,9) | ++ (1,6,11) | ++ (11) | ||
| 05355+3039 | N | N | ++ | ++ | N (8) | N (1) | N (5) | ||
| 05375+3540 | ++ | ++ | ++ | ++ SS strong sources (,Yun et al. 1999) | ++ (2) | ++ (7) | ++ (1,6,11,12) | N (11,13) | N (5) |
| 05377+3548 | ++ | ++ | ++ | ++ SS strong sources (,Yun et al. 1999) | ++ (4) | ++ (7) | ++ (1) | N (5) | |
| 05480+2544 | ++ | N | ++ | ++ SS strong sources (,Yun et al. 1999) | N (9) | N (1) | N (5) | ||
| 05480+2545 | ++ | ++ | ++ | ++ SS strong sources (,Yun et al. 1999) | ++ (2) | N (9) | N (1) | N (5) | |
| 06006+3015 | ++ | ++ | ++ | ++ SS strong sources (,Yun et al. 1999) | ++ (4) | N (9) | ++ (1) | N (11) | N (5) |
| 06013+3030 | N | N | N | N | N (9) | N (1) | N (5) | ||
| 06055+2039 | ++ | ++ | ++ | ++ SS strong sources (,Yun et al. 1999) | ++ (2) | N (9) | ++ (1,6,12) | ++ (10) | ++ (5) |
| 06056+2131 | ++ | ++ | ++ | ++ SS strong sources (,Yun et al. 1999) | ++ (2) | ++ (7,8,9) | ++ (1,11,10) | N (10) | ++ (5) |
| 06058+2138 | ++ | ++ | ++ | ++ SS strong sources (,Yun et al. 1999) | ++ (2) | ++ (7,8,9) | ++ (1,6,11,12,10) | N (10) | ++ (5) |
| 06061+2151 | ++ | ++ | ++ | ++ SS strong sources (,Yun et al. 1999) | ++ (2) | N (8) | ++ (1,6,11) | N (10) | ++ (5) |
| 06063+2040 | N | N | ++ | ++ SS strong sources (,Yun et al. 1999) | ++ (2) | N (8) | N (1) | N (13) | N (5) |
| 06068+2030 | N | N | ++ | N | N (8) | N (1) | N (5) | ||
| 06073+1249 | N | N | N | ++ SS strong sources (,Yun et al. 1999) | ++ (2) | N (8) | N (1) | N (5) | |
| 06099+1800 | ++ | ++ | ++ | ++ SS strong sources (,Yun et al. 1999) | ++ (7) | ++ (1,6,11,12) | ++ (10) | ++ (15) | |
| 06105+1756 | N | N | ++ | ++ | ++ (2) | ++ (7) | N (1) | N (5) | |
| 06114+1745 | ++ | N | ++ | ++ SS strong sources (,Yun et al. 1999) | ++ (2) | N (8) | N (1) | N (11,5) | |
| 06117+1350 | N | N | ++ | ++ SS strong sources (,Yun et al. 1999) | ++ (2) | N (9) | ++ (1,6,11,12,13) | ++ (10) | ++ (5) |
| 06155+2319 | N | N | ++ | ++ SS strong sources (,Yun et al. 1999) | ++ (2) | N (9) | N (1) | N (5) | |
| 06308+0402 | N | N | ++ | ++ SS strong sources (,Yun et al. 1999) | ++ (7,9) | ++ (1) | N (5) | ||
| 06319+0415 | ++ | ++ | ++ | ++ SS strong sources (,Yun et al. 1999) | ++ (7) | N (1) | N (5) | ||
| 06380+0949 | N | N | N | N | N (9) | N (1) | N (5) | ||
| 06384+0932 | ++ | ++ | ++ | ++ SS strong sources (,Yun et al. 1999) | ++ (3) | ++ (7) | ++ (1,11) | ++ (11) | N (5) |
| 06412-0105 | N | N | N (2) | N (1) | N (5) | ||||
| 06567-0355 | ++ | ++ | ++ (2) | ++ (7) | N (1) | N (5) | |||
| 06581-0848 | N | N | N (1) | N (5) | |||||
| 06581-0846 | N | N | N (1) | N (5) | |||||
| 07029-1215 | N | N | N (1) | N (5) | |||||
| 07299-1651 | N | N | ++ (2) | ++ (1) | N (13) | ++ (5) |
References. — (1) Henning et al. (1992), (2) Bronfman et al. (1996), (3) Schreyer (1997) (4) Mueller et al. (2002) (5) Szymczak et al. (2000), (6) Valdettaro et al. (2001), (7) Wu et al. (1996a, b), (8) Snell et al. (1988), (9) Snell et al. (1990), (10) Chan et al. (1996), (11) Wouterloot et al. (1993), (12) Palagi et al. (1993), (13) Baudry et al. (1997)
| # | telescope | instrument | date | FWHM | rms | ||
|---|---|---|---|---|---|---|---|
| [″] | [mJy/beam] | ||||||
| 1 | IRAM | MAMBO 37ch-bol | 235 | 80 | December 1998 | 14.1 | 3.3 |
| 2 | IRAM | MAMBO 37ch-bol | 235 | 80 | April 1999 | 17.7 | 20.0 |
| 3 | JCMT | SCUBA 37ch-bol | 350 | 30 | Service 1999 | 14.8 | 47.0 |
| 4 | JCMT | SCUBA 37ch-bol | 350 | 30 | October 1999 | 16.0 | 23.7 |
| 5 | JCMT | SCUBA 37ch-bol | 350 | 30 | September 2000 | 15.7 | 17.3 |
| 6 | JCMT | SCUBA 37ch-bol | 350 | 30 | Service 2000 | 15.2 | 22.0 |
| 7 | SMT | 19ch MPIfR bol | 345 | 50 | March 2001 | 26.0 | 430.3 |
Note. — Wavelenghts and Bandwidths in m:
235 GHz, 80 GHz: 1270m, 430m
345 GHz, 30 GHz: 870m, 70m
350 GHz, 50 GHz: 850m, 125m
| IRAS Name | Component | ||||||
|---|---|---|---|---|---|---|---|
| [Jy] | [Jy] | []2 | [pc] | ||||
| 01195+6136 ( 5 )( 5 )footnotemark: | 1 | 0.18 | 0.26 | 3050 | 0.09 | 13 | 0.58 |
| 02244+6117 ( 2 )( 2 )footnotemark: | 1 a | 0.56 | 0.22 | 1320 | 0.19 | 18 | 0.39 |
| 02244+6117 ( 2 )( 2 )footnotemark: | 1 b | 0.45 | 0.19 | 1310 | 0.15 | 18 | 0.39 |
| 02244+6117 ( 2 )( 2 )footnotemark: | 1 c | 0.33 | 0.15 | 800 | 0.15 | 18 | 0.28 |
| 02244+6117 ( 2 )( 2 )footnotemark: | 1 d | 0.17 | 0.12 | 670 | 0.15 | 18 | 0.25 |
| 02244+6117 ( 2 )( 2 )footnotemark: | 2 a | 0.29 | 0.15 | 680 | 0.19 | 18 | 0.25 |
| 02244+6117 ( 2 )( 2 )footnotemark: | 2 b | 0.08 | 0.09 | 190 | 0.17 | 18 | 0.19 BB indicates that beam area is larger than the source extent, and it is used for further calculations (see text) |
| 02244+6117 ( 2 )( 2 )footnotemark: | 2 c | 0.13 | 0.11 | 390 | 0.15 | 18 | 0.14 |
| 02244+6117 ( 2 )( 2 )footnotemark: | 3 | 0.15 | 0.14 | 670 | 0.14 | 18 | 0.25 |
| 02575+6017 ( 1 )( 1 )footnotemark: | 1 a | 0.71 | 0.19 | 1480 | 0.18 | 3 | 0.78 |
| 02575+6017 ( 1 )( 1 )footnotemark: | 1 b | 0.06 | 0.04 | 480 | 0.04 | 3 | 0.38 |
| 02575+6017 ( 1 )( 1 )footnotemark: | 2 | 0.04 | 0.03 | 790 | 0.02 | 3 | 0.54 |
| 02593+6016 ( 1 )( 1 )footnotemark: | 1 | 0.50 | 0.09 | 2170 | 0.11 | 3 | 0.98 |
| 02593+6016 ( 1 )( 1 )footnotemark: | 2 | 0.05 | 0.03 | 640 | 0.04 | 3 | 0.48 |
| 02593+6016 ( 1 )( 1 )footnotemark: | 3 | 0.14 | 0.06 | 1640 | 0.03 | 3 | 0.84 |
| 03064+5638 ( 7 )( 7 )footnotemark: | 1 a | 10.82 | 7.28 | 5300 | 3.12 | 594 | 1.55 |
| 03064+5638 ( 7 )( 7 )footnotemark: | 1 b | 7.63 | 3.89 | 2280 | 3.31 | 594 | 0.94 |
| 03211+5446 ( 7 )( 7 )footnotemark: | 1 | 13.46 | 4.65 | 7780 | 2.48 | 371 | 1.44 |
| 03211+5446 ( 7 )( 7 )footnotemark: | 2 | 11.39 | 5.38 | 8240 | 2.55 | 371 | 1.49 |
| 03236+5836 ( 3 )( 3 )footnotemark: | 1 a | 6.68 | 0.74 | 1220 | 2.21 | 35 | 0.18 |
| 03236+5836 ( 3 )( 3 )footnotemark: | 1 b | 1.22 | 0.50 | 870 | 0.43 | 35 | 0.14 |
| 03236+5836 ( 3 )( 3 )footnotemark: | 2 a | 2.13 | 0.79 | 1610 | 0.58 | 35 | 0.21 |
| 03236+5836 ( 3 )( 3 )footnotemark: | 2 b | 2.06 | 0.70 | 1840 | 0.31 | 35 | 0.22 |
| 03595+5110 ( 7 )( 7 )footnotemark: | 1 a | 1.12 | 0.87 | 790 | 1.43 | 239 | 0.29 |
| 03595+5110 ( 7 )( 7 )footnotemark: | 1 b | 1.06 | 0.74 | 600 | 1.43 | 239 | 0.15 |
| 04073+5102 ( 7 )( 7 )footnotemark: | 1 | 7.73 | 3.29 | 2700 | 3.60 | 448 | 2.09 |
| 04073+5102 ( 7 )( 7 )footnotemark: | 2 | 5.46 | 3.37 | 3210 | 2.40 | 448 | 2.32 |
| 04073+5102 ( 7 )( 7 )footnotemark: | 3 | 9.66 | 4.15 | 4040 | 2.79 | 448 | 2.66 |
| 04073+5102 ( 7 )( 7 )footnotemark: | 4 | 4.35 | 2.72 | 1850 | 2.69 | 448 | 1.63 |
| 04073+5102 ( 7 )( 7 )footnotemark: | 5 | 2.32 | 2.84 | 2130 | 2.40 | 448 | 1.80 |
| 04073+5102 ( 7 )( 7 )footnotemark: | 6 | 2.72 | 2.93 | 2000 | 2.05 | 448 | 1.72 |
| 04073+5102 ( 7 )( 7 )footnotemark: | 7 | 3.58 | 4.11 | 3400 | 2.01 | 448 | 2.40 |
| 04269+3510 ( 7 )( 7 )footnotemark: | 1 | 1.89 | 1.15 | 570 | 2.81 | 330 | 0.03 |
| 04269+3510 ( 7 )( 7 )footnotemark: | 2 | 2.25 | 1.05 | 650 | 2.86 | 330 | 0.05 |
| 04324+5106 ( 2 )( 2 )footnotemark: | 1 | 0.23 | 0.14 | 370 | 0.28 | 22 | 0.37 |
| 04324+5106 ( 2 )( 2 )footnotemark: | 2 | 0.04 | 0.09 | 140 | 0.19 | 22 | 0.51 BB indicates that beam area is larger than the source extent, and it is used for further calculations (see text) |
| 04324+5106 ( 2 )( 2 )footnotemark: | 3 | 0.01 | 0.05 | 80 | 0.10 | 22 | 0.51 BB indicates that beam area is larger than the source extent, and it is used for further calculations (see text) |
| 04324+5106 ( 2 )( 2 )footnotemark: | 4 | 0.01 | 0.07 | 120 | 0.28 | 22 | 0.51 BB indicates that beam area is larger than the source extent, and it is used for further calculations (see text) |
| 04329+5047 ( 7 )( 7 )footnotemark: | 1 | 10.39 | 4.03 | 7050 | 1.86 | 354 | 2.65 |
| 05100+3723 ( 3 )( 3 )footnotemark: | 1 a | 3.38 | 0.86 | 3850 | 0.22 | 22 | 0.86 |
| 05100+3723 ( 3 )( 3 )footnotemark: | 1 b | 1.75 | 0.74 | 2660 | 0.19 | 22 | 0.71 |
| 05197+3355 ( 7 )( 7 )footnotemark: | 1 | 11.42 | 3.73 | 4280 | 3.01 | 421 | 0.60 |
| 05281+3412 ( 5 )( 5 )footnotemark: | 15 | ||||||
| 053270457 ( 2 )( 2 )footnotemark: | 1 | 0.09 | 0.12 | 740 | 0.08 | 13 | 0.22 |
| 053410530 ( 7 )( 7 )footnotemark: | 258 | ||||||
| 05345+3157 ( 5 )( 5 )footnotemark: | 1 | 1.99 | 0.44 | 5730 | 0.31 | 15 | 0.73 |
| 05345+3157 ( 5 )( 5 )footnotemark: | 2 | 1.59 | 0.50 | 7810 | 0.21 | 15 | 0.86 |
| 05345+3157 ( 5 )( 5 )footnotemark: | 3 | 1.16 | 0.62 | 8480 | 0.11 | 15 | 0.90 |
| 05355+3039 ( 5 )( 5 )footnotemark: | 1 | 0.53 | 0.34 | 2720 | 0.12 | 18 | 0.49 |
| 05375+3540 ( 6 )( 6 )footnotemark: | 1 a | 9.72 | 0.73 | 4560 | 1.57 | 22 | 0.65 |
| 05375+3540 ( 6 )( 6 )footnotemark: | 1 b | 1.43 | 0.40 | 2050 | 0.28 | 22 | 0.43 |
| 05375+3540 ( 6 )( 6 )footnotemark: | 1 c | 0.20 | 0.24 | 560 | 0.16 | 22 | 0.19 |
| 05375+3540 ( 6 )( 6 )footnotemark: | 2 | 0.97 | 0.39 | 1360 | 0.34 | 22 | 0.34 |
| 05377+3548 ( 6 )( 6 )footnotemark: | 1 | 2.40 | 0.68 | 3280 | 0.40 | 25 | 0.55 |
| 05377+3548 ( 6 )( 6 )footnotemark: | 2 a | 1.97 | 0.72 | 2480 | 0.43 | 25 | 0.47 |
| 05377+3548 ( 6 )( 6 )footnotemark: | 2 b | 2.13 | 0.71 | 3480 | 0.25 | 25 | 0.57 |
| 05377+3548 ( 6 )( 6 )footnotemark: | 2 c | 2.06 | 0.97 | 4020 | 0.21 | 25 | 0.61 |
| 05377+3548 ( 6 )( 6 )footnotemark: | 3 | 2.47 | 0.88 | 5070 | 0.32 | 25 | 0.69 |
| 05377+3548 ( 6 )( 6 )footnotemark: | 4 | 1.51 | 0.65 | 3130 | 0.30 | 25 | 0.53 |
| 05377+3548 ( 6 )( 6 )footnotemark: | 5 | 1.29 | 0.65 | 3610 | 0.17 | 25 | 0.58 |
| 05377+3548 ( 6 )( 6 )footnotemark: | 6 | 1.15 | 0.51 | 2520 | 0.19 | 25 | 0.48 |
| 05377+3548 ( 6 )( 6 )footnotemark: | 7 | 1.38 | 0.52 | 3060 | 0.37 | 25 | 0.53 |
| 05377+3548 ( 6 )( 6 )footnotemark: | 8 | 3.59 | 0.79 | 6810 | 0.17 | 25 | 0.80 |
| 05377+3548 ( 6 )( 6 )footnotemark: | 9 | 4.91 | 1.41 | 9250 | 0.24 | 25 | 0.94 |
| 05377+3548 ( 6 )( 6 )footnotemark: | 10 | 1.85 | 0.91 | 6040 | 0.12 | 25 | 0.75 |
| 05377+3548 ( 6 )( 6 )footnotemark: | 11 | 0.43 | 0.60 | 2850 | 0.13 | 25 | 0.51 |
| 05480+2545/4 ( 2 )( 2 )footnotemark: | 1 | 0.32 | 0.20 | 460 | 0.35 | 26 | 0.17 |
| 06006+3015 ( 2 )( 2 )footnotemark: | 1 | 0.40 | 0.15 | 1020 | 0.25 | 15 | 0.71 |
| 06013+3030 ( 7 )( 7 )footnotemark: | 437 | ||||||
| 06055+2039 ( 2 )( 2 )footnotemark: | 1 | 0.74 | 0.22 | 1160 | 0.41 | 15 | 0.33 |
| 06055+2039 ( 5 )( 5 )footnotemark: | 1 a | 2.86 | 0.34 | 2260 | 0.86 | 19 | 0.50 |
| 06055+2039 ( 5 )( 5 )footnotemark: | 1 b | 0.31 | 0.17 | 620 | 0.18 | 19 | 0.23 |
| 06055+2039 ( 5 )( 5 )footnotemark: | 2 a | 1.08 | 0.50 | 4000 | 0.16 | 19 | 0.67 |
| 06055+2039 ( 5 )( 5 )footnotemark: | 2 b | 0.58 | 0.43 | 2550 | 0.12 | 19 | 0.53 |
| 06055+2039 ( 5 )( 5 )footnotemark: | 2 c | 0.30 | 0.41 | 2450 | 0.15 | 19 | 0.52 |
| 06056+2131 ( 1 )( 1 )footnotemark: | 1 a | 1.00 | 0.11 | 1360 | 0.33 | 4 | 0.38 |
| 06056+2131 ( 1 )( 1 )footnotemark: | 1 b | 0.21 | 0.07 | 910 | 0.08 | 4 | 0.30 |
| 06056+2131 ( 1 )( 1 )footnotemark: | 2 a | 0.22 | 0.08 | 750 | 0.11 | 4 | 0.27 |
| 06056+2131 ( 1 )( 1 )footnotemark: | 2 b | 0.10 | 0.07 | 450 | 0.06 | 4 | 0.19 |
| 06056+2131 ( 1 )( 1 )footnotemark: | 2 c | 0.05 | 0.04 | 500 | 0.05 | 4 | 0.20 |
| 06056+2131 ( 3 )( 3 )footnotemark: | 1 | 13.72 | 1.70 | 3000 | 2.19 | 37 | 0.58 |
| 06056+2131 ( 3 )( 3 )footnotemark: | 2 | 5.28 | 1.00 | 2040 | 0.76 | 37 | 0.47 |
| 06058+2138 ( 2 )( 2 )footnotemark: | 1 | 5.26 | 0.91 | 12360 | 0.69 | 21 | 1.20 |
| 06058+2138 ( 3 )( 3 )footnotemark: | 1 | 17.28 | 2.17 | 4220 | 2.23 | 73 | 0.70 |
| 06061+2151 ( 2 )( 2 )footnotemark: | 1 | 0.61 | 0.56 | 2260 | 0.31 | 19 | 0.49 |
| 06063+2040 ( 6 )( 6 )footnotemark: | 1 | 1.43 | 0.32 | 1170 | 0.49 | 24 | 0.34 |
| 06063+2040 ( 6 )( 6 )footnotemark: | 2 | 0.22 | 0.24 | 700 | 0.12 | 24 | 0.25 |
| 06068+2030 ( 6 )( 6 )footnotemark: | 1 | 2.44 | 1.17 | 10540 | 0.16 | 17 | 1.11 |
| 06068+2030 ( 6 )( 6 )footnotemark: | 2 | 1.42 | 0.44 | 4360 | 0.16 | 17 | 0.71 |
| 06073+1249 ( 7 )( 7 )footnotemark: | 1 | 9.52 | 1.74 | 2780 | 3.68 | 240 | 1.25 |
| 06073+1249 ( 7 )( 7 )footnotemark: | 2 | 1.10 | 0.91 | 810 | 1.40 | 240 | 0.44 |
| 06099+1800 ( 7 )( 7 )footnotemark: | 1 | 29.51 | 7.39 | 1650 | 15.89 | 501 | 0.15 |
| 06099+1800 ( 7 )( 7 )footnotemark: | 2 | 29.77 | 9.69 | 1680 | 16.92 | 501 | 0.15 |
| 06099+1800 ( 7 )( 7 )footnotemark: | 3 | 1.77 | 1.81 | 820 | 2.11 | 501 | 0.07 |
| 06099+1800 ( 7 )( 7 )footnotemark: | 4 a | 14.25 | 3.13 | 1920 | 6.02 | 501 | 0.16 |
| 06099+1800 ( 7 )( 7 )footnotemark: | 4 b | 1.22 | 1.38 | 280 | 4.17 | 501 | 0.10 BB indicates that beam area is larger than the source extent, and it is used for further calculations (see text) |
| 06099+1800 ( 7 )( 7 )footnotemark: | 4 c | 3.54 | 2.60 | 1070 | 2.89 | 501 | 0.10 |
| 06105+1756 ( 7 )( 7 )footnotemark: | 1 a | 9.56 | 2.22 | 5800 | 2.06 | 230 | 0.99 |
| 06105+1756 ( 7 )( 7 )footnotemark: | 1 b | 7.51 | 2.87 | 7300 | 1.38 | 230 | 1.13 |
| 06105+1756 ( 7 )( 7 )footnotemark: | 2 | 12.56 | 3.13 | 9630 | 1.39 | 230 | 1.30 |
| 06105+1756 ( 7 )( 7 )footnotemark: | 3 | 5.67 | 2.69 | 5940 | 1.56 | 230 | 1.01 |
| 06114+1745 ( 5 )( 5 )footnotemark: | 1 a | 0.37 | 0.21 | 850 | 0.13 | 15 | 0.35 |
| 06114+1745 ( 5 )( 5 )footnotemark: | 1 b | 0.16 | 0.14 | 490 | 0.11 | 15 | 0.24 |
| 06114+1745 ( 5 )( 5 )footnotemark: | 2 | 0.27 | 0.17 | 1000 | 0.12 | 15 | 0.39 |
| 06114+1745 ( 5 )( 5 )footnotemark: | 3 | 0.13 | 0.13 | 530 | 0.10 | 15 | 0.25 |
| 06114+1745 ( 5 )( 5 )footnotemark: | 4 | 0.33 | 0.23 | 1680 | 0.09 | 15 | 0.26 |
| 06117+1350 ( 2 )( 2 )footnotemark: | 1 | 0.45 | 0.28 | 640 | 0.43 | 35 | 0.41 |
| 06155+2319 ( 2 )( 2 )footnotemark: | 1 a | 0.29 | 0.11 | 480 | 0.28 | 15 | 0.13 |
| 06155+2319 ( 2 )( 2 )footnotemark: | 1 b | 0.07 | 0.06 | 200 | 0.16 | 15 | 0.14 BB indicates that beam area is larger than the source extent, and it is used for further calculations (see text) |
| 06308+0402 ( 4 )( 4 )footnotemark: | 1 a | 0.62 | 0.26 | 800 | 0.30 | 21 | 0.21 |
| 06308+0402 ( 4 )( 4 )footnotemark: | 1 b | 0.36 | 0.17 | 530 | 0.24 | 21 | 0.16 |
| 06308+0402 ( 4 )( 4 )footnotemark: | 2 a | 0.45 | 0.21 | 590 | 0.29 | 21 | 0.17 |
| 06308+0402 ( 4 )( 4 )footnotemark: | 2 b | 0.55 | 0.23 | 670 | 0.29 | 21 | 0.19 |
| 06308+0402 ( 4 )( 4 )footnotemark: | 3 a | 0.15 | 0.10 | 160 | 0.21 | 21 | 0.12 BB indicates that beam area is larger than the source extent, and it is used for further calculations (see text) |
| 06308+0402 ( 4 )( 4 )footnotemark: | 3 b | 0.12 | 0.12 | 270 | 0.20 | 21 | 0.07 |
| 06308+0402 ( 4 )( 4 )footnotemark: | 4 | 0.25 | 0.22 | 580 | 0.20 | 21 | 0.17 |
| 06319+0415 ( 7 )( 7 )footnotemark: | 1 | 27.07 | 5.08 | 2060 | 13.06 | 667 | 0.34 |
| 06319+0415 ( 7 )( 7 )footnotemark: | 2 | 1.14 | 2.16 | 570 | 3.63 | 667 | 0.06 |
| 06380+0949 ( 7 )( 7 )footnotemark: | 724 | ||||||
| 06384+0932 ( 3 )( 3 )footnotemark: | 1 a | 41.74 | 12.59 | 12700 | 2.06 | 68 | 0.47 |
| 06384+0932 ( 3 )( 3 )footnotemark: | 1 b | 57.28 | 13.12 | 43690 | 2.05 | 68 | 0.87 |
| 06384+0932 ( 3 )( 3 )footnotemark: | 1 c | 7.34 | 1.85 | 1960 | 1.03 | 68 | 0.18 |
| 06384+0932 ( 3 )( 3 )footnotemark: | 2 | 15.01 | 4.17 | 15600 | 0.70 | 68 | 0.52 |
| 06384+0932 ( 3 )( 3 )footnotemark: | 3 | 17.75 | 4.40 | 17320 | 0.37 | 68 | 0.54 |
| 06384+0932 ( 3 )( 3 )footnotemark: | 4 | 17.78 | 12.91 | 17320 | 0.36 | 68 | 0.54 |
| 064120105 ( 5 )( 5 )footnotemark: | 1 | 0.47 | 0.29 | 2820 | 0.11 | 14 | 0.31 |
| 065670355 ( 4 )( 4 )footnotemark: | 1 | 4.00 | 0.84 | 2460 | 0.74 | 32 | 0.67 |
| 065810846/8 ( 5 )( 5 )footnotemark: | 1 | 1.68 | 0.93 | 11210 | 0.11 | 18 | 2.31 |
| 065810846/8 ( 5 )( 5 )footnotemark: | 2 | 0.68 | 0.77 | 5060 | 0.11 | 18 | 1.54 |
| 070291215 ( 4 )( 4 )footnotemark: | 1 a | 1.99 | 0.50 | 1660 | 0.58 | 18 | 0.21 |
| 070291215 ( 4 )( 4 )footnotemark: | 1 b | 0.36 | 0.16 | 640 | 0.15 | 18 | 0.12 |
| 070291215 ( 4 )( 4 )footnotemark: | 2 a | 0.51 | 0.20 | 930 | 0.21 | 18 | 0.15 |
| 070291215 ( 4 )( 4 )footnotemark: | 2 b | 0.16 | 0.12 | 270 | 0.16 | 18 | 0.05 |
| 070291215 ( 4 )( 4 )footnotemark: | 3 | 0.46 | 0.18 | 880 | 0.20 | 18 | 0.15 |
| 070291215 ( 4 )( 4 )footnotemark: | 4 | 0.18 | 0.13 | 490 | 0.13 | 18 | 0.09 |
| 072991651 ( 2 )( 2 )footnotemark: | 1 | 0.45 | 0.15 | 720 | 0.35 | 16 | 0.17 |
| 072991651 ( 5 )( 5 )footnotemark: | 14 |
| IRAS name | Component | Peak position (B1950) | ||||
|---|---|---|---|---|---|---|
| [M⊙] | [1/cm2 ] | [1/cm3] | RA | DEC | ||
| 01195+6136 ( 5 )( 5 )footnotemark: | 1 | 5 | 0.9 | 0.5 | 01:19:56.3 | :34:23 |
| 02244+6117 ( 2 )( 2 )footnotemark: | 1 a | 89 | 6.7 | 5.5 | 02:24:20.8 | :16:27 |
| 02244+6117 ( 2 )( 2 )footnotemark: | 1 b | 71 | 5.3 | 4.4 | 02:24:24.3 | :16:11 |
| 02244+6117 ( 2 )( 2 )footnotemark: | 1 c | 53 | 5.5 | 6.3 | 02:24:18.3 | :15:54 |
| 02244+6117 ( 2 )( 2 )footnotemark: | 1 d | 27 | 5.3 | 6.9 | 02:24:17.8 | :15:42 |
| 02244+6117 ( 2 )( 2 )footnotemark: | 2 a | 45 | 6.8 | 8.8 | 02:24:17.9 | :14:29 |
| 02244+6117 ( 2 )( 2 )footnotemark: | 2 b | 12 | 6.1 | 10.4 BBbeam area used for N(H), n(H) because of too small source extents (see text) | 02:24:17.2 | :13:43 |
| 02244+6117 ( 2 )( 2 )footnotemark: | 2 c | 21 | 5.4 | 12.1 | 02:24:16.1 | :13:00 |
| 02244+6117 ( 2 )( 2 )footnotemark: | 3 | 23 | 5.1 | 6.8 | 02:24:22.1 | :13:46 |
| 02575+6017 ( 1 )( 1 )footnotemark: | 1 a | 350 | 10.1 | 4.2 | 02:57:34.7 | :17:30 |
| 02575+6017 ( 1 )( 1 )footnotemark: | 1 b | 30 | 2.1 | 1.8 | 02:57:39.0 | :16:49 |
| 02575+6017 ( 1 )( 1 )footnotemark: | 2 | 18 | 1.0 | 0.6 | 02:57:35.6 | :14:08 |
| 02593+6016 ( 1 )( 1 )footnotemark: | 1 | 260 | 6.5 | 2.2 | 02:59:23.3 | :16:19 |
| 02593+6016 ( 1 )( 1 )footnotemark: | 2 | 27 | 2.0 | 1.4 | 02:59:28.9 | :16:54 |
| 02593+6016 ( 1 )( 1 )footnotemark: | 3 | 75 | 1.6 | 0.6 | 02:59:03.9 | :16:30 |
| 03064+5638 ( 7 )( 7 )footnotemark: | 1 a | 1400 | 12.7 | 2.7 | 03:06:26.9 | :39:19 |
| 03064+5638 ( 7 )( 7 )footnotemark: | 1 b | 1000 | 13.5 | 4.6 | 03:06:28.8 | :39:08 |
| 03211+5446 ( 7 )( 7 )footnotemark: | 1 | 1000 | 10.1 | 2.3 | 03:21:04.7 | :47:07 |
| 03211+5446 ( 7 )( 7 )footnotemark: | 2 | 870 | 10.3 | 2.3 | 03:21:03.6 | :46:54 |
| 03236+5836 ( 3 )( 3 )footnotemark: | 1 a | 49 | 25.7 | 47.0 | 03:23:39.0 | :36:38 |
| 03236+5836 ( 3 )( 3 )footnotemark: | 1 b | 9 | 5.0 | 11.2 | 03:23:40.0 | :35:22 |
| 03236+5836 ( 3 )( 3 )footnotemark: | 2 a | 16 | 6.7 | 10.5 | 03:23:24.7 | :33:14 |
| 03236+5836 ( 3 )( 3 )footnotemark: | 2 b | 15 | 3.7 | 5.3 | 03:23:31.5 | :33:53 |
| 03595+5110 ( 7 )( 7 )footnotemark: | 1 a | 97 | 5.8 | 6.4 | 03:59:25.9 | :11:14 |
| 03595+5110 ( 7 )( 7 )footnotemark: | 1 b | 92 | 5.8 | 12.8 | 03:59:27.3 | :11:28 |
| 04073+5102 ( 7 )( 7 )footnotemark: | 1 | 4100 | 14.6 | 2.3 | 04:07:17.7 | :02:44 |
| 04073+5102 ( 7 )( 7 )footnotemark: | 2 | 2900 | 9.8 | 1.4 | 04:07:16.2 | :01:34 |
| 04073+5102 ( 7 )( 7 )footnotemark: | 3 | 5200 | 11.4 | 1.4 | 04:07:24.8 | :01:04 |
| 04073+5102 ( 7 )( 7 )footnotemark: | 4 | 2300 | 10.9 | 2.2 | 04:07:21.0 | :01:04 |
| 04073+5102 ( 7 )( 7 )footnotemark: | 5 | 1200 | 9.8 | 1.8 | 04:07:16.0 | :00:08 |
| 04073+5102 ( 7 )( 7 )footnotemark: | 6 | 1500 | 8.3 | 1.6 | 04:07:28.4 | :00:17 |
| 04073+5102 ( 7 )( 7 )footnotemark: | 7 | 1900 | 8.2 | 1.1 | 04:07:25.3 | :02:14 |
| 04269+3510 ( 7 )( 7 )footnotemark: | 1 | 10 | 11.4 | 144.2 | 04:26:57.8 | :10:03 |
| 04269+3510 ( 7 )( 7 )footnotemark: | 2 | 11 | 11.6 | 78.6 | 04:26:58.6 | :10:38 |
| 04324+5106 ( 2 )( 2 )footnotemark: | 1 | 270 | 9.9 | 8.7 | 04:32:30.1 | :06:54 |
| 04324+5106 ( 2 )( 2 )footnotemark: | 2 | 44 | 6.8 | 4.3 BBbeam area used for N(H), n(H) because of too small source extents (see text) | 04:32:29.7 | :06:15 |
| 04324+5106 ( 2 )( 2 )footnotemark: | 3 | 13 | 3.6 | 2.2 BBbeam area used for N(H), n(H) because of too small source extents (see text) | 04:32:31.7 | :06:13 |
| 04324+5106 ( 2 )( 2 )footnotemark: | 4 | 16 | 9.9 | 6.3 BBbeam area used for N(H), n(H) because of too small source extents (see text) | 04:32:31.4 | :06:30 |
| 04329+5047 ( 7 )( 7 )footnotemark: | 1 | 3000 | 7.5 | 0.9 | 04:33:00.2 | :47:28 |
| 05100+3723 ( 3 )( 3 )footnotemark: | 1 a | 170 | 2.5 | 1.0 | 05:10:02.7 | :23:36 |
| 05100+3723 ( 3 )( 3 )footnotemark: | 1 b | 87 | 2.2 | 1.0 | 05:10:01.9 | :24:11 |
| 05197+3355 ( 7 )( 7 )footnotemark: | 1 | 300 | 12.2 | 6.6 | 05:19:49.7 | :55:32 |
| 053270457 ( 2 )( 2 )footnotemark: | 1 | 9 | 2.8 | 4.1 | 05:32:38.9 | :58:22 |
| 05345+3157 ( 5 )( 5 )footnotemark: | 1 | 48 | 3.2 | 1.4 | 05:34:37.1 | :58:20 |
| 05345+3157 ( 5 )( 5 )footnotemark: | 2 | 38 | 2.2 | 0.8 | 05:34:37.6 | :57:49 |
| 05345+3157 ( 5 )( 5 )footnotemark: | 3 | 28 | 1.2 | 0.4 | 05:34:27.6 | :59:01 |
| 05355+3039 ( 5 )( 5 )footnotemark: | 1 | 13 | 1.2 | 0.8 | 05:35:34.5 | :39:28 |
| 05375+3540 ( 6 )( 6 )footnotemark: | 1 a | 230 | 17.3 | 8.6 | 05:37:32.1 | :40:22 |
| 05375+3540 ( 6 )( 6 )footnotemark: | 1 b | 34 | 3.1 | 2.4 | 05:37:32.2 | :39:10 |
| 05375+3540 ( 6 )( 6 )footnotemark: | 1 c | 5 | 1.8 | 3.0 | 05:37:32.8 | :41:38 |
| 05375+3540 ( 6 )( 6 )footnotemark: | 2 | 23 | 3.7 | 3.6 | 05:37:32.3 | :36:56 |
| 05377+3548 ( 6 )( 6 )footnotemark: | 1 | 57 | 4.4 | 2.6 | 05:37:38.4 | :47:57 |
| 05377+3548 ( 6 )( 6 )footnotemark: | 2 a | 47 | 4.7 | 3.3 | 05:37:45.7 | :48:03 |
| 05377+3548 ( 6 )( 6 )footnotemark: | 2 b | 51 | 2.8 | 1.6 | 05:37:44.4 | :48:33 |
| 05377+3548 ( 6 )( 6 )footnotemark: | 2 c | 49 | 2.4 | 1.3 | 05:37:42.0 | :48:22 |
| 05377+3548 ( 6 )( 6 )footnotemark: | 3 | 59 | 3.6 | 1.7 | 05:37:38.9 | :47:04 |
| 05377+3548 ( 6 )( 6 )footnotemark: | 4 | 36 | 3.3 | 2.0 | 05:37:49.2 | :48:31 |
| 05377+3548 ( 6 )( 6 )footnotemark: | 5 | 31 | 1.9 | 1.0 | 05:37:32.6 | :48:15 |
| 05377+3548 ( 6 )( 6 )footnotemark: | 6 | 28 | 2.2 | 1.5 | 05:37:44.2 | :50:38 |
| 05377+3548 ( 6 )( 6 )footnotemark: | 7 | 33 | 4.1 | 2.5 | 05:37:00.8 | :50:39 |
| 05377+3548 ( 6 )( 6 )footnotemark: | 8 | 86 | 1.9 | 0.7 | 05:37:04.1 | :51:07 |
| 05377+3548 ( 6 )( 6 )footnotemark: | 9 | 120 | 2.6 | 0.9 | 05:37:08.5 | :48:19 |
| 05377+3548 ( 6 )( 6 )footnotemark: | 10 | 44 | 1.3 | 0.6 | 05:37:23.9 | :46:38 |
| 05377+3548 ( 6 )( 6 )footnotemark: | 11 | 10 | 1.4 | 0.9 | 05:37:53.0 | :50:44 |
| 05480+2545/4 ( 2 )( 2 )footnotemark: | 1 | 46 | 12.4 | 24.0 | 05:51:10.6 | :46:08 |
| 06006+3015 ( 2 )( 2 )footnotemark: | 1 | 290 | 8.8 | 4.0 | 06:00:41.6 | :15:01 |
| 06055+2039 ( 2 )( 2 )footnotemark: | 1 | 97 | 14.6 | 14.3 | 06:05:36.6 | :39:33 |
| 06055+2039 ( 5 )( 5 )footnotemark: | 1 a | 84 | 8.9 | 5.8 | 06:05:36.5 | :39:40 |
| 06055+2039 ( 5 )( 5 )footnotemark: | 1 b | 9 | 1.8 | 2.6 | 06:05:32.3 | :40:07 |
| 06055+2039 ( 5 )( 5 )footnotemark: | 2 a | 32 | 1.6 | 0.8 | 06:05:41.0 | :38:46 |
| 06055+2039 ( 5 )( 5 )footnotemark: | 2 b | 17 | 1.3 | 0.8 | 06:05:46.1 | :38:43 |
| 06055+2039 ( 5 )( 5 )footnotemark: | 2 c | 9 | 1.5 | 0.9 | 06:05:49.1 | :39:18 |
| 06056+2131 ( 1 )( 1 )footnotemark: | 1 a | 130 | 18.7 | 15.9 | 06:05:40.3 | :31:34 |
| 06056+2131 ( 1 )( 1 )footnotemark: | 1 b | 27 | 4.4 | 4.7 | 06:05:42.5 | :31:45 |
| 06056+2131 ( 1 )( 1 )footnotemark: | 2 a | 29 | 6.0 | 7.3 | 06:05:46.5 | :32:19 |
| 06056+2131 ( 1 )( 1 )footnotemark: | 2 b | 13 | 3.3 | 5.7 | 06:05:44.4 | :32:14 |
| 06056+2131 ( 1 )( 1 )footnotemark: | 2 c | 7 | 2.6 | 4.2 | 06:05:46.9 | :32:47 |
| 06056+2131 ( 3 )( 3 )footnotemark: | 1 | 410 | 25.4 | 14.2 | 06:05:40.2 | :31:35 |
| 06056+2131 ( 3 )( 3 )footnotemark: | 2 | 160 | 8.8 | 6.0 | 06:05:46.1 | :32:20 |
| 06058+2138 ( 2 )( 2 )footnotemark: | 1 | 690 | 24.9 | 6.7 | 06:05:52.8 | :38:41 |
| 06058+2138 ( 3 )( 3 )footnotemark: | 1 | 510 | 25.9 | 12.1 | 06:05:53.0 | :38:41 |
| 06061+2151 ( 2 )( 2 )footnotemark: | 1 | 80 | 11.3 | 7.4 | 06:06:06.0 | :51:10 |
| 06063+2040 ( 6 )( 6 )footnotemark: | 1 | 42 | 5.4 | 5.1 | 06:06:22.4 | :39:20 |
| 06063+2040 ( 6 )( 6 )footnotemark: | 2 | 6 | 1.3 | 1.7 | 06:06:27.4 | :40:32 |
| 06068+2030 ( 6 )( 6 )footnotemark: | 1 | 72 | 1.8 | 0.5 | 06:06:53.3 | :30:30 |
| 06068+2030 ( 6 )( 6 )footnotemark: | 2 | 42 | 1.8 | 0.8 | 06:06:51.2 | :31:05 |
| 06073+1249 ( 7 )( 7 )footnotemark: | 1 | 1700 | 14.9 | 3.9 | 06:07:23.4 | :49:28 |
| 06073+1249 ( 7 )( 7 )footnotemark: | 2 | 200 | 5.7 | 4.2 | 06:07:27.0 | :49:28 |
| 06099+1800 ( 7 )( 7 )footnotemark: | 1 | 150 | 64.6 | 143.1 | 06:09:58.3 | :01:16 |
| 06099+1800 ( 7 )( 7 )footnotemark: | 2 | 150 | 68.8 | 150.9 | 06:09:58.7 | :00:12 |
| 06099+1800 ( 7 )( 7 )footnotemark: | 3 | 9 | 8.6 | 37.1 | 06:09:51.7 | :59:16 |
| 06099+1800 ( 7 )( 7 )footnotemark: | 4 a | 73 | 24.5 | 48.7 | 06:10:01.4 | :59:24 |
| 06099+1800 ( 7 )( 7 )footnotemark: | 4 b | 6 | 17.0 | 54.4BBbeam area used for N(H), n(H) because of too small source extents (see text) | 06:10:01.4 | :58:37 |
| 06099+1800 ( 7 )( 7 )footnotemark: | 4 c | 18 | 11.8 | 37.6 | 06:09:59.0 | :58:09 |
| 06105+1756 ( 7 )( 7 )footnotemark: | 1 a | 480 | 8.4 | 2.7 | 06:10:34.2 | :56:21 |
| 06105+1756 ( 7 )( 7 )footnotemark: | 1 b | 380 | 5.6 | 1.6 | 06:10:36.4 | :56:51 |
| 06105+1756 ( 7 )( 7 )footnotemark: | 2 | 630 | 5.6 | 1.4 | 06:10:31.1 | :56:43 |
| 06105+1756 ( 7 )( 7 )footnotemark: | 3 | 280 | 6.3 | 2.0 | 06:10:51.7 | :55:37 |
| 06114+1745 ( 5 )( 5 )footnotemark: | 1 a | 17 | 1.3 | 1.2 | 06:08:33.4 | :46:30 |
| 06114+1745 ( 5 )( 5 )footnotemark: | 1 b | 7 | 1.1 | 1.5 | 06:08:34.8 | :46:51 |
| 06114+1745 ( 5 )( 5 )footnotemark: | 2 | 12 | 1.2 | 1.0 | 06:08:34.8 | :45:52 |
| 06114+1745 ( 5 )( 5 )footnotemark: | 3 | 6 | 1.1 | 1.4 | 06:08:32.4 | :45:05 |
| 06114+1745 ( 5 )( 5 )footnotemark: | 4 | 8 | 0.9 | 1.1 | 06:08:30.3 | :45:56 |
| 06117+1350 ( 2 )( 2 )footnotemark: | 1 | 210 | 15.5 | 12.3 | 06:11:46.7 | :50:34 |
| 06155+2039 ( 2 )( 2 )footnotemark: | 1 a | 24 | 10.1 | 24.7 | 06:15:34.4 | :19:54 |
| 06155+2039 ( 2 )( 2 )footnotemark: | 1 b | 6 | 5.8 | 13.8BBbeam area used for N(H), n(H) because of too small source extents (see text) | 06:15:34.3 | :19:36 |
| 06308+0402 ( 4 )( 4 )footnotemark: | 1 a | 12 | 3.0 | 4.6 | 06:30:50.5 | :03:38 |
| 06308+0402 ( 4 )( 4 )footnotemark: | 1 b | 7 | 2.4 | 4.8 | 06:30:49.8 | :03:23 |
| 06308+0402 ( 4 )( 4 )footnotemark: | 2 a | 8 | 2.9 | 5.5 | 06:30:52.3 | :02:36 |
| 06308+0402 ( 4 )( 4 )footnotemark: | 2 b | 10 | 2.9 | 4.9 | 06:30:51.4 | :02:42 |
| 06308+0402 ( 4 )( 4 )footnotemark: | 3 a | 3 | 2.1 | 5.4BBbeam area used for N(H), n(H) because of too small source extents (see text) | 06:30:55.1 | :02:52 |
| 06308+0402 ( 4 )( 4 )footnotemark: | 3 b | 2 | 2.0 | 8.6 | 06:30:54.4 | :02:51 |
| 06308+0402 ( 4 )( 4 )footnotemark: | 4 | 5 | 2.0 | 3.8 | 06:30:53.0 | :02:02 |
| 06319+0415 ( 7 )( 7 )footnotemark: | 1 | 550 | 53.1 | 50.3 | 06:31:58.5 | :15:02 |
| 06319+0415 ( 7 )( 7 )footnotemark: | 2 | 23 | 14.8 | 86.7 | 06:32:03.1 | :14:13 |
| 06384+0932 ( 3 )( 3 )footnotemark: | 1 a | 180 | 24.0 | 16.7 | 06:38:25.3 | :32:21 |
| 06384+0932 ( 3 )( 3 )footnotemark: | 1 b | 240 | 23.8 | 8.9 | 06:38:27.3 | :32:08 |
| 06384+0932 ( 3 )( 3 )footnotemark: | 1 c | 31 | 11.9 | 22.0 | 06:38:30.4 | :32:12 |
| 06384+0932 ( 3 )( 3 )footnotemark: | 2 | 64 | 8.1 | 5.1 | 06:38:21.0 | :36:59 |
| 06384+0932 ( 3 )( 3 )footnotemark: | 3 | 76 | 4.3 | 2.6 | 06:38:19.0 | :37:54 |
| 06384+0932 ( 3 )( 3 )footnotemark: | 4 | 76 | 4.2 | 2.5 | 06:38:30.0 | :30:08 |
| 064120105 ( 5 )( 5 )footnotemark: | 1 | 4 | 1.1 | 1.2 | 06:38:43.3 | :02:18 |
| 065670355 ( 4 )( 4 )footnotemark: | 1 | 200 | 7.4 | 3.6 | 06:56:46.5 | :55:19 |
| 065810846/8 ( 5 )( 5 )footnotemark: | 1 | 200 | 1.1 | 0.2 | 06:55:41.8 | :42:57 |
| 065810846/8 ( 5 )( 5 )footnotemark: | 2 | 81 | 1.1 | 0.2 | 06:55:38.0 | :41:34 |
| 070291215 ( 4 )( 4 )footnotemark: | 1 a | 15 | 5.8 | 8.8 | 07:00:31.3 | :09:54 |
| 070291215 ( 4 )( 4 )footnotemark: | 1 b | 3 | 1.5 | 4.2 | 07:00:28.9 | :09:31 |
| 070291215 ( 4 )( 4 )footnotemark: | 2 a | 4 | 2.1 | 4.5 | 07:00:39.6 | :11:10 |
| 070291215 ( 4 )( 4 )footnotemark: | 2 b | 1 | 1.6 | 11.0 | 07:00:41.3 | :11:18 |
| 070291215 ( 4 )( 4 )footnotemark: | 3 | 4 | 2.0 | 4.5 | 07:00:23.9 | :07:30 |
| 070291215 ( 4 )( 4 )footnotemark: | 4 | 1 | 1.3 | 4.5 | 07:04:18.0 | :07:46 |
| 072991651 ( 2 )( 2 )footnotemark: | 1 | 28 | 12.7 | 24.6 | 07:29:54.9 | :51:41 |
The fitted radial intensity profile exponent is , the resulting radial density profile exponent is . The error of is about 0.3. The mean values and the standard deviation of the surveys by Beuther et al. (2002) and Mueller et al. (2002) are given for comparison. The noted interval limits refer to the smallest and largest mean ring radii.
| IRAM | IRAM | IRAM | JCMT | JCMT | JCMT | |
|---|---|---|---|---|---|---|
| r | [, ] | [, ] | [, ] | [, ] | [, ] | [, ] |