Properties of five low-contrast open clusters in the third quadrant
We derive photometric, structural and dynamical evolution-related parameters of five as yet unstudied low-contrast open clusters located in the third quadrant using 2MASS data. The target clusters are Czernik 31, Czernik 32, Haffner 9, Haffner 11 and Trumpler 13. We apply a statistical field-star decontamination procedure to infer on the intrinsic colour-magnitude diagram (CMD) morphology which is critical for such low-contrast objects. Consequently, it became possible to derive accurate reddening, age, distance from the Sun and Galactocentric distance for the five clusters. In the structural and luminosity/mass-function analyses we apply a colour-magnitude filter which encompasses the cluster evolutionary CMD sequences and excludes stars with discrepant colours. Using this procedure we derive core and limiting radii, mass function (MF) slope, total mass, mass density and relaxation time. We derive ages in the range 140 – 1 100 Myr, Galactocentric distances within 7.7 – 11.4 kpc, and total masses within 360–2 900 . Reflecting large-scale mass segregation, the MF slope in the core is significantly flatter than that in the halo of the five clusters. Although some of the present clusters are relatively younger than the Gyr-old clusters, they present evidence of advanced dynamical evolution. This kind of study has become possible because of the photometric uniformity and spatial coverage of 2MASS which allows a proper subtraction of the field-star contamination on the target CMDs. The present study indicates that low-contrast clusters can be studied with 2MASS, particularly after field-star subtraction, which is important since most of the unstudied open clusters belong to this class.
Key Words.:
(Galaxy:) open clusters and associations: general; Galaxy: structure1 Introduction
Open clusters are formed in and are distributed throughout the Galactic disk. Subsequent interactions with the disk associated with the relentless tidal pull of the Galactic center/bulge drive their dynamical evolution and tend to destroy the less-massive ones in a time-scale of a few (Bergond, Leon, & Guibert Bergond2001 (2001)). Those surviving to older ages may reach greater vertical distances into the thick disk. Consequently, photometric, structural and dynamical parameters of open clusters turn out to be excellent probes of the Galactic structure, star-formation processes and evolution (e.g. Lyngå Lynga82 (1982); Janes & Adler JA82 (1982); Friel Friel95 (1995)). The dynamical evolution of open clusters has been investigated using N-body codes (e.g. de la Fuente Marcos delaF98 (1998)) and through the determination of a set of observational parameters (Bonatto, Bica, & Santos Jr. BBS2005 (2005); Bonatto & Bica BB2005 (2005)).
In Galactic structure studies it is fundamental to have as complete a census of the open clusters as possible, since their spatial distribution can be used to better constrain theoretical mass models of the Galaxy. However, since Janes & Adler (JA82 (1982)) the number of open clusters with derived parameters (reddening, age and distance from the Sun) increased from 434 to 631, taking as reference the clusters currently with parameters in the WEBDA111http://obswww.unige.ch/webda open cluster database (Mermilliod Merm1996 (1996)). In the recent revision of open clusters Dias et al. (Dias2002 (2002)) report a total of 1537 clusters catalogued. There is a need to explore this majority of unstudied clusters.
In recent years the 2MASS222The Two Micron All Sky Survey, All Sky data release (Skrutskie et al. 2mass1997 (1997)), available at http://www.ipac.caltech.edu/2mass/releases/allsky/ database has proven to be a fundamental tool in the analysis of open clusters with different brightness and contrast. The 2MASS Point Source Catalogue (PSC) is uniform, reaching relatively faint magnitudes and covering nearly all the sky, allowing a proper field-star definition both for low-contrast clusters and those with large angular sizes. We mention the discovery and analysis of two faint open clusters in Cygnus (Bica, Bonatto, & Dutra BBD2003 (2004)) and three in other parts of the sky (Bonatto, Bica & Dutra BBD2004 (2004)) using 2MASS photometry. In Bonatto & Bica (BB2005 (2005)) we used 2MASS to obtain a homogeneous set of parameters, compare dynamical states and derive mass functions (MFs) for 11 relatively populous, nearby open clusters.
Considering the above we decided to study five open clusters in the third quadrant using 2MASS data and the techniques outlined in Bonatto & Bica (BB2005 (2005)). Because the present sample is composed of low-contrast clusters (Sects. 3 and 4) we include in the analysis an algorithm to statistically decontaminate the observed CMDs of Galaxy (field) stars to better define the CMD morphology. This step is essential to unambiguously separate low-contrast open clusters from fluctuations in field-star counts. In addition, colour-magnitude filters encompassing the cluster evolutionary CMD sequences are subsequently used in the structural and luminosity/mass-function analyses.
For the present clusters we derive the age, reddening, distance from the Sun, Galactocentric distance, core and limiting radii, mass and density, MF slope and relaxation time. We derive parameters for the cluster as a whole as well as the core and halo subsystems. Besides the interest in obtaining parameters of as yet unstudied clusters, this paper represents a test of the limits of 2MASS (and our techniques) when dealing with more distant, low-contrast, low-Galactic latitude clusters.
Uncertainties throughout this paper correspond to Poisson statistics.
This paper is organized as follows. In Sect. 2 we present the sample and show XDSS R images of the clusters. In Sect. 3 we present the 2MASS photometric parameters and introduce the field-star decontamination procedure. In Sect. 4 we analyze the spatial structure of the clusters. In Sect. 5 we derive the mass functions and discuss stellar content properties. In Sect. 6 we compare the present clusters with nearby, populous open clusters which span a range of dynamical states. Concluding remarks are given in Sect. 7.
2 The third quadrant (3Q) open cluster sample
The clusters selected for the present study are Czernik 31 (OCl-625, ESO 560SC 3), Czernik 32 (Ki 24, OCl-683, BH 11, ESO 494SC 20), Haffner 9 (OCl-600), Haffner 11 (OCl-657, BH 3, ESO 429SC 3, and Trumpler 13 (Cr 219, OCl-815, BH 94, ESO 127SC 17). Additional designations above are from Alter, Ruprecht & Vanisek (Alter1970 (1970)), Lauberts (lau82 (1982)), and van den Bergh & Hagen (BH75 (1975)). In what follows we will use the acronyms Cz, Haf and Tr to refer to the clusters. For simplicity we will refer to the present clusters as the 3Q sample.
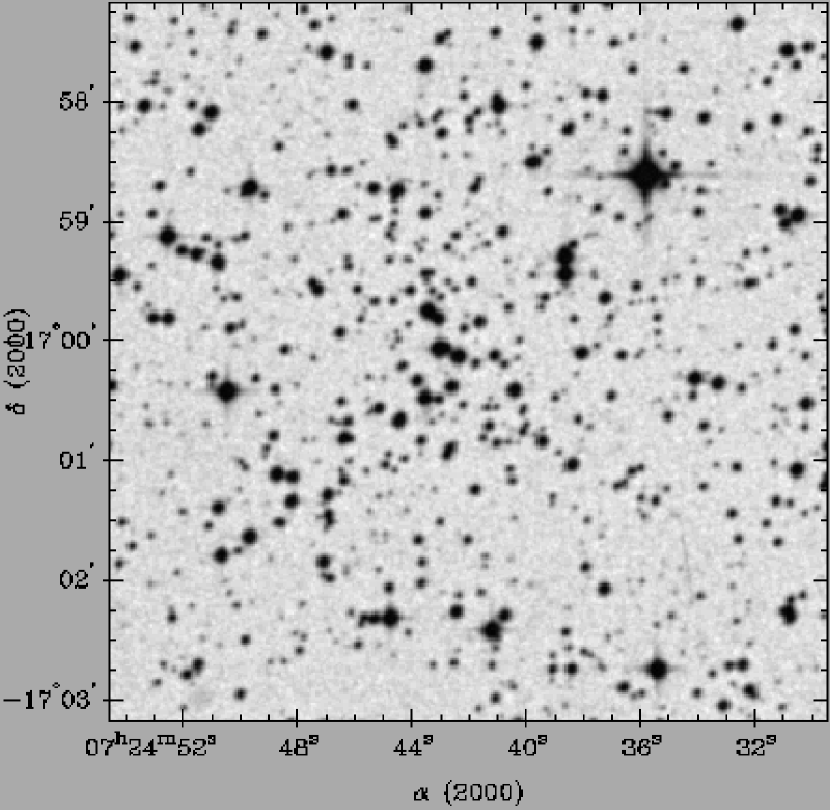
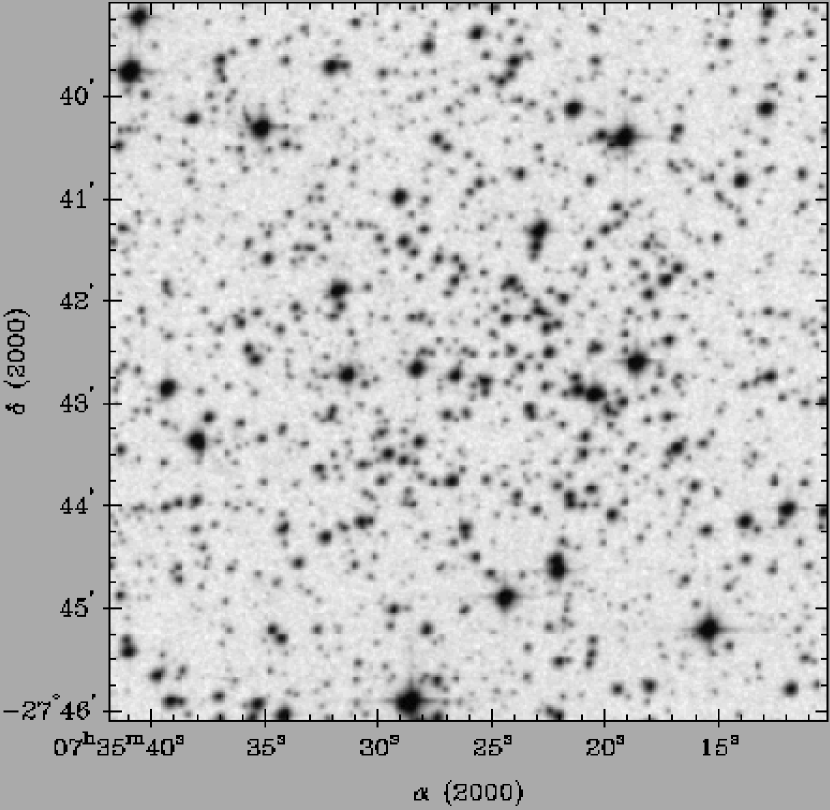
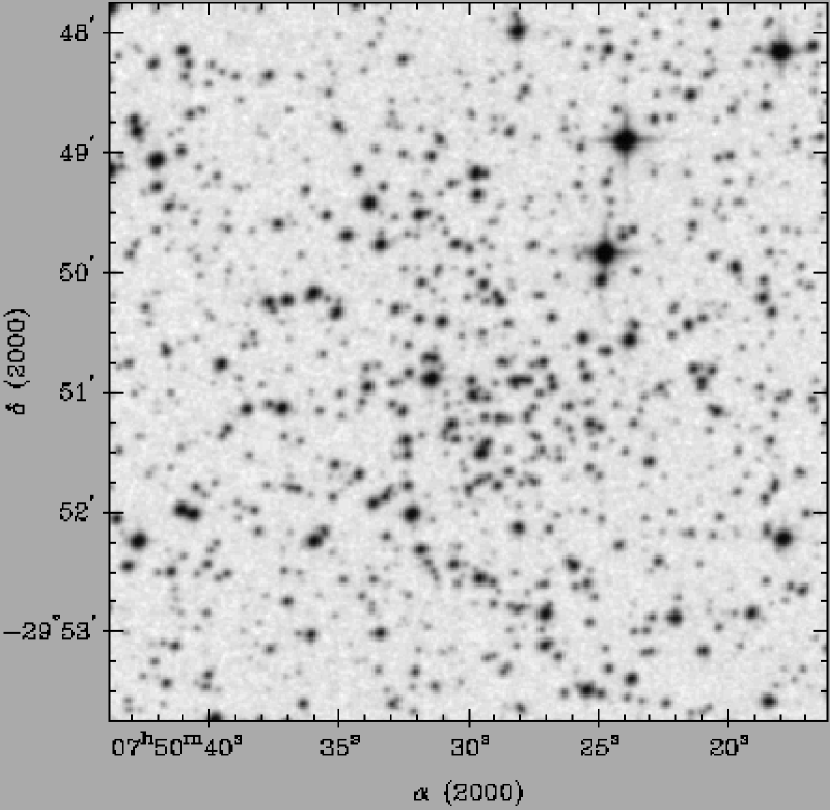
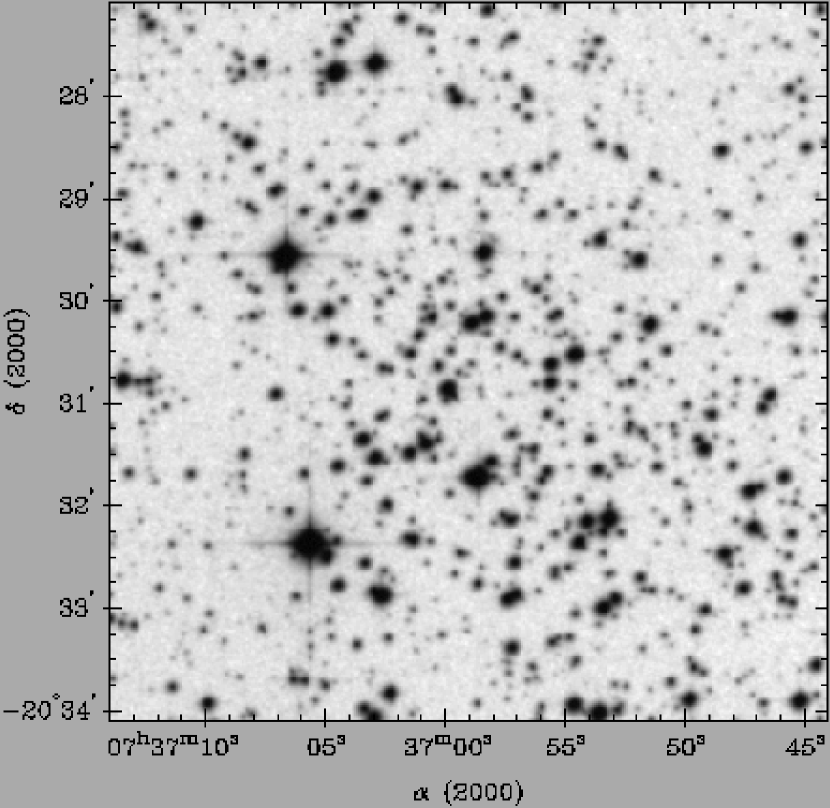
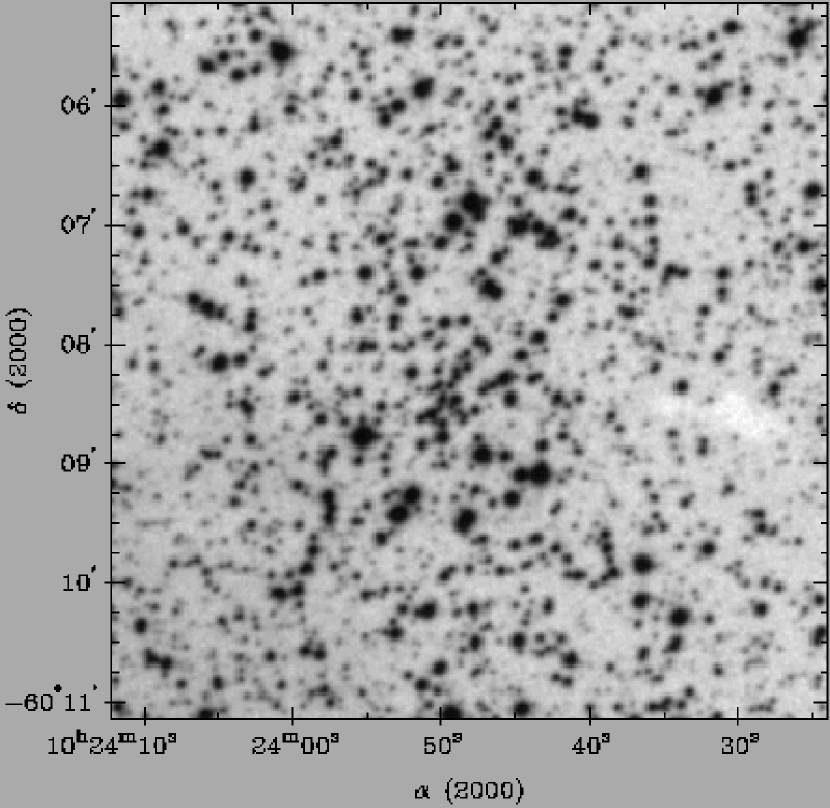
In Figs. 1 and 2 we present XDSS R images of the clusters in the 3Q sample. DSS and XDSS images can be extracted from the Canadian Astronomy Data Centre (CADC333http://cadcwww.dao.nrc.ca/). In all panels a central concentration of stars with varying star-density contrast with respect to the background can be seen.
Accurate central coordinates are fundamental for the photometric, and primarily structural, analysis of open clusters. This is particularly critical in the derivation of the core radius and mass of small clusters (see e.g. Bonatto & Bica BB2005 (2005)). For the 3Q sample clusters we indicate in Table 1 different sources of coordinates. The original Alter, Ruprecht & Vanisek (Alter1970 (1970)) coordinates (1st line for each cluster in Table 1) are not accurate enough for the present purposes of deriving core, halo and overall parameters. Consequently we measured in the DSS and XDSS images more precise optical centers for each cluster. Figs. 1 and 2 are centered on these coordinates.
3 The 2MASS photometry and near-infrared CMDs
The VizieR444http://vizier.u-strasbg.fr/viz-bin/VizieR?-source=II/246 tool was used to obtain , and 2MASS photometry. The central coordinates corresponding to the density peaks in the 2MASS photometry of each cluster were derived by examining histograms of the number of stars in 0.5′ bins of right ascension and declination. In what follows we refer to the coordinates that maximize the density of stars (Sect. 4) at as the cluster center. These central coordinates are given in columns 2 and 3 of Table 1. In a few cases the central coordinates are slightly shifted with respect to the optical centers (Figs. 1 and 2). For each cluster we extracted photometry of the stars contained in a circular area with radius (column 7 of Table 1) centered on the respective central coordinates.
Because of the relatively low Galactic latitudes of the 3Q sample clusters (column 5 of Table 1), the target fields present significant field-star contamination, mostly from disk stars. The relative amount of this contamination with respect to the central field turns out to be important in the identification and analysis of small and/or poor open clusters. To illustrate the relative contribution of the field stars with respect to varying spatial areas we show in the left panels of Figs. 3 to 7 the CMDs of the target clusters in two different extractions. The corresponding (same area) offset fields are shown in the middle panels. The smaller extraction (panels (a)) is that maximizing the CMD density contrast with respect to the offset field. The smaller radius corresponds to about the core radius (, Sect. 4). The radius of the larger extraction (panels (b)) is intermediate between that of the smaller extraction and the limiting radius (, Sect. 4). The offset fields were built with the stars in rings more external than the limiting radius.
The cluster CMDs contrast in morphology and density with respect to the offset fields, although field-star contamination in some cases is important, e.g. Cz 31 and Cz 32. To minimize the visual effect of the field stars on the cluster CMDs we applied a decontamination procedure which considers two different approaches for field-star subtraction: (i) absolute counts and (ii) nearest-neighbour density counts. In case (i) the algorithm divides the CMD in boxes of dimensions and , both for the cluster and offset field. The effective number of cluster stars in a given CMD box corresponds to the absolute difference in the number of cluster and offset-field stars. After this step the algorithm randomly excludes from each cluster CMD box the required number of stars; boxes resulting with a negative number of stars are left blank. In case (ii) we calculate the star density in CMD boxes with dimensions and . The observed star density in a given box corresponds to the average number of stars in it and the 1st, 2nd and 3rd-neighbouring row and columns, both for the cluster and offset-field regions. Subtraction of the observed offset-field density from that of the cluster yields the effective cluster star density in each CMD box. Multiplying the ratio of the effective/observed star density by the observed number of stars yields the effective number of cluster stars in a given CMD box. From this point on the algorithm proceeds as in approach (i) to exclude stars in each CMD box. Comparison of the resulting decontaminated CMDs with a variety of offset fields indicated that the best results were obtained with approach (ii), probably because it is less sensitive to field-star count fluctuations than approach (i). To maximize the statistical representativity of the field-star counts we consider as offset field the region . The ratio between the cluster and offset-field spatial areas is considered when we calculate the respective number (or density) of stars. Approach (i) is similar to that used by Kerber & Santiago (KS05 (2005)), and (ii) is similar to Mighell et al. (MRSF96 (1996)).
The resulting field-star decontaminated CMDs are shown in the right panels of Figs. 3 to 7. The decontaminated CMDs are cleaner than the observed ones (left panels) and present morphologies typical of open clusters of different ages. In particular the giant clumps of Haf 11 (Fig. 4) and Cz 32 (Fig. 5) show up in the respective CMDs which in turn helps constrain their ages and distances from the Sun. The field-star decontaminated CMDs are used to better define the intrinsic CMD morphology and isochrone fit.
| Object | z | Age | Scale | |||||||||||
|---|---|---|---|---|---|---|---|---|---|---|---|---|---|---|
| (h:m:s) | (pc) | (′) | (Myr) | (mag) | (mag) | (mag) | (kpc) | (pc/′) | (kpc) | |||||
| (1) | (2) | (3) | (4) | (5) | (6) | (7) | (8) | (9) | (10) | (11) | (12) | (13) | (14) | (15) |
| Haf 9† | 07:24:30 | -17:00 | ||||||||||||
| Haf 9 | 07:24:42.0 | -17:00:10.0 | 30 | 3.1 | 1.78 | |||||||||
| Haf 11† | 07:35:24 | -27:44 | ||||||||||||
| Haf 11 | 07:35:30.0 | -27:41:58.6 | 40 | 1.1 | 0.66 | |||||||||
| Cz 32† | 07:50:24 | -29:50 | ||||||||||||
| Cz 32 | 07:50:30.0 | -29:50:45.0 | 30 | 1.4 | 0.85 | |||||||||
| Cz 31† | 07:36:48 | -20:30 | ||||||||||||
| Cz 31 | 07:36:59.0 | -20:30:35.0 | 50 | 3.2 | 1.53 | |||||||||
| Tr 13† | 10:23:48 | -60:05 | ||||||||||||
| Tr 13 | 10:23:49.2 | -60:07:32.5 | 15 | 2.8 | 1.41 |
-
Col. 6: distance to the Galactic plane. Col. 7: Extraction radius of the 2MASS photometry. Col. 8: Observed contrast parameter . Col. 9: Best-fit isochrone age. Col. 10: Colour-excess resulting from the isochrone fit. Col. 11: intrinsic distance modulus. Col. 12: faint-absolute magnitude limit of the stars in the radial-density profiles. Col. 13: distance from the Sun. Col. 14: parsec to arcmin scale. Col. 15: Galactocentric distance. : coordinates from Alter et al. (Alter1970 (1970)).
Photometric parameters were derived by means of solar metallicity Padova isochrones (Girardi et al. Girardi2002 (2002)) computed with the 2MASS , and filters555http://pleiadi.pd.astro.it/isoc_photsys.01/isoc_photsys.01.html, fitted to the field-star decontaminated CMDs of the central cluster regions in Figs. 3 to 7 (right panels). The 2MASS transmission filters produced isochrones very similar to the Johnson ones, with differences of at most 0.01 in (Bonatto, Bica & Girardi BBG2004 (2004)). For reddening and absorption transformations we use , and the relations and , according to Dutra, Santiago & Bica (DSB2002 (2002), and references therein). 2MASS photometric uncertainties as a function of magnitude are discussed in Soares & Bica (SB2002 (2002)) and Bonatto, Bica & Santos Jr. (BBS2005 (2005)).
Taking into account the uncertainties associated with the isochrone fit we derive for each cluster in the 3Q sample the age (column 9 in Table 1) colour excess and the corresponding (column 10), the absolute distance modulus (column 11) and the distance from the Sun (column 13). The Galactocentric distance (column 15) was calculated using 8.0 kpc as the distance of the Sun to the center of the Galaxy (Reid Reid93 (1993)). The resulting isochrone fits are shown in the field-star decontaminated CMDs (right panels of Figs. 3 to 7).
3Q cluster ages are (Haf 9), (Cz 31), (Tr 13), (Haf 11) and (Cz 31). Except for Cz 31, the remaining clusters in the 3Q sample are considerably reddened with . They are distant from the Sun with and, except for Tr 13, the remaining 3Q clusters are located outside the Solar circle.


The relatively low-contrast nature of the clusters in the 3Q sample is apparent in the XDSS R images (Figs. 1 and 2) and is reflected in the low values of the observed contrast parameter (column 8 of Table 1). represents the ratio of the number of stars in the cluster region with respect to that (same area) in the offset field. Additional clues to their nature as open clusters are (i) the cluster-like field-star decontaminated CMD morphology and isochrone fits (Figs. 3 to 7), (ii) the King-like radial-density profiles (Sect. 4), and (iii) the resulting MFs (Sect. 5).
4 Cluster structure
Structural parameters of the 3Q clusters were derived by means of the radial density profile, i.e. the projected number of stars per area around the cluster center. Before counting stars we applied the colour-magnitude filters (dashed line in the right panels of Figs. 3 to 7) to the observed CMDs to discard stars with discrepant colours (mostly Galactic field stars) and maximize cluster membership. This filtering procedure was previously applied in the analysis of the open clusters M 67 (Bonatto & Bica BB2003 (2003)), NGC 188 (Bonatto, Bica & Santos Jr. BBS2005 (2005)) and NGC 3680 (Bonatto, Bica & Pavani BBP2004 (2004)). This procedure minimizes the probability of field-star contamination, spurious detections and the increase of photometric uncertainties at faint magnitudes. We give in column 12 of Table 1 the resulting absolute faint-magnitude () limit of the stars included in each radial-density profile.
The radial density profiles were obtained by counting stars inside concentric annuli with steps of 1.0′ (Cz 31 and Haf 11) and 0.5′ (Cz 32, Haf 9 and Tr 13) in radius. In each case the field-star contribution level corresponds to the average number of stars included in the outermost ring.
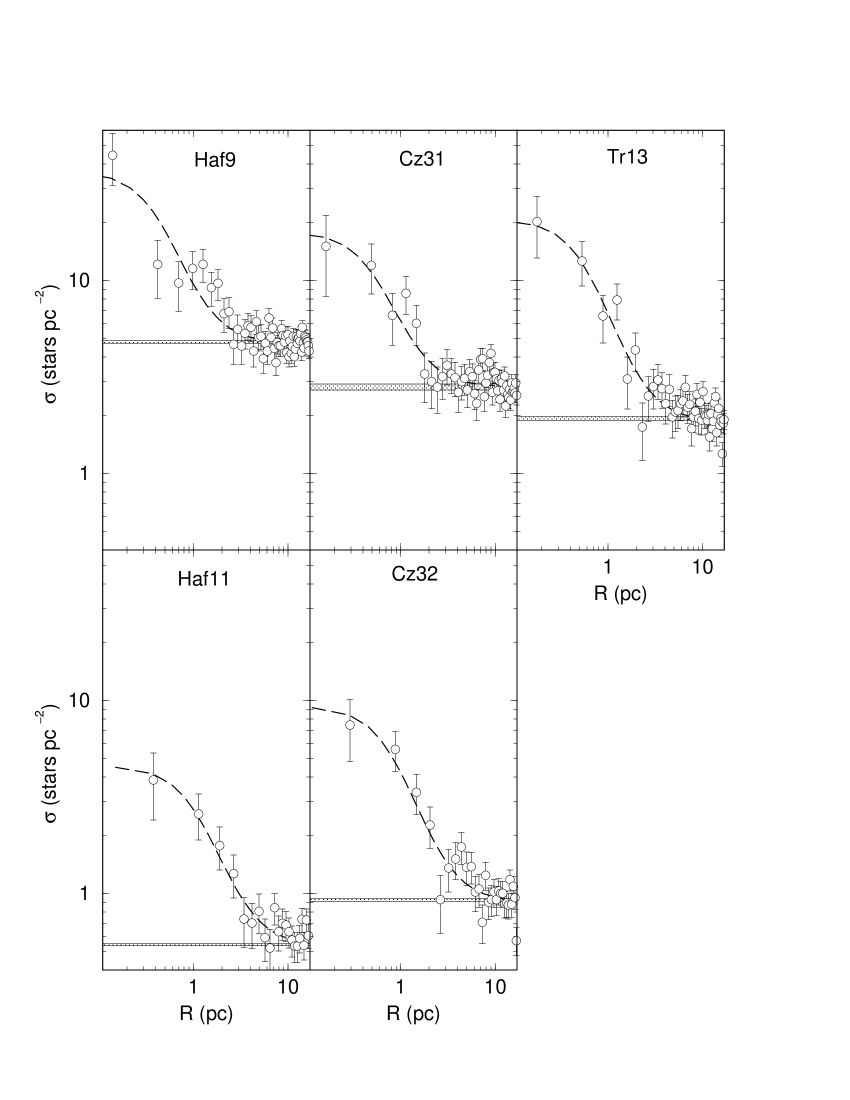
The resulting radial density profiles are shown in Fig. 8. For absolute comparison between clusters we scale the radius in the abscissa in parsecs, and the number density of stars in the ordinate in using the distances derived in Sect. 3. The statistical significance of each profile is reflected in the Poisson error bars. The cluster limiting radius () can be estimated considering the fluctuations in the radial density profile with respect to the field stars. In this sense, corresponds to the region where the density profile merges with the background. For regions beyond the null-contrast between cluster and field-star density would produce prohibitive Poisson errors and meaningless results. For practical purposes the bulk of the cluster stars are contained within . The tidal radius derived from the three-parameter King (King1962 (1962)) profile can only be obtained for much more populated open clusters, such as e.g. NGC 188, M 67, NGC 2477 and M 26 (Bonatto & Bica BB2005 (2005)).
Cluster structural parameters were derived by fitting the two-parameter King (1966a ) surface density profile to the background-subtracted radial distribution of stars. The two-parameter King model essentially describes the intermediate and central regions of normal clusters (King 1966b ; Trager, King & Djorgovski TKD95 (1995)). The fit was performed using a nonlinear least-squares fit routine that uses the errors as weights. The best-fit solutions are shown in Fig. 8 superimposed on the respective radial density profiles. The King profile provides a good representation of the radial distribution of stars in all clusters in the 3Q sample, which reinforces their open cluster nature. Since it follows from an isothermal (virialized) sphere, the close similarity of the radial distribution of stars with a King profile suggests that the internal structure of the clusters (particularly the core) have already reached some significant level of dynamical evolution. We will return to this point in Sects. 5.1 and 6. The structural parameters are given in Table 2.
| Object | |||||
|---|---|---|---|---|---|
| (pc) | (pc) | ||||
| (1) | (2) | (3) | (4) | (5) | (6) |
| Haf 9 | |||||
| Haf 11 | |||||
| Cz 32 | |||||
| Cz 31 | |||||
| Tr 13 |
-
The background stellar density (col. 2) was measured in the outermost ring. The central density (col. 3) and core radius (col. 5) were derived from the King fit, . Col. 4: density contrast parameter . The limiting radius (col. 6) was estimated directly from the density profiles.
We quantify the cluster/background star-density contrast by means of the parameter (column 4), defined as the ratio of the central density () to that of the background (). The values in Table 2 can be compared to those of the rather populous and high-Galactic latitude open clusters (Bonatto & Bica BB2005 (2005)) NGC 188 (; kpc; ) with , and M 67 (; kpc; ) with , and that of the populous and rather low-latitude cluster NGC 2477 (; kpc; ) with . The determination of the density contrast parameter seems to depend more on the Galactic latitude than cluster mass. Because the 3Q sample is composed of low-latitude clusters their contrast parameters are significantly lower than those of the comparison clusters but higher than the observed ones (, col. 8 of Table 1). As a consequence, some underestimation of the limiting radii can be expected in most of the clusters studied in the present paper. Deeper wide-field photometry would be important to check this possibility.
5 Mass functions
Based on the King profile fits we decided to derive MFs for the core, halo and overall regions. As offset field we consider the region from to (Table 1), which provides statistical representativity in terms of background distribution of stellar luminosities (and mass), as shown in Bonatto, Bica & Santos Jr. (BBS2005 (2005)) and Bonatto & Bica (BB2005 (2005)).
In the case of low-latitude clusters it is essential that the Galactic field contamination of the CMDs is properly taken into account in order to derive the intrinsic luminosity and mass distributions of the member stars. To do this we first apply the colour-magnitude filter (right panels of Figs. 3 to 7) to both cluster and offset field CMDs. The filtering process takes into account most of the background, leaving a residual contamination. We deal with this residual contamination statistically by building the luminosity functions (LFs) for each cluster region and offset field. The three 2MASS bands are treated independently, taking into account the 99.9% PSC Completeness Limit666Corresponding to the Level 1 Requirement, according to http://www.ipac.caltech.edu/2mass/releases/allsky/doc/sec6_5a1.html. Consequently, the faint magnitude limit of each LF is , and , respectively. We take the turnoff as the bright limit to avoid inconsistencies in the mass-luminosity relation. For each 2MASS band we build a LF by counting stars in magnitude bins from the respective faint magnitude limit to the turnoff, both for each cluster region and offset field. Considering that the solid angle of the offset field is different from that of a given cluster region, we multiply the offset field LF by a numerical factor so that the solid angles match. The intrinsic LF of each cluster region is obtained by subtracting the respective (i.e. solid angle-corrected) offset-field LF from that of the cluster region. Finally, the intrinsic LFs are transformed into MFs using the mass-luminosity relation obtained from the respective Padova isochrone and distance modulus (Sect. 3). These procedures are repeated independently for the three 2MASS bands (Bonatto & Bica BB2005 (2005)). The final MF of a given cluster region is produced by combining the , and MFs into a single MF. The resulting core and overall MFs of the 3Q sample clusters are shown in Fig. 9.
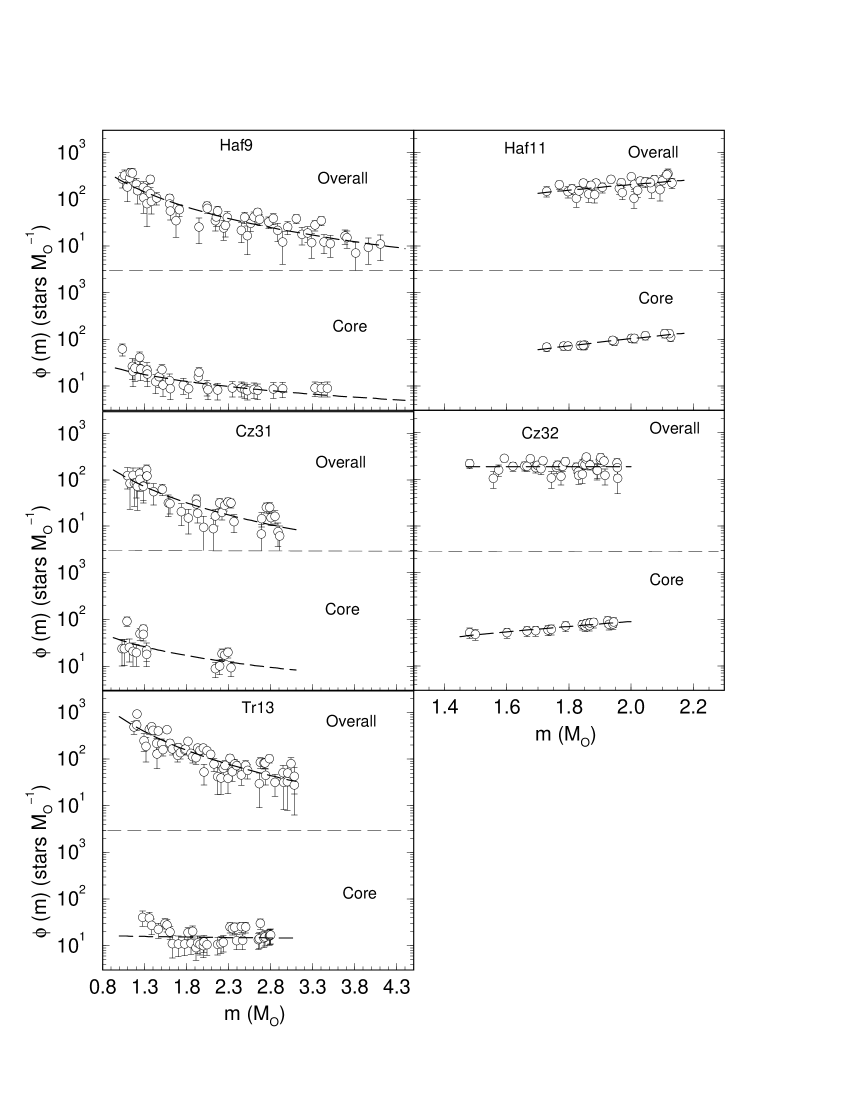
We provide in Table 3 parameters derived from the LFs and MFs for the core (), halo () and overall () regions. The number of evolved stars (column 3) is calculated by integrating the intrinsic LFs for magnitudes brighter than the turnoff. Multiplying this by the mass at the turnoff gives an estimate of the evolved-star mass (column 4). This procedure produces a realistic value of the number of member evolved stars because the background contamination was statistically subtracted from the LF. The observed main sequence (MS) mass range is in column 5. The MF slope of the MS stars is in column 6. The core MFs are significantly flatter than halo MFs (see also Sect. 5.1). The number of MS stars and corresponding mass are derived by integrating the MF from the faint magnitude limit to the turnoff. We add to these the corresponding values of the number and mass of evolved stars to derive the total number of observed stars (column 7) and observed mass (column 8).
The large distances from the Sun of the clusters in the 3Q sample preclude detection of sub-Solar mass stars. However, an estimate of the total mass locked up in MS stars can be made by taking into account all stars from the turnoff down to the H-burning mass limit, , assuming the universal IMF of Kroupa (Kroupa2001 (2001)), in which for the range and for . For the cases where the present value of is smaller or of the same order than Kroupa’s we extrapolate our MFs. The resulting extrapolated values of the number of stars and extrapolated mass (added to the corresponding values for the evolved stars) are given respectively in cols. 9 and 10 of Table 3. We also give in cols. 11 and 12 the projected and volume mass densities, respectively.
| Evolved | MS | Observed+Evolved | Extrapolated+Evolved | ||||||||
| OC | Region | N∗ | |||||||||
| (Stars) | () | () | (stars) | () | (stars) | () | () | () | |||
| (1) | (2) | (3) | (4) | (5) | (6) | (7) | (8) | (9) | (10) | (11) | (12) |
| Core | 1.0–3.5 | ||||||||||
| Haf 9 | Halo | 1.0–4.1 | |||||||||
| Overall | 1.0–4.1 | ||||||||||
| Core | 1.7–2.0 | ||||||||||
| Haf 11 | Halo | 1.7–2.1 | |||||||||
| Overall | 1.7–2.1 | ||||||||||
| Core | 1.5–2.0 | ||||||||||
| Cz 32 | Halo | 1.5–2.0 | |||||||||
| Overall | 1.5–2.0 | ||||||||||
| Core | 1.1–2.3 | ||||||||||
| Cz 31 | Halo | 1.1–2.9 | |||||||||
| Overall | 1.1–2.9 | ||||||||||
| Core | 1.3–2.8 | ||||||||||
| Tr 13 | Halo | 1.2–3.1 | |||||||||
| Overall | 1.2–3.1 | ||||||||||
-
The number and mass of the evolved stars in cols. 3 and 4, respectively were derived from the LFs. Col. 5: MS mass range over which the MF was fitted. Col. 6: MF slope in the MS.
5.1 Considerations on dynamical states
Mass segregation in a star cluster scales with the relaxation time, defined as , where is the crossing time, is the total number of stars (col. 9 of Table 3) and is the velocity dispersion (Binney & Tremaine BinTre1987 (1987)). is the characteristic time scale in which a cluster reaches some level of kinetic energy equipartition with massive stars sinking to the core and low-mass stars being transferred to the halo. We assume a typical velocity dispersion of (Binney & Merrifield Binney1998 (1998)). Core and overall relaxation times are given in cols. 3 and 5 of Table 4, respectively. However, since the dynamical evolution depends strongly on age and cluster mass (Bonatto & Bica BB2005 (2005), and references therein), it is better characterized by the dynamical-evolution parameter . The presence of mass segregation and consequently some degree of MF slope flattening in the cores of the clusters in the 3Q isample consistent with the large values of (Bonatto & Bica BB2005 (2005)).
Considering the slope uncertainties, the overall MFs of Haf 9 and Cz 31 are similar to a standard Salpeter (Salp55 (1955)) IMF (), while the MF of Tr 13 is steeper. The flat MFs of Haf 11 and Cz 32 may be affected by the restricted observed MS mass range ( and , respectively) owing to the large distances from the Sun (5.2 kpc and 4.0 kpc, respectively). In all cases the core MF resulted significantly flatter than that in the halo, which reflects the effects of large-scale mass segregation. All these pieces of evidence point to advanced dynamical states, especially in the cores of the 3Q sample clusters.
| Core | Overall | |||
| Object | ||||
| (Myr) | (Myr) | |||
| (1) | (2) | (3) | (4) | (5) |
| Haf 9 | ||||
| Haf 11 | ||||
| Cz 32 | ||||
| Cz 31 | ||||
| Tr 13 | ||||
-
The dynamical-evolution parameter in cols. 3 and 5 is defined as .
6 Comparison with open clusters in different dynamical-evolution states
We compare the 3Q sample clusters with the 631 WEBDA open clusters with parameters (Sect. 1) in terms of Galactic longitude and latitude, distance from the Sun and age. A similar analysis of 13 open clusters studied by means of integrated spectra, using reddening and age histograms was carried out by Ahumada et al. (Ahumada01 (2001)).
Galactic longitude and latitude distributions of the WEBDA sample are shown in panels (a) and (b) of Fig. 10, respectively. The clusters are rather uniformly distributed in with a slight excess towards the third quadrant, where the present clusters are located. This excess probably reflects an observational bias in the sense that low-contrast clusters are more easily detected towards regions avoiding the Galactic center and bulge. Alternatively, the excess may reflect a higher probability of cluster dissolution towards the Galactic center (e.g. Bergond, Leon, & Guibert Bergond2001 (2001)). In Galactic latitude the majority of the WEBDA clusters are tightly projected close the Galactic disk, as does also the 3Q sample.
The distribution of the WEBDA open clusters with known distance from the Sun is shown in panel (c) of Fig. 10, where the distribution peaks at . Differently from the WEBDA sample, the 3Q sample clusters distribute rather uniformly in the range to .
The age distribution of the WEBDA open clusters (panel (d)) presents 2 peaks at Myr and Myr. The 3Q sample clusters distribute rather uniformly in age.
We conclude that the 3Q sample is not atypical compared to the WEBDA sample.

The parameters derived in the previous sections are used to check how the 3Q sample clusters fit in the context of nearby open clusters characterized by different ages and dynamical states. Bonatto & Bica (BB2005 (2005)) presented a systematic analysis of a set of 11 nearby open clusters with distances from the Sun in the range 0.4 – 1.7 kpc, ages from 70 Myr to 7 Gyr and total masses from 400 to 5 300 . These nearby clusters are M 26 (NGC 6694), NGC 2516, NGC 2287 (M 41), M 48 (NGC 2548), M 93 (NGC 2447), NGC 5822, NGC 2477, NGC 3680, IC 4651, M 67 (NGC 2682) and NGC 188. The relatively high-Galactic latitude and rather populous nature of these clusters make them potential sources of accurate intrinsic open cluster parameters. As a result, a set of uniform parameters related to the structure (core and overall radii, mass and density), dynamical state (core and overall MF slopes, dynamical-evolution parameter ), as well as age and Galactocentric distance of open clusters was obtained. Some correlations among these parameters were verified, and a separation of massive () and less-massive () clusters was observed in some diagrams. The methodology used to derive parameters of the 3Q sample clusters follows the same lines as that used in Bonatto & Bica (BB2005 (2005)).
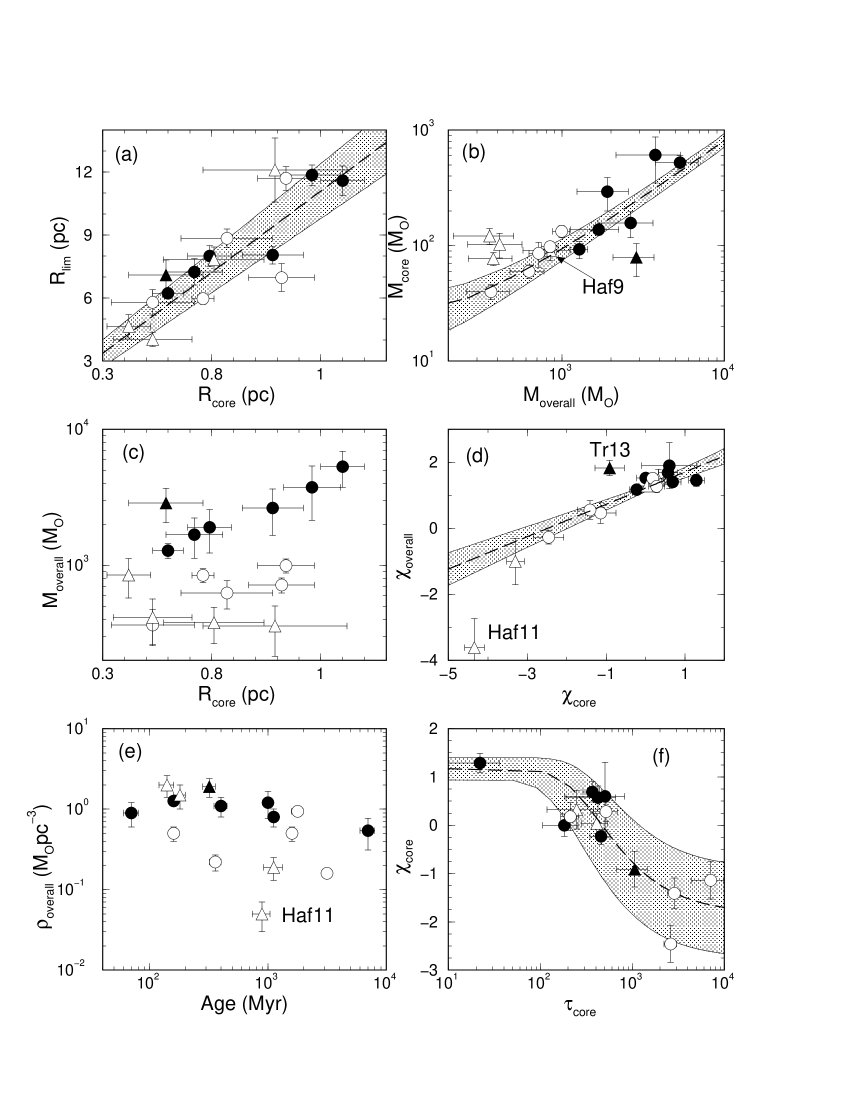
In Fig. 11 we compare the 3Q sample clusters with those in the nearby cluster set in terms of structural and dynamical-evolution parameters. We include in panels (a), (b), (d) and (f) the least-squares fits (and the borders) of parameter relations derived for the nearby clusters in Bonatto & Bica (BB2005 (2005)).
Within uncertainties the 3Q sample clusters fit well in the relation involving core and limiting radii (panel (a)). In this case the least-squares fit is given by , with a correlation coefficient , using the reference sample.
In the relation involving core and overall mass (panel (b)) the 3Q sample clusters fall slightly off the border of the comparison sample relation, except for Haf 9 which fits in it. The least-squares fit is , with .
Within the uncertainties the separation observed among the massive and less-massive nearby clusters (panel (c)) can be extended to the 3Q sample clusters.
In the plot (panel (d)) Tr 13, and especially Haf 11, deviate from the relation. In this case the least-squares fit is , with .
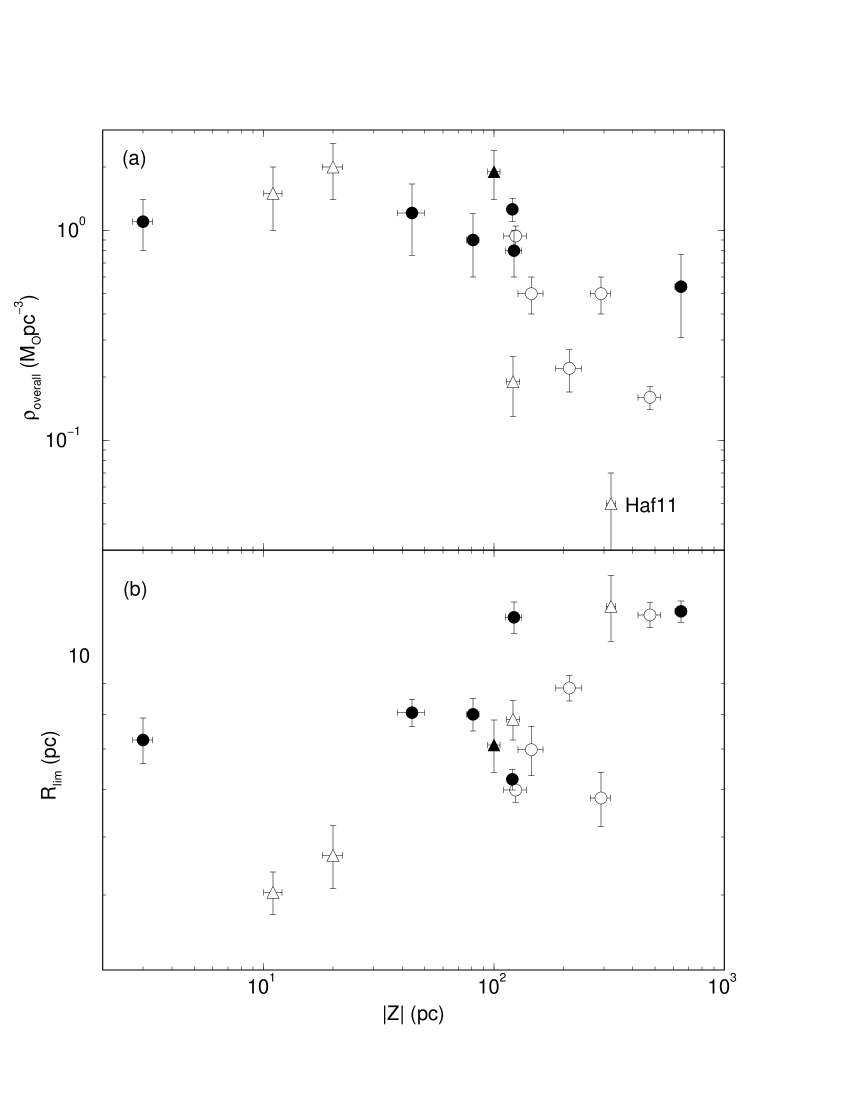
Compared to the nearby clusters of the same age range Haf 11 seems to present an exceedingly low overall density (panel (e)), which might indicate an underestimation of the overall mass. This effect may be accounted for observationally by the relatively large distance from the Sun and low latitude of Haf 11 (Sect. 5.1).
Finally, with respect to the core MF slope vs. dynamical-evolution parameter (panel (f)) the least-squares fit is , with . Compared to the nearby cluster set, the cluster cores in the 3Q sample present evidence of important dynamical evolution, such as flat MF slopes and large values of . This happens despite the young age of Haf 9 (), Cz 31 () and Tr 13 () as compared to the nearby open cluster sample. A possible explanation for this evidence of advanced dynamical evolution for open clusters with ages in the range 100 to 400 Myr may be orbital planes closer to the Galactic plane.
The dependence of limiting radius on distance to the plane () occurs for the less-massive clusters, both for the nearby clusters and those in the 3Q sample (bottom panel of Fig. 12). For the massive clusters the dependence of on is less important. In the top panel of Fig. 12 we show the relation of the overall density with . A correlation shows up for the less-massive clusters in the sense that higher- clusters have lower overall densities. However, we note that the limiting radius may be underestimated (Sect. 4). The plots in Fig. 11 (and other parameter relations in Bonatto & Bica BB2005 (2005)) appear to be useful tools in the interpretation of the structure and dynamical states of open clusters.
7 Concluding remarks
In this paper we analyzed 5 low-contrast (observed contrast parameter ) open clusters located in the third quadrant by means of 2MASS photometry. The clusters did not have available parameters in the literature. The present approach involves Colour-Magnitude Diagrams, statistical field-star subtraction, colour-magnitude filters, radial density profiles and luminosity/mass functions built for the core, halo and overall cluster regions. In all cases the CMD morphology resulting from the field-star statistical subtraction is unambiguously characteristic of open clusters of different ages with a well-defined main sequence, turnoff and, for Haf 11 and Cz 32, the presence of a conspicuous giant clump.
We derived reddening values in the range 0.06 to 0.66, ages from 140 Myr to 1.1 Gyr, distances from the Sun from 1.9 to 5.2 kpc, and total masses from 360 to 2 900 . 4 out of the 5 clusters are located up to kpc outside the Solar circle.
By applying the colour-magnitude filter the two-parameter King profile could be fitted to the radial density distribution of all clusters producing core radii in the range and limiting radii in the range . The resulting contrast parameters (after applying the colour-magnitude filter) increase to the range , about 3 times as large as the observed ones.
In all cases the clusters in the 3Q sample present signs of advanced dynamical evolution, such as flat core mass function slopes, large values of the dynamical-evolution parameter, and large-scale mass segregation. This effect occurs despite the relatively young cluster ages in part of the sample (140 to 320 Myr), resembling dynamical states of the nearby Gyr-old clusters (Bonatto & Bica BB2005 (2005)). Proximity to the Galactic plane may have accelerated their dynamical evolution.
We conclude that 2MASS photometry can be used to study the large number of unexplored low-contrast open clusters when associated with statistical field-star decontamination (for CMD morphology and isochrone fit) and colour-magnitude filters (for structure and mass-function analyses).
Acknowledgements.
We thank the anonymous referee for important remarks which improved the paper. This publication makes use of data products from the Two Micron All Sky Survey, which is a joint project of the University of Massachusetts and the Infrared Processing and Analysis Center/California Institute of Technology, funded by the National Aeronautics and Space Administration and the National Science Foundation. We also made use of the WEBDA open cluster database. We acknowledge support from the Brazilian Institution CNPq.References
- (1) Ahumada, A.V., Clariá, J.J., Bica, E., Dutra, C.M. & Torres, M.C. 2001, A&A, 377, 845
- (2) Alter, G., Ruprecht, J., & Vanisek, J. 1970, in Catalogue of Star Clusters and Associations, ed. G. Alter, B. Balázs, & J. Ruprecht
- (3) Bergond, G., Leon, S. & Guibert, J. 2001, A&A, 377, 462
- (4) Bica, E. Bonatto, C.J. & Dutra, C.M. 2003, A&A, 405, 991
- (5) Binney, J., & Tremaine, S. 1987, in Galactic Dynamics, Princeton, NJ: Princeton University Press. (Princeton series in astrophysics)
- (6) Binney, J., & Merrifield, M. 1998, in Galactic Astronomy, Princeton, NJ: Princeton University Press. (Princeton series in astrophysics)
- (7) Bonatto, C.J., & Bica, E. 2005, A&A, 437, 483
- (8) Bonatto, C.J., Bica, E., & Santos Jr., J.F.C. 2005, A&A, 433, 917.
- (9) Bonatto, C.J., Bica, E., & Pavani, D.B. 2004, A&A, 427, 485
- (10) Bonatto, C., Bica, E., & Girardi, L. 2004, A&A, 415, 571
- (11) Bonatto, C., Bica, E. & Dutra, C.M. 2004, A&A, 422, 555
- (12) Bonatto, C., & Bica, E. 2003, A&A, 405, 525
- (13) Dias, W.S., Alessi, B.S., Moitinho, A., & Lépine, J.R.D. 2002, A&A, 389, 871
- (14) Dutra, C.M., Santiago, B.X., & Bica, E. 2002, A&A, 381, 219
- (15) de la Fuente Marcos, R. 1998, A&A, 333, L27
- (16) Friel, E.D. 1995, ARA&A, 33, 381
- (17) Girardi, L., Bertelli, G., Bressan, A., et al. 2002, A&A, 391, 195
- (18) Janes, K. & Adler, D. 1982, ApJS, 49, 425
- (19) Kerber, L. & Santiago, B.X. 2005, A&A, 435, 77
- (20) King, I. 1962, AJ, 67, 471
- (21) King, I. 1966a, AJ, 71, 64
- (22) King, I. 1966b, AJ, 71, 276
- (23) Kroupa, P. 2001, MNRAS, 322, 231
- (24) Lauberts, A. 1982, in ESO/Uppsala survey of the ESO(B) atlas, Garching: European Southern Observatory (ESO)
- (25) Lyngå, G. 1982, A&A, 109, 213
- (26) Mermilliod, J.C. 1996, in The Origins, Evolution, and Destinies of Binary Stars in Clusters, ASP Conference Series, eds. E.F. Milone & J.-C. Mermilliod, 90, 475
- (27) Mighell, K.J., Rich, R.M., Saha, M. & Falls, S.M. 1996, AJ, 111, 2314
- (28) Reid, M.J. 1993, ARA&A, 31, 345
- (29) Salpeter, E. 1955, ApJ, 121, 161
- (30) Soares, J.B. & Bica, E. 2002, A&A, 388, 172
- (31) Skrutskie, M., Schneider, S.E., Stiening, R., et al. 1997, in The Impact of Large Scale Near-IR Sky Surveys, ed. Garzon et al., Kluwer (Netherlands), 210, 187
- (32) Trager, S.C., King, I.R., & Djorgovski, S. 1995, AJ, 109, 218
- (33) van den Bergh, S., & Hagen, G.L. 1975, AJ, 80, 11