The dynamical influence of cooling in the envelope of prestellar and protostellar cores.
We compute numerical simulations of spherical collapse triggered by a slow increase in external pressure. We compare isothermal models to models including cooling with a simple but self-consistent treatment of the coupling between gas, grains and radiation field temperatures. The hydrostatic equilibrium appears to hold past the marginally stable state, until the collapse proceeds. The last hydrostatic state before collapse has a lower central gas temperature in the centre due to the enhanced coupling between gas, grains and radiation field. This results in slightly lower pressure gradients in the bulk of the envelope which is hence slightly more extended than in the isothermal case. Due to the sensitivity of the collapse on these initial conditions, protostellar infall velocities in the envelope turn out to be much slower in the case with cooling.
Our models also compute the radiative transfer and a rather large chemical network coupled to gas dynamics. However, we note that the steady-state chemisorption of CO is sufficient to provide an accurate cooling function of the gas. This justifies the use of post-processing techniques to account for the abundance of observed molecules.
Existing observations of infall signatures put very stringent constraints on the kinematics and temperature profile of the class 0 protostar IRAM 04191+1522. We show that isothermal models fail to account for the innermost slow infall motions observed, even with the most hydrostatic initial conditions. In contrast, models with cooling reproduce the general shape of the temperature profile inferred from observations and are in much better agreement with the infall signatures in the inner 3000 AU.
Key Words.:
Stars: formation ; ISM: kinematics and dynamics ; ISM: prestellar and protostellar cores1 Introduction
We revisit here the numerical work of Larson (1969), Masunaga et al. (1998) and Masunaga & Inutsuka (2000) to probe the influence of cooling and chemistry on the collapse of protostellar and prestellar dense cores. We compare our results to observations of a Class 0 protostar, i.e., a collapsing protostellar core so young that it still retains a detailed picture of its initial conditions (André et al. 1999).
Isothermal studies of spherical collapse have focused on self-similar solutions (Shu 1977; Larson 1969; Bouquet et al. 1985; Blottiau et al. 1988), initial conditions (Foster & Chevalier 1993) and magnetic fields (Basu & Mouschovias 1994; Li 1998).
In contrast, simulations of hydrostatic clouds (De Jong et al. 1980; Boland & De Jong 1984; Chièze & Pineau des Forêts 1987; Nejad & Wagenblast 1999) have paid extreme attention to the energy budget, using accurate models of radiative transfer coupled with complicated chemical networks designed to account for the abundances of the main cooling agents of the interstellar medium. Using more simple thermal models, Galli et al. (2002) have also investigated hydrostatic equilibria near the marginally stable state.
In the present work, we use a similar approach to Masunaga & Inutsuka (2000). We use a simplified treatment of the radiation transfer, which is found to give very similar results. This allows us to spend the CPU time on a more detailed chemical network. We are hence able to model the molecular cooling with a degree of accuracy close to the hydrostatic models. Also, we use a moving grid algorithm which describes the accretion shock with a much better resolution.
The aim of this paper is to show how the use of a more accurate model for the gas and dust microphysics can influence the dynamics of the protostellar collapse. We briefly present isothermal models (Section 2) before comparing them to the results of computations including radiation transfer and using a full chemical network (Section 3). We emphasise the importance of the coupling model between gas and radiation through the grains which allows us to compute a realistic profile for the temperature. This profile is responsible for slightly lower pressure gradients which make the collapse milder than in the isothermal case. We investigate the influence of a few parameters and in particular show that the out-of-equilibrium chemistry has little influence on the cooling of the gas. We finally compare our models to observations of the young low mass class 0 protostar IRAM 04191 (Section 4). We find that isothermal models fail to reproduce the slow observed infall velocities. On the other hand, models with cooling are within the observational uncertainties inside a radius of around 3000 AU. We discuss and sum up our results in sections 5 and 6.
2 Isothermal models
2.1 Initial conditions
We start our collapse calculations from a stable hydrostatic state. We then trigger the gravitational instability by a slow exponential increase of the external pressure . When the critical pressure is reached, the collapse evolves on a few free-fall time scales, until the birth of the protostar. A jump in the mass-to-radius ratio at the centre characterises this particular instant, which we take as the origin of times (as in Foster & Chevalier 1993). In the present work, we refer to times as the prestellar phase and as the protostellar phase, in agreement with the terminology used by most observers. Three parameters specify a simulation : the total mass , the temperature , and the time scale for the pressure increase dd. We use amu for the mean molecular weight .
Because the equations can be put in an adimensional form (Foster & Chevalier 1993) only the parameter is relevant. We chose to fix M⊙ and K as good estimates for the object we plan to compare to (see section 4.2). The free-fall time-scale of the marginal Bonnor-Ebert sphere with these parameters is yr.
2.2 Method
The use of a Lagrangian mesh allows us to easily treat the huge dynamical range in densities and scales involved in the collapse without introducing advection errors. However, it is not able to evolve through the central singularity. We therefore use a moving grid algorithm that keeps the mesh on a logarithmic spacing in radius with a fixed radius for the central zone when it gets below pc. To check this method, we compared our prestellar results with the output of a Lagrangian code. The comparison is worse for the maximum infall velocity which is usually about 10% smaller than in the Lagrangian computation. The collapse outside of the point of maximum infall velocity is reproduced to an accuracy better than 1%. Our protostellar results agree with Foster & Chevalier (1993) to an accuracy better than 5% when we use their initial conditions, i.e. a 10% enhancement of pressure and density compared to the marginally critical Bonnor-Ebert sphere. We note that they do not enhance the pressure in their outer buffer region. Our simulations have also been compared to the slow pressure increase case of Hennebelle et al. (2003) with a satisfactory agreement.
2.3 Supersonic mass fraction
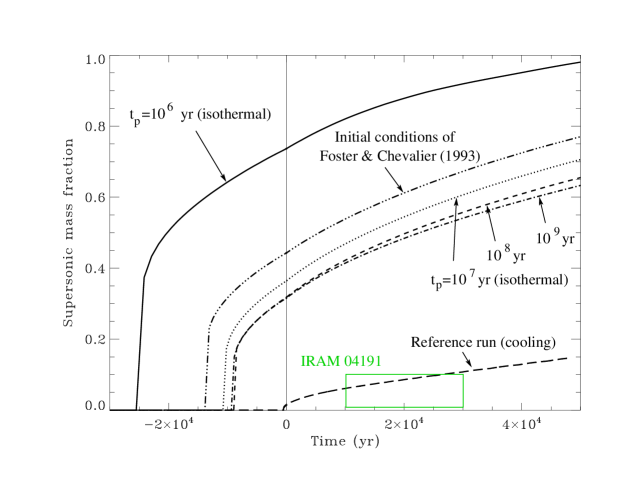
Figure 1 shows the evolution of , the fraction of mass with supersonic infall motion, during our isothermal runs and during the simulation with the same initial conditions as Foster & Chevalier (1993) (see section 2.2). depends critically on the initial conditions and on the parameter : the faster the increase in pressure, the more dynamical the collapse. This makes it a good test for the accuracy of the code and we reproduce the result of Foster & Chevalier (1993).
3 Non isothermal models with chemistry
3.1 Numerical and physical inputs
3.1.1 Method
We use an improved version of a code designed to compute shocks in the interstellar medium (Lesaffre et al. 2004). This code makes use of a moving grid algorithm which resolves at best temperature and chemical gradients for a fixed number of 100 zones. It also solves for multifluid magneto-hydrodynamical equations fully coupled to a chemical network. In the present version of the code, we set the magnetic field to zero, wrote the equations in spherical coordinates and added the radiative transfer equations and the energy budget for the grains.
In the following we mention only a few additional features that we included in the code :
-
•
adsorption and desorption chemistry onto and from grains.
-
•
transfer of the continuum radiation and approximate treatment of line cooling.
-
•
energy budget of the grains which transfer energy between gas and radiation.
3.1.2 Chemistry
The chemical network used in Lesaffre et al. (2004) comprised 120 reactions for 32 species. This network was designed to compute the abundances of the main molecular and atomic cooling agents of the interstellar medium. We added 4 species adsorbed onto grains : CO, H2O, CH4 and O2. We describe their rate of adsorption onto grains using a model similar to Nejad & Wagenblast (1999). For the sticking coefficient, we use expression (4) of Hollenbach & Salpeter (1971) calibrated by Buch & Zhang (1991) and Masunaga et al. (1998). We model the desorption due to cosmic-rays using the hot spot model of Léger et al. (1984). The formation of H2 molecules is the only reaction on grain surfaces included. Reactions of photo-dissociation, photo-ionisation as well as thermal sputtering of the grains are not included. Our treatment is thus accurate only up to grain temperatures of around 100 K. In the present work, we refer to the core as the innermost few AU where grains have such warm temperatures and are optically thick to radiation. We refer to the rest of the cloud as the envelope.
3.1.3 Radiation field
The transfer for the continuum radiation is done according to Dubroca & Feugeas (1999) as in Audit et al. (2002) with the Eddington factor obtained from the minimisation of the entropy of the photon gas. The Planck mean opacities of the grains are from Adams & Shu (1986) (ie: similar to Draine & Lee 1984). The outer boundary condition is a fixed temperature K and the inner one is a zero flux. Note that by we mean the bolometric temperature of the photon gas such that the radiation energy density is where is the radiation density constant.
The line transfer is assumed to be optically thin for the atoms and H2. This is not a good approximation deep in the core but this cooling turns out to be negligible there. The other sources of molecular coolings are from Hollenbach & McKee (1979) (for OH) and Neufeld & Kaufman (1993) (CO and H2O). For the optical depth parameter of molecule M (see Neufeld & Kaufman 1993) we use a combination of the column density of these molecules as well as the velocity gradients so that radiation takes the easiest way to escape :
| (1) |
with
| (2) |
and
| (3) |
is the local density of molecule M, is the velocity of the gas and its sound speed, is the distance to the centre, is the outer radius, is the density of H nuclei and is the extinction in the visible at the outer edge of the cloud ( or 2 in this study).
As discussed by Hollenbach & McKee (1979), the escape probabilities of the photons should be modulated by the probability for each line that an escaping photon be absorbed onto a grain. However, their treatment is only valid as long as the grains are optically thin. This is not valid anymore in the context of star formation after the first adiabatic core has formed. The correct treatment would involve a multi-group treatment of the radiation field with a very fine grid in wavelength. This is still way out of today’s computational capabilities. However, we tested two extreme hypotheses : either the line radiation is all absorbed by grains or the grains are transparent to the line radiation. We found that the collapse in the envelope proceeds in a very similar manner for both hypotheses. In the following, the results are presented for grains transparent to the line radiation.
3.1.4 Grain temperature
The heating and cooling processes included for the grains are :
-
•
absorption and emission of radiation by the grains (including the line cooling or not). The net energy rate gained by the grains is :
(4) where , are the radiation and dust temperatures, is the mean weight per hydrogen nucleus, is the Planck opacity of the grains (from Adams & Shu 1986) and is the speed of light. is the rate of energy lost by the gas (hence gained by the grains) via emission through lines. when lines are assumed to be absorbed onto grains. when grains are transparent to the lines.
-
•
collisional exchanges with the gas :
(5) with in cgs units (see Black 1987, page 731) and is the gas temperature.
-
•
heat released by H2 formation (2/3 or 1/3 of H2’s binding energy, depending if the line cooling is absorbed by the grains or not) :
(6) where is the rate of formation of H2 molecules on grains and eV is the binding energy per H2 molecule.
-
•
photoelectric effect on the grains is from Black (1987), page 731 :
(7) where measures the intensity of the ambient UV radiation field compared to the interstellar mean UV-field. is set to 1 and is computed from :
(8)
The temperature of the grains is obtained by setting their energy budget to zero:
| (9) |
Inside the collapsing cloud, the central extinction rapidly increases and shields the photoelectric effect. If we further neglect the absorption of the lines by grains and the heat released by H2 formation, the energy budget of the grains simply reads :
| (10) |
The grain temperature hence lies between the gas and the radiation temperature.
Equation (10) becomes
| (11) |
if we set
| (12) |
For densities much greater than the grain temperature is well coupled to the gas; for densities much lower than the grain temperature is close to the radiation temperature. However, the temperature dependence of often leads to a large range of densities for which the grain temperature is close neither to nor to (especially for low ). For amu, cmg-1 (at K) and K we get cm-3. Many authors (see Ceccarelli et al. 1996; Goldsmith 2001; Galli et al. 2002, for example) neglect in the grains energy budget when they estimate the grain temperature. Then they compare the radiative cooling of the gas to the collisional exchanges between gas and grains and find a critical density of cm-3 for the coupling between gas and grain temperature, much lower than . It is hence important to consider at least all terms in equation (10) rather than neglecting the gas-dust collisional exchanges in the grains budget.
3.2 Results
As in the isothermal case, we start from a hydrostatic state and trigger the collapse with a slow increase in external pressure. Since we now compute the temperature of the gas self-consistently, the parameter of the isothermal models is no longer relevant and is replaced by the outer boundary conditions for the radiation fields. Our reference run uses K, , , a total mass of 1.7 M⊙ and a pressure increase time scale yr. Another parameter is the primary ionisation rate by cosmic-rays which we fixed to s-1. This parameter is important in the chemistry and for the heating of the gas through cosmic-rays (Spitzer & Scott 1969). In the following, we describe the time evolution of this reference model, compare this model to the isothermal models and investigate the influence of several parameters.
3.2.1 Description of the reference model
 |
 |
 |
 |
 |
 |
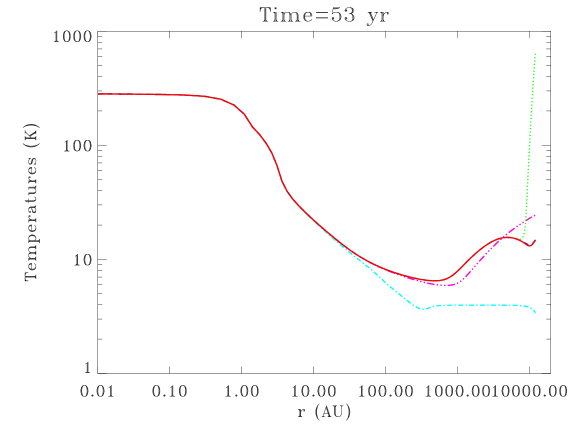
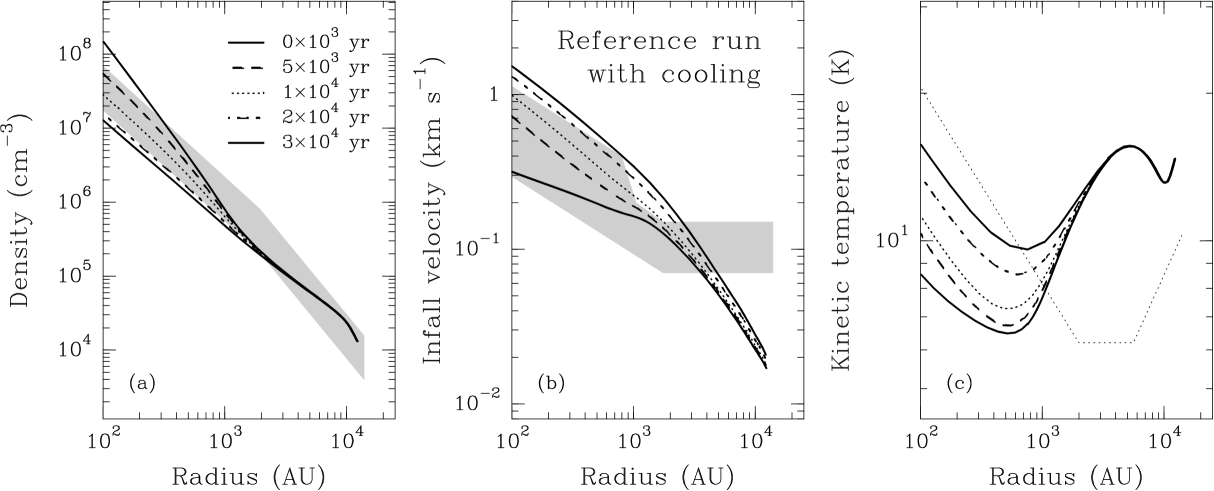
Figure 2 shows the dynamical evolution of the model. Features such as the formation of the first adiabatic core and the propagation of the expansion wave where the density profile switches to a law are already described in the literature (see Larson 1969; Whitworth & Summers 1985; Masunaga et al. 1998; Masunaga & Inutsuka 2000). We concentrate here on the heating and cooling processes.
 |
 |
 |
 |
 |
 |
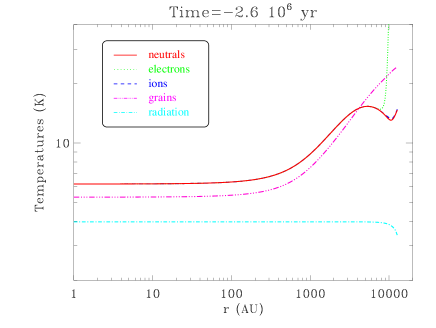
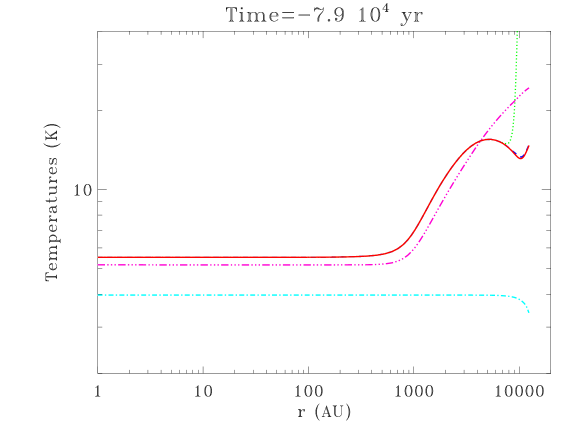
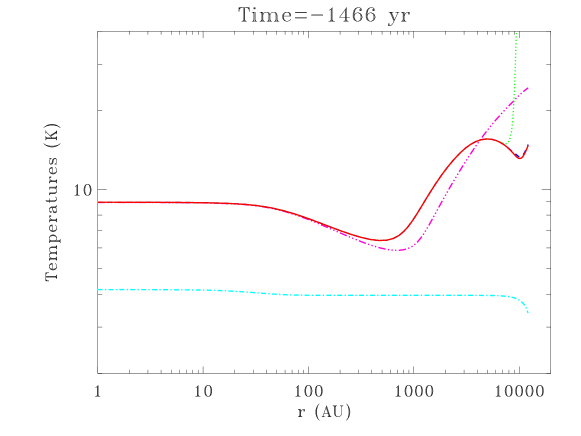
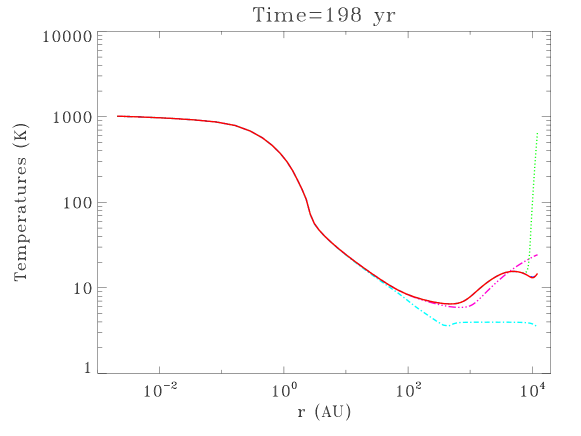
Figure 3 shows the evolution of the temperature profiles in a sequence of snapshots during the collapse. The gas temperature at the very edge of the envelope is determined by the balance between the molecular cooling (largely dominated by CO) and the heating through the photoelectric effect. The temperature of the electrons is decoupled from the heavier particles as they experience almost all the heating. Deeper in the envelope cosmic-ray heating (Spitzer & Scott 1969) takes over as the UV-field gets shielded from the outside.
The grains have no influence on the gas temperature at low densities, but the frequency of collisional exchanges between the gas and the grains is proportional to the square of the density. When the central density rises, these interactions get stronger than the collisionally saturated lines and CO ceases to be the main cooling agent. The cooling of the gas is then relayed by the grains which bring the gas temperature closer to the continuum radiation temperature and a dip appears in the temperature profile. Deeper in the core and later during the collapse the rate of compressional work gets stronger than the cosmic-ray heating and the temperature is the result of the balance between the rate of work of the pressure and the collisional cooling due to the grains.
Finally when the grains become optically thick to the continuum radiation no radiative process can cool the gas anymore. Its temperature gets higher and the accretion shock takes place. We take this time as the origin of time for simulations with cooling. We estimate it from the instant when the maximum of along the profile exceeds a half ( and are the thermal and viscous pressures).
Below the accretion shock the adiabatic compression goes on until the core temperature is high enough for the collisional dissociation of H2 to proceed. The second collapse then occurs. We do not describe this phase accurately as our equation of state is for an ideal gas and we do not consider the evaporation of the grains.
The code finally evolves through the singularity of the second collapse thanks to our fixed inner boundary. The density decreases in places reached by the expansion wave. This lowers the coupling of the gas temperature with the radiation temperature through the grains as seen in equation (13) and the gas temperature goes up.
3.2.2 Influence of cooling
In this section we compare our reference run to the isothermal model with same =107 yr.

We compare in figure 4 the velocity and density profiles at time in the two simulations: cooling leads to much lower velocities and a less steep density profile. The external pressure at is larger for the simulation with cooling ( K.kcm-3 versus K.kcm-3), in agreement with the corresponding result on marginally stable states found by Galli et al. (2002). Since we start both simulations with the same initial K.kcm-3, the simulation with cooling lasts about twice as much time.
To better understand the difference in velocities we trace the Lagrangian particle located at the shell of mass 0.15 M⊙ in both simulations. Its velocity evolves in time according to the competing gravitational acceleration and pressure deceleration (see figure 5). The net acceleration provides us with a typical timescale for the change in radius which turns out to be of the same order as or lower than the velocity time scale . We consider also and , the sound crossing time of the cloud (roughly AU/0.2 km s yr). We distinguish three phases:
-
1.
When the pressure increase is switched on, low amplitude oscillations of period a few characterise the adjustment of the cloud. When they finally damp, the hydrostatic equilibrium is verified at all times: . Until about yr, the radius and velocity of the Lagrangian particle are hence determined by the succession of hydrostatic equilibria driven by the time evolution of : we refer to this phase as the quasistatic phase.
-
2.
For times yr yr, . The time scale for the variation of the radius is still greater than the sound crossing time and the pressure has time to adjust. The hydrostatic equilibrium is hence still rather well verified, but is no longer controlling the time scales. has forced the hydrostatic equilibrium past the marginally stable state, and the cloud is slowly starting to collapse. We refer to this phase as the detaching phase.
-
3.
For yr, gets below . The velocity and radius changes are too fast for the cloud to adjust its pressure gradients. An increase of the gravitational acceleration reflects in a change of radius which in turn yields a higher acceleration. This runaway is hence sensitive to its initial conditions in radius and velocity, determined at the end of the detaching phase. We refer to this last phase as the collapse phase.
We note that the transition times remain within 50% of these estimates for mass shells 0.3 and 0.6 M⊙ in the case with cooling (with higher masses collapsing later). But the transition times can be twice earlier in the isothermal run compared to the run with cooling at shell mass 0.6 M⊙.

We show a comparison of the isothermal simulation and the reference run in figure 6 at the very beginning of the collapse, ie: the last hydrostatic configuration. The collisional exchanges between gas and grains are responsible for a dip in the temperature profile in the inner 0.2 M⊙. Pressure gradients depend on the density and temperature gradients:
| (14) |
In the isothermal case, only the density term remains (first term). In the case with cooling, the temperature gradients (second term) are also at play. Due to the temperature dip, the temperature gradient term is maximum at the mass shell 0.05 M⊙, where it is of the same order as the isothermal pressure gradient term, but directed outward. However, due to a steeper density profile in the mass range M⊙, the density term is roughly twice the isothermal pressure gradient. In effect, the resulting pressure gradient is actually of the same order as in the isothermal case (as noted by Galli et al. 2002, for the marginally stable state). It is nevertheless slightly greater in the innermost 0.05 M⊙ and the outermost 0.6 M⊙, and slightly lower (by about 35% at most) in the rest of the mass. As a result, the bulk of the envelope (0.05 MM⊙) is more extended (see figure 6).

This slight difference is increased during the collapse. Since these Lagrangian particles in the isothermal run start the collapse phase at a lower radius, they experience a higher gravitational acceleration, hence they reach sooner lower radii and their gravitational acceleration becomes even larger compared to the same Lagrangian particle in the reference run.
As a result the protostellar infall velocities at a given mass are much larger in the isothermal case than in the case with cooling. This explains the much lower supersonic mass fraction for the reference run compared to isothermal cases as seen in figure 1. However, to compare velocities at a given radius, one needs to keep in mind that a given mass is found at a smaller radius in the isothermal case. But this only partly compensates for the difference on the Lagrangian velocities and the net result is that infall velocities are larger at a given radius and a sufficiently late time for the isothermal run.
Finally, we note that the reasoning “the gas cools down, hence there is less support, hence the collapse is more violent” appears to be wrong. First, the quasistatic sequence of equilibria approaching the marginal state is modified in a non trivial way by the cooling: a given external pressure increase yields less contraction when cooling is switched on. As a result, the isothermal contraction motions are higher in the quasistatic and detaching phases. Second, the temperature dip in the last (unstable) hydrostatic equilibrium leads to a more extended inner envelope. Third, the collapse is sensitive to the configuration (velocities and radius) in the last hydrostatic state: it is much milder in the case with cooling.
3.2.3 Influence of other parameters
We varied between 106 and 108 yr without noticing a significant change (the supersonic mass fraction varies at most by 20% in relative value). This is in contrast to the isothermal models and suggests that indeed the thermal structure is constraining the collapse.
We reckon that an important factor is the depth and steepness of the temperature dip because this regulates the pressure gradients in the marginally stable state. This is partly determined by the minimum temperature in the dip, which in turn depends on the external radiation field. We tested which slightly lowers the temperature dip and yields a small decrease (of about 10% ) in the supersonic mass fraction. We also investigated much bigger changes in the value of from 2.7 to 15 K while keeping set to zero. Indeed, the minimum grain temperature is always about 1 K above when . This provides an easy way to control the temperature profile, even if the values we use do not correspond to practical situations (remember that is the bolometric temperature of the ambient infrared radiation field). Results show that velocities comparable to the infall motions in isothermal models are recovered for high values of (above 10 K) which flatten the dip in temperature.
From section 3.2.1 we note that CO is the only molecule that gives rise to significant cooling in the envelope. In addition, the infall motions are so slow and the densities so high that the chemical steady state is obtained everywhere at all times for CO. Indeed, the adsorption time for the CO molecule is given by
| (15) |
where is the effective surface of grains per H nucleus and is the weight of the molecule CO. On the other hand, the time scale for collapse can be estimated from the local free-fall time scale
| (16) |
where is the gravitational constant. The ratio is greater than 1 for
| (17) |
Since the densities at the edge of the cloud are greater than cm-3 in the marginally stable state, the time scales for adsorption are significantly shorter than the compression time scales. This allows to compute the CO abundance from the equilibrium between adsorption and desorption onto and from grains with virtually no loss of accuracy for the cooling function of the gas. Since all C in gas phase is usually locked in CO, we conclude that out-of-equilibrium chemistry has no impact on the cooling in the envelope.
Finally, we ran a simulation with a total mass of 3.4 M⊙ (double of the reference run, every other parameters being fixed). The density profiles are very similar at all times, the more massive being only an extension of the reference run at larger radii. As a result, the temperature dips at the beginning of the collapse are also very similar for radii smaller than 4000 AU (or 0.2 M⊙). At the formation of the stellar object, the innermost infall motions for the massive run are only about 20% higher than the reference model. The outermost infall motions are much higher (by a factor greater than 2 outside the shell of mass 0.2 M⊙). The scaling relations expected for isothermal models are hence not valid for the velocity profiles.
4 Comparison with observations
4.1 IRAM 04191
IRAM 04191+1522 – hereafter IRAM 04191 for short – is one of the youngest low mass class 0 protostars known so far in the Taurus molecular cloud ( pc). It features a prominent envelope ( M⊙), a powerful bipolar outflow and a very low bolometric luminosity of L⊙ (André et al. 1999). André et al. (1999) estimated an age of 1-3 yr since the beginning of the accretion phase. Belloche et al. (2002) performed a detailed analysis of the molecular line emission observed with the IRAM 30m telescope and derived strong constraints on the velocity structure of the envelope (see, e.g., the shaded area in Fig. 7). They showed that the envelope is undergoing both extended infall motions and fast, differential rotation. They proposed that the inner envelope ( AU) corresponds to a magnetically supercritical core decoupling from an environment still supported by magnetic fields.
Being born in the Taurus molecular cloud where star formation seems to proceed in a rather isolated and quiet manner, IRAM 04191 is likely to have experienced a slowly varying background in the past. It is therefore appropriate to compare it with models of collapse triggered quasistatically.
4.2 Isothermal models
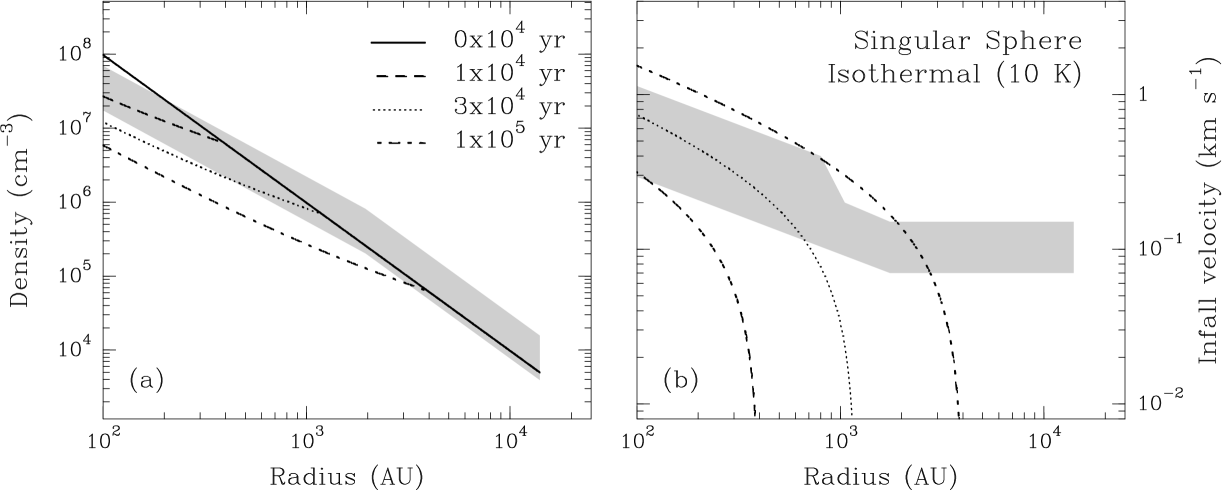
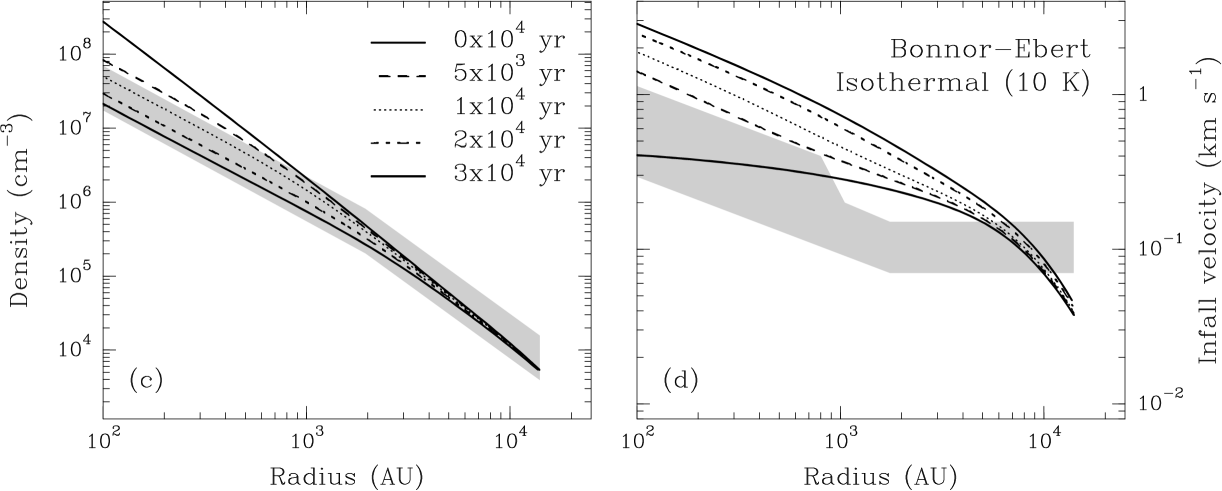
Figure 7 plots the results of two isothermal computations against the observational constraints of Belloche et al. (2002) for the density and velocity profiles. The two simulations differ only by their initial conditions.
The first simulation (figure 7a and b) is the self-similar solution obtained by Shu (1977) with a singular isothermal sphere for initial conditions. The density profiles can fit the observational constraints for to 3 104 yr but it shows no infall velocity in the outer part of the envelope for these ages.
The second simulation (figure 7c and d) is the least dynamical collapse we could achieve for a Bonnor-Ebert sphere ( yr). The density profile agrees quite well with the observational constraints at the estimated age of IRAM 04191 (from 104 to yr). But the velocities are much too high around a radius of 3000 AU at and this is even worse for the later relevant ages. The isothermal collapse is therefore way too dynamical to account for the observed infall velocities. We plot the results for a temperature K and a total mass M⊙, but the rescaling relations show that varying these parameters within their range of uncertainty ( between 7 and 15 K, between 1 and 2 M⊙ according to André et al. 1999) has minor effects on the profiles.
An even more stringent constraint from the observations by Belloche et al. (2002) is : 10% at most of the mass of IRAM 04191 has supersonic motions. However, even for the least dynamical of our isothermal simulations the supersonic mass fraction at time is still 31% and much more at the estimated age of IRAM 04191 (see figure 1).
4.3 Models with cooling and chemistry
When we include the cooling, the slower infall motions agree much better with the observational constraints inside a radius of 3000 AU as seen in figure 8. In particular, the supersonic mass fraction is now much lower and in much better agreement with the observations (see figure 1). However, there still remains a big discrepancy outside this radius, where the observations require an almost constant infall velocity profile.
Simulations with cooling also yield a kinetic temperature of the gas closer to the profile deduced by Belloche et al. (2002) from the analysis of molecular line spectra: in summary, they need a gas temperature of 6-7 K in the range of radii 2000-6000 AU and a gas temperature at the edge of around 10 K. In this respect, our minimum temperature (around 7 K) is too close from the centre of the core and our temperature at the edge of the core is slightly too hot (15 K). A higher at the surface only partly remedies to the latter problem (see figure 9): a bump in temperature at around 6000 AU still remains. This is due to the cosmic-ray heating. In the present work we use an old formulation due to Spitzer & Scott (1969) and we assume this process heats the neutral gas directly. However, the realistic mechanism rather involves heating of the electron gas which in turn exchanges heat via collision with neutrals. This could help decrease the temperature of the neutral gas if the coupling to electrons remains low. Future refinements of the code will include a proper treatment of the electron exchanges between the gas and the grains.

The density profiles are not very sensitive to the model of collapse and they remain within the observational constraints. Density and velocity constraints on our models yield an independant estimate of the age of IRAM 04191 in the interval 0.5-2 104 yr.
5 Discussion
5.1 The temperature dip
Masunaga & Inutsuka (2000); Evans et al. (2001); Zucconi et al. (2001); Galli et al. (2002) also find a dip in the temperature profile as a result of their model for the grains energy budget. However, all these authors neglect the collisional exchanges between gas and grains to compute . As pointed out in section 5, this leads to a coupling of and as soon as the density is above 105 cm-3. Besides, is then tied to the local radiation field, which is shielded near the edge of the cloud. As a result, the temperature starts to decrease for much larger radii than in our model. The temperature gradients are hence less steep and spread out to larger radii. Our model should then also account better for the flat temperature profiles found outward of 1000 AU for the prestellar cores L1498 and L1517B (Tafalla et al. 2005).
Grain opacities and gas-grain coupling are hence the main physical ingredients that control the position of the temperature dip. Another important factor is the cosmic-ray heating, as discussed in section 4.
5.2 Magnetic fields and rotation
Belloche et al. (2002) observe two regimes of infall and rotation in the outer envelope and inside a radius of 3000 AU. They proposed that the outer part of the object is still subcritical and supported by the magnetic field, but the collapsing inner part is supercritical. Although we did not include any magnetic field, we suggest that a slow increase of the external pressure can mimic the slow diffusion of the magnetic field from the outer parts. Hence our study applies to the inner core which frees itself from the magnetic field. A more consistent treatment including a magnetic field and differential rotation is desirable but hard to implement in practice due to the loss of spherical symmetry.
5.3 Turbulent support
The observed macroscopic random motions amount to a significant fraction of the broadening of the lines (Belloche et al. 2002). However, the origin of these turbulent motions is still not well understood and their role in the collapse is even less well known.
5.4 Pressure variation time scale
It is not clear whether the picture of quasistatically collapsing clouds matches the observations of the turbulent interstellar medium that surrounds them. Our results hold for pressure time scales down to =1 Myr. However, it is a rather difficult task to estimate the variability of the turbulent background in which the cloud is embedded.
Larson relations for a scale of 0.2 pc (corresponding to IRAM 04191’s diameter) give a velocity dispersion of roughly 0.5 km.s-1. This yields a time variability of 0.4 Myr.
C18O(1-0) observations of Belloche et al. (2002) with the IRAM 30m telescope, which probe the low density outskirts of IRAM 04191 (cm-3), show a turbulent velocity dispersion of 0.25 km.s-1 (FWHM 0.60 km.s-1). We extrapolated this velocity dispersion from the beam diameter (3500 AU) to 0.2 pc with a Kolmogorov scaling (velocity length) and found a time scale of the order of 0.35 Myr.
These time scales are hence less than half the lowest value we tried for . However, we note that they are valid for the intra-cloud velocity dispersion nowadays. They hence represents only a lower bound for the time-scale of the inter-cloud medium during the early collapse phase.
6 Summary and conclusions
We investigated the collapse of spherical clouds driven by a slow increase in external pressure. We compared isothermal models to simulations including cooling and found that the sequence of hydrostatic equilibria controls the infall motion in both the protostellar and the prestellar phases. In particular, the last (unstable) hydrostatic equilibrium reached controls the infall velocities during the collapse.
First, we note that hydrostatic equilibrium holds past the marginal state up to density contrasts of a factor of 10 greater than in the marginally stable state in our reference simulation. A collapsing cloud still in the detaching phase can thus exhibit an unstable hydrostatic density profile. Unstable hydrostatic equilibria should then be good models for observations of slowly contracting prestellar cores. Second, at the beginning of the collapse, the coupling between the gas and the background radiation mediated by the grains yields a temperature dip in the inner envelope which slightly lowers the pressure gradients. As a result, the last hydrostatic configuration is more extended. Third, the collapse phase is very sensitive to the initial conditions, hence to the last hydrostatic state. As a result, the collapse is much milder than in the isothermal case. We therefore suggest that the external radiation field and the collisional coupling between gas and grains are key ingredients constraining the dynamics of the collapse.
Our computations include a full out-of-equilibrium chemical network, but we show that only the adsorption and desorption of CO on grains have an impact on the cooling function. These processes can be safely considered at equilibrium for the range of parameters investigated. The energy budget is thus dominated by radiative transfer and microphysics on grains.
We compared the results of our computations to observational constraints obtained by Belloche et al. (2002) for the class 0 protostar IRAM 04191. We show that even the most quasistatic isothermal collapse is unable to account for the slow infall motion observed. On the other hand, simulations with cooling not only improve the kinetic temperature but also provide better velocity profiles in the inner 3000 AU. Rotation and magnetic fields are likely to be at play in the outer regions, but are hard to account for in 1D simulations. Future investigations should aim at describing ambipolar diffusion in a non-isothermal context.
This study justifies the use of post-processed chemistry using a prescribed dynamical background, keeping in mind that the line profiles directly probe infall motions and excitation temperatures.
Acknowledgements.
We are indebted to Prof. G. Pineau des Forêts for suggesting to us the model for grain adsorption and desorption. We thank the anonymous referee for a constructive report and interesting comments.References
- Adams & Shu (1986) Adams, F.C., Shu, F.H., Ap. J. (1986) 308, 836-853
- Aikawa et al. (2001) Aikawa, Y., Ohashi, N., Inutsuka, S.-I., Herbst, E., Takakuwa, S., Ap. J. (2001) 552, 639-653
- André et al. (1999) André, P., Motte, F., Bacmann, A., Ap. J. (1999) 513, L57-L60
- Audit et al. (2002) Audit, E., Charrier, P., Chièze, J.-P., Dubrocca, B., astro-ph/0206281
- Basu & Mouschovias (1994) Basu, S., Mouschovias, T.Ch., Ap. J. (1994) 432, 720-741
- Belloche et al. (2002) Belloche, A., André, P., Despois, D., Blinder, S., Astron. Astrophys. (2002) 393, 927-947
- Black (1987) Black, (1987) Interstellar Processes, eds. Hollenbach and Thronson (Reidel, Dordrecht)
- Blottiau et al. (1988) Blottiau, P., Bouquet, S., Chièze, J.-P., Atron. Atrophys. (1988) 207, 24-36
- Boland & De Jong (1984) Boland, W., De Jong, T., Astron. Atrophys. (1984) 134, 87-98
- Bouquet et al. (1985) Bouquet, S., Feix, M.R., Fijalkow, E., Ap. J. (1985) 293, 494-503
- Buch & Zhang (1991) Buch, V., Zhang, Q., Ap. J. (1991) 379, 647-652
- Ceccarelli et al. (1996) Ceccarelli, C., Hollenbach, D.J., Tielens, A.G.G.M., Ap. J. (1996) 471, 400
- Chièze & Pineau des Forêts (1987) Chièze, J.-P., Pineau des forêts, G., Astron. Astrophys. (1987) 183, 98-108
- De Jong et al. (1980) De Jong, T., Dalgarno, A., Boland, W., Astron. Atrophys. (1980) 91, 68-84
- Draine & Lee (1984) Draine, B. T., Lee, H. M., ApJ (1984) 285, 89
- Dubroca & Feugeas (1999) Dubroca, B., Feugeas, J.-L., C. R. A. S. (1999) 329, 915-920
- Evans et al. (2001) Evans, N.J., Rawlings, J.M.C., Shirley, Y.L., Mundy, L.G. (2001) 557, 193-208
- Foster & Chevalier (1993) Foster, P.N., Chevalier, R.A., Ap. J. (1993) 416, 303-311
- Goldsmith (2001) Goldsmith, P. F., ApJ (2001) 557, 736
- Galli et al. (2002) Galli, D., Walmsley, M., Gonçalves, J., A&A (2002) 394, 275
- Hennebelle et al. (2003) Hennebelle, P., Whitworth, A. P., Gladwin, P. P., André, Ph., MNRAS (2003) 340, 870
- Hollenbach & Salpeter (1971) Hollenbach, D., Salpeter, E.E., Ap. J. (1971) 163, 155-164
- Hollenbach & McKee (1979) Hollenbach, D., McKee, C.F., Ap. J. Suppl. (1979) 41, 555-592
- Larson (1969) Larson, R.B., MNRAS (1969) 145, 271-295
- Lee et al. (2003) Lee, J.E., Evans, N.J., Shirley, Y.L., Ap. J. (2003) 583, 789-808
- Léger et al. (1984) Léger, A., Jura, M., Omont, A. , Astron. Astrophys. 144, 147 (1985) 144, 147-160
- Lesaffre (2002) Lesaffre, P., PhD thesis, Université Paris 7 Denis Diderot (2002)
- Lesaffre et al. (2004) Lesaffre, P., Chièze, J.-P., Cabrit, S., Pineau des Forêts, G., Astron. Astrophys. (2004) 427, 147-155
- Li (1998) Li, Z.-Y., Ap. J. (1998) 493, 230-246
- Li (1999) Li, Z.-Y., Ap. J. (1999) 526, 806-818
- Li et al. (2002) Li, Z.-Y., Shematovich, V.I., Wiebe, D.S., Shustov, B.M., Ap. J. (2002) 569, 792-802
- Masunaga et al. (1998) Masunaga, H., Miyama, S.M., Inutsuka, S.I., Ap. J. (1998) 495, 346-369
- Masunaga & Inutsuka (2000) Masunaga, H., Inutsuka, S.I., Ap. J. (2000) 531, 350-365
- Motte & André (2001) Motte, F., André, P., Atron. Astrophys. (2001) 365, 440-464
- Nejad & Wagenblast (1999) Nejad, L.A.M., Wagenblast, R., Astron. Astrophys. (1999) 350, 204-229
- Neufeld & Kaufman (1993) Neufeld, D., Kaufman, M.J., Ap. J. (1993) 418, 263-272
- Shu (1977) Shu, F.H., Ap. J. (1977) 214, 488-497
- Spitzer & Scott (1969) Spitzer, L., Scott, E. H., ApJ (1969) 158, 161
- Tafalla et al. (2005) Tafalla, M., Myers, P. C., Caselli, P., Walmsley, C. M. A&A (2004) 416, 191
- Whitworth & Summers (1985) Whitworth, A., Summers, D., MNRAS (1985) 214, 1-25
- Zucconi et al. (2001) Zucconi, A., Walmsley, C.M., Galli, D., Astron. Astrophys. (2001) 376, 650-662