First detection of [CII]158m at high redshift:
vigorous star formation in the early universe
We report the detection of the fine-structure line of at 157.74 in SDSSJ114816.64+525150.3 (hereafter J1148+5251), the most distant known quasar, at , using the IRAM 30-meter telescope. This is the first detection of the [CII] line at high redshift, and also the first detection in a Hyperluminous Infrared Galaxy (). The [CII] line is detected at a significance level of 8 and has a luminosity of . The ratio is , about an order of magnitude smaller than observed in local normal galaxies and similar to the ratio observed in local Ultraluminous Infrared Galaxies. The [CII] line luminosity indicates that the host galaxy of this quasar is undergoing an intense burst of star formation with an estimated rate of . The detection of in SDSS J1148+5251 suggests a significant enrichment of metals at (age of the universe 870 Myr), although the data are consistent with a reduced carbon to oxygen ratio as expected from chemical evolutionary models of the early phases of galaxy formation.
Key Words.:
Galaxies: high redshift – Galaxies: ISM – quasars: individual: J114816.64+525150.3 – Infrared: galaxies – Submillimeter – ISM: abundances1 Introduction
The fine-structure line of at 157.74 is often the brightest emission line in the spectrum of galaxies, accounting for as much as 0.1-1% of their total luminosity (Crawford et al., 1985; Stacey et al., 1991; Wright et al., 1991). The line is emitted predominantly by gas exposed to ultraviolet radiation in photo dissociation regions (PDRs) associated with star forming activity (even in galaxies hosting AGNs), and has been extensively used to investigate the physical conditions of PDRs and to trace star formation in external galaxies (e.g. Malhotra et al., 2001; Luhman et al., 2003; Kaufman et al., 1999; Genzel & Cesarsky, 2000; Boselli et al., 2002; Pierini et al., 2003).
In local galaxies, with far-infrared luminosities111We adopt the definition given in Sanders & Mirabel (1996). , the fractional contribution of the luminosity to the far-infrared luminosity, which is a measure of the gas heating efficiency, is typically in the range (e.g., Stacey et al. 1991). For sources with far-infrared luminosities in excess of or with increasing star formation activity, this ratio drops by an order of magnitude (Malhotra et al., 2001; Luhman et al., 1998, 2003; Negishi et al., 2001). Various possibilities have been proposed to explain this effect at high luminosities, specifically: 1) a high ratio of ultraviolet flux to gas density, resulting in positively charged dust grains which in turn reduce the efficiency of the gas heating by the photoelectric effect (e.g. Kaufman et al., 1999); 2) opacity effects which weaken the [CII] emission line in infrared luminous galaxies (Gerin & Phillips, 2000; Luhman et al., 1998); 3) contribution to from dust associated with HII regions (Luhman et al., 2003); 4) contribution to from an AGN (see Malhotra et al., 2001).
The possibility of probing the interstellar medium and tracing star formation in galaxies at cosmological distances by using the bright emission line, when redshifted into submillimeter atmospheric windows, was proposed by Petrosian et al. (1969), and further discussed by Loeb (1993), Stark (1997) and Blain et al. (2000). However, [CII] has so far only been detected in local galaxies () from space and airborne observatories (e.g. Luhman et al., 2003), while all the searches for at higher redshifts have been unsuccessful. Deep searches for were carried out in infrared luminous galaxies and quasars having massive reservoirs of molecular and neutral gas detected in CO emission lines. Specifically, was searched for in the damped Ly absorption system towards PC 1643+4631A (Ivison et al., 1998), the quasar PSS 2322+1944 (Benford et al., in prep.), the quasar BR 12020725 (Isaak et al., 1994; van der Werf, 1999, Benford et al. in prep.), a lensed galaxy in the cluster CL 1352+62 (Marsden et al., 2005), and the quasar SDSS J1148+5251 (Bolatto et al., 2004, the same object discussed here).
In this letter, we report the detection of in J114816.64+525150.3 (hereafter J1148+5251) the most distant quasar known whose redshift of 6.42 puts it at the end of the epoch of re-ionization (Fan et al., 2003). Millimetric and submillimetric continuum detections indicate that the host galaxy of this quasar radiates a far-IR luminosity222Thanks to new submm data Beelen et al. (in prep.) obtained a new estimate of the far-IR luminosity, which is in the range . of , which, if ascribed to starburst activity (and not to the QSO itself), would imply star formation rates of a few times (Bertoldi et al., 2003a; Robson et al., 2004). A massive reservoir of molecular and neutral gas of a few has been detected via CO line emission (Walter et al., 2003, 2004; Bertoldi et al., 2003b). The detection of copious amounts of dust and molecular gas indicates that the insterstellar medium in J1148+5251 is significantly enriched in metals. This enrichment is also seen through the detection of prominent iron line emission in the rest-frame UV spectrum of the quasar (Maiolino et al., 2003), although the latter samples its nuclear region.
The deep observations described in this paper, improve significantly the noise–level reported by Bolatto et al. (2004) and enabled us to achieve the first detection of the emission line at cosmological distances as well as the first detection of this line in a galaxy with an infrared luminosity in excess of . We discuss the implications of this detection for the physical properties of the ISM and of star formation in J1148+5251 333In this letter we assume the concordance -cosmology with , and (Spergel et al., 2003).
| Line | Peak int. | I | L | ||||
|---|---|---|---|---|---|---|---|
| [GHz] | [mJy] | [] | [] | [] | |||
| [CII] () | 1900.54 | 256.172 | 6.41890.0006 | 11.8 | 35050 | 4.10.5 | 4.40.5 |
| CO (6–5) | 692.473 | 93.204 | 6.41890.0006 | 2.45 | 27965 | 0.730.076 | 0.290.02 |
2 Observations and results
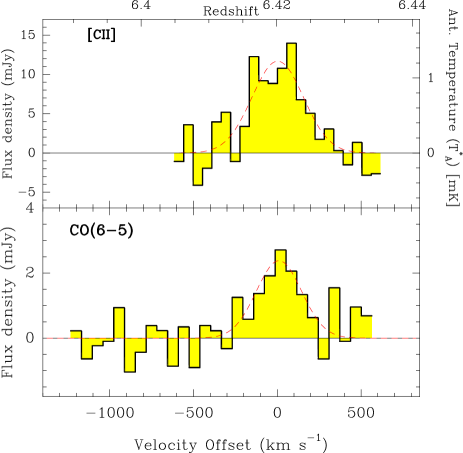
Observations were carried out with the IRAM 30m telescope in two observing runs: February 2–3 and March 8–10, 2005. We used alternatively the C and D 150 receivers with filter banks covering a bandwidth of 1 GHz with 256 channels spaced by 4 MHz. The receivers were tuned to 256.1753 GHz corresponding to the frequency of the [CII] emission line (rest frequency 1900.539 GHz) redshifted to , the redshift of the CO emission lines, but we also observed with the frequency offset by 100 km/s to minimize, and check, the effects of possible instrumental artifacts. At this frequency the Half Power Beam Width is 9.6′′ and the 1GHz bandwidth corresponds to . The observing conditions were generally good: low opacity, with during the March run and during the February run, and system temperature T350 K. The observations were done in wobbler switching mode with a switching frequency of 0.5 Hz and a wobbler throw of 200′′. In total, the source was observed for 12.4 hours. Calibration was obtained every 15 minutes using the standard hot/cold-load absorber measurements. Pointing was checked about every 1.5 hour by means of one of the two 3mm receivers (A100/B100) and the pointing accuracy was found to be in the range . The focus was checked about every 3–4 hours, and was found not to change significantly.
The data were processed using the CLASS software. After dropping some bad scans, only linear baselines were subtracted from individual spectra. The individual scans were realigned in frequency and co-added by weighting with 1/rms2. The resulting profiles were re-gridded to a velocity resolution of 56 km/s leading to an rms of about 0.3 mK (2.8 mJy)444The conversion between antenna temperature and flux density scale at 256 GHz for the 30m is 9.5 Jy/K.. We estimate the flux density scale to be accurate to about 30%.
The final spectrum of the [CII] emission line in J1148+5251 is shown in Fig. 1. The fine-structure line is detected with a confidence 8 . The velocity integrated flux is (in antenna temperature, ), or , and the line center corresponds within the uncertainties to the center of the CO line emission (Table 1 and Fig. 1).
Bolatto et al. (2004) used the James Clerk Maxwell Telescope to detect the C+ line in J1148+5251, but could only place an upper limit to its line strength. To compare their limits with our result we note that the peak intensity of our line (12 mJy) is three times lower than the rms (32 mJy) in their final spectrum smoothed to a resolution of 10 MHz (or ). The [CII] velocity integrated flux reported in this paper is twice larger than the 1 limit estimated by Bolatto et al. for the intensity of any putative line in the JCMT spectrum.
3 Discussion
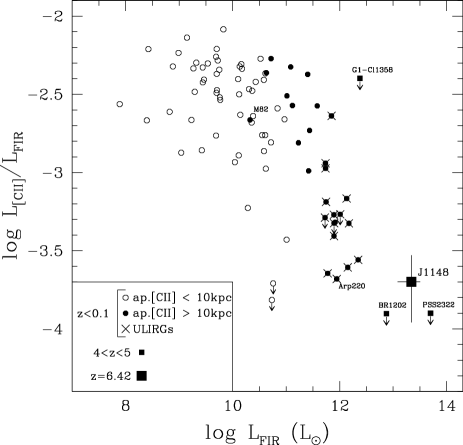
The emission of in J1148+5251 is an extreme example of what is seen in local infrared galaxies. The ratio in J1148+5251 is , about an order of magnitude smaller than in local starburst galaxies. This is illustrated in Fig. 2, where we plot the ratio in nearby star-forming galaxies as a function of their far-infrared luminosity, together with the current upper limits for high-redshift sources and the value obtained for J1148+5251. A decrease of the ratio with increasing beyond is clearly apparent in Fig. 2. The ratio for J1148+5251 is consistent with this general trend. Note also that our sensitive detection is consistent with the upper limits inferred for other high-z QSOs in Fig. 2.
The detection of strong [CII] emission suggests that the interstellar medium was already significantly enriched with metals at , i.e. when the universe was as young as 870 Myr. However, the chemical evolutionary models predict that the enrichment of carbon relative to the elements is delayed (since carbon is mostly produced by intermediate/low mass stars), and in particular the C/O ratio should be about 1/6 in the young stages of massive elliptical galaxies, while the absolute abundance of O should be similar to the local value, at least at an age of about 1 Gyr (Pipino & Matteucci, 2004). To achieve a better physical understanding of this source, and in particular to investigate whether the C-poor scenario is consistent with the data or not, we have compared all available observational data for the host galaxy of the quasar (i.e. [CII], FIR and CO transitions) with PDR models. The relevant observational data are summarized in the second column of Tab.2. We used the PDR model of Kaufman et al. (1999), modified for the conditions appropriate for J1148+5251. In particular, we lowered the carbon-to-oxygen abundance as discussed above. We did not include detailed models for the evolution of dust (Morgan & Edmunds, 2003), nor the possible contribution of dust from SNe (Maiolino et al., 2004), we simply scaled the the abundance of dust grains and PAHs proportionally to the carbon abundance. The model requires high densities and high UV radiation fields to reproduce the data. However, a PDR model which fits observations of typical star forming regions fails to reproduce the strength of the high-J CO transitions observed by Bertoldi et al. (2003b). It is possible to increase the gas heating in the CO-emitting region by increasing the cosmic ray ionization rate. Such a high ionization rate can mimic the higher gas heating due to an increased X-ray flux associated with the powerful QSO hosted by this system. We find a good fit to the observations with a gas density , a FUV field times stronger than the average value in the Galactic ISM, C/O=1/6, and a cosmic ray ionization rate per H nucleus of , i.e. about 10 times the Galactic value. The cosmic background radiation at has a temperature of about 22 K, much lower than the gas temperature observed in this system, it may however slightly affect the lower CO transitions, but the latter are less relevant for our model (especially CO(1–0) which only has an upper limit). The resulting model reproduces all the observed line ratios and line-to-FIR ratios within a factor of 30%. This result shows that the C-poor scenario is consistent with the data. On the other hand it is not a proof of a low C–to–O ratio. Indeed, even using the C/O ratio typical of the local ISM the results of the model are still in fair agreement with the data, as shown in the third column of Tab. 2. Summarizing, PDR models with high densities and enhanced X-ray (cosmic ray) flux can reproduce the observed properties of J1148+5251, both with local ISM abundances and with a reduced C/O ratio predicted by chemical evolutionary models. Tackling the issue of the chemical abundances in detail will require the observation of additional lines.
| Ratio | Observed | Modela | |
|---|---|---|---|
| C/O=1/6 | C/O=local | ||
Note: a The abundances for the models with “local” ISM fractions are specifically O/H=3.2 10-4 and C/H=1.4 10-4 (Savage & Sembach, 1996), while for the “reduced” C/O model C/H=5.6 10-5 and O/H has been kept to the same value as “local”.
As discussed in the introduction, the [CII] line is produced by the UV field in star forming regions and therefore can be used as an indicator of the star formation rate (SFR). Boselli et al. (2002) calibrate the luminosity of [CII] in terms of SFR, but their calibration only applies to low luminosity systems (). We have attempted to derive the relation at high luminosities (). One possibility is to combine the relationship between far-IR luminosity and star formation rate derived by Kennicutt (1998) with the ratio predicted by the model (where we use the intermediate value of the obtained from the two models in Tab.2.), yielding the relation:
| (1) |
From Eq. 1 and from the [CII] luminosity we infer a star formation rate in the host of J1148+5251 of , consistent with the SFR estimated from (Bertoldi et al., 2003a). Therefore our result demonstrates that the host galaxy of this quasar is the site of extremely powerful massive star formation, and it is probably tracing the earliest stages of the black hole–spheroid co-evolution.
The first detection of the fine-structure line of C+ in a high redshifted object shows the potential use of this emission line to investigate star formation and the physics of the interstellar medium in the early universe. Further detections and imaging of C+ in high- objects will continued to be made by using existing instruments and forthcoming facilities, in particular with the Atacama Large Millimeter Array (ALMA) for which this topic is one of the primary scientific goals.
Acknowledgements.
We thank X. Tielens and P. Vanden Bout for useful comments. M.J.K.’s participation was made possible through a sabbatical leave from San Jose State University and the support and hospitality of Arcetri Observatory. We thank the IRAM staff for their support during the observations. IRAM is supported by INSU/CNRS (France), MPG (Germany) and IGN (Spain). This work has benefited from research funding from the European Community’s Sixth Framework Programme. R.M. acknowledges financial support from MIUR under grant PRIN-03-02-23.References
- Bertoldi et al. (2003a) Bertoldi, F., Carilli, C. L., Cox, P., Fan, X., Strauss, M. A., Beelen, A., Omont, A., & Zylka, R. 2003a, A&A, 406, L55
- Bertoldi et al. (2003b) Bertoldi, F., et al. 2003b, A&A, 409, L47
- Blain et al. (2000) Blain, A. W., Frayer, D. T., Bock, J. J., & Scoville, N. Z. 2000, MNRAS, 313, 559
- Bolatto et al. (2004) Bolatto, A. D., Di Francesco, J., & Willott, C. J. 2004, ApJ, 606, L101
- Boselli et al. (2002) Boselli, A., Gavazzi, G., Lequeux, J., & Pierini, D. 2002, A&A, 385, 454
- Crawford et al. (1985) Crawford, M. K., Genzel, R., Townes, C. H., & Watson, D. M. 1985, ApJ, 291, 755
- Fan et al. (2003) Fan, X., et al. 2003, AJ, 125, 1649
- Genzel & Cesarsky (2000) Genzel, R., & Cesarsky, C. J. 2000, ARA&A, 38, 761
- Gerin & Phillips (2000) Gerin, M., & Phillips, T. G. 2000, ApJ, 537, 644
- Kaufman et al. (1999) Kaufman, M. J., Wolfire, M. G., Hollenbach, D. J., & Luhman, M. L. 1999, ApJ, 527, 795
- Kennicutt (1998) Kennicutt, R. C. 1998, ARA&A, 36, 189
- Isaak et al. (1994) Isaak, K. G., McMahon, R. G., Hills, R. E., & Withington, S. 1994, MNRAS, 269, L28
- Ivison et al. (1998) Ivison, R. J., Harrison, A. P., & Coulson, I. M. 1998, A&A, 330, 443
- Loeb (1993) Loeb, A. 1993, ApJ, 404, L37
- Luhman et al. (1998) Luhman, M. L., et al. 1998, ApJ, 504, L11
- Luhman et al. (2003) Luhman, M. L., Satyapal, S., Fischer, J., Wolfire, M. G., Sturm, E., Dudley, C. C., Lutz, D., & Genzel, R. 2003, ApJ, 594, 758
- Maiolino et al. (2004) Maiolino, R., Schneider, R., Oliva, E., Bianchi, S., Ferrara, A., Mannucci, F., Pedani, M., & Roca Sogorb, M. 2004, Nature, 431, 533
- Maiolino et al. (2003) Maiolino, R., Juarez, Y., Mujica, R., Nagar, N. M., & Oliva, E. 2003, ApJ, 596, L155
- Malhotra et al. (2001) Malhotra, S., et al. 2001, ApJ, 561, 766
- Marsden et al. (2005) Marsden, G., Borys, C., Chapman, S. C., Halpern, M., & Scott, D. 2005, MNRAS, 359, 43
- Morgan & Edmunds (2003) Morgan, H. L., & Edmunds, M. G. 2003, MNRAS, 343, 427
- Negishi et al. (2001) Negishi, T., Onaka, T., Chan, K.-W., & Roellig, T. L. 2001, A&A, 375, 566
- Petrosian et al. (1969) Petrosian, V., Bahcall, J. N., & Salpeter, E. E. 1969, ApJ, 155, L57
- Pierini et al. (2003) Pierini, D., Leech, K. J., Völk, H. J. 2003, A&A, 397, 871
- Pipino & Matteucci (2004) Pipino, A., & Matteucci, F. 2004, MNRAS, 347, 968
- Robson et al. (2004) Robson, I., Priddey, R. S., Isaak, K. G., & McMahon, R. G. 2004, MNRAS, 351, L29
- Sanders & Mirabel (1996) Sanders, D. B., & Mirabel, I. F. 1996, ARA&A, 34, 749
- Savage & Sembach (1996) Savage, B. D., & Sembach, K. R. 1996, ARA&A, 34, 279
- Spergel et al. (2003) Spergel, D. N., et al. 2003, ApJS, 148, 175
- Stacey et al. (1991) Stacey, G. J., Geis, N., Genzel, R., Lugten, J. B., Poglitsch, A., Sternberg, A., & Townes, C. H. 1991, ApJ, 373, 423
- Stark (1997) Stark, A. A. 1997, ApJ, 481, 587
- van der Werf (1999) van der Werf, P. P. 1999, ASP Conf. Ser. 156: Highly Redshifted Radio Lines, 156, 91
- Walter et al. (2004) Walter, F., Carilli, C., Bertoldi, F., Menten, K., Cox, P., Lo, K. Y., Fan, X., & Strauss, M. A. 2004, ApJ, 615, L17
- Walter et al. (2003) Walter, F., et al. 2003, Nature, 424, 406
- Wright et al. (1991) Wright, E. L., et al. 1991, ApJ, 381, 200