Young stars and dust in AFGL437: NICMOS/HST polarimetric imaging of an outflow source
Abstract
We present near infrared broad band and polarimetric images of the compact star forming cluster AFGL437 obtained with the NICMOS instrument aboard HST. Our high resolution images reveal a well collimated bipolar reflection nebulosity in the cluster and allow us to identify WK34 as the illuminating source. The scattered light in the bipolar nebulosity centered on this source is very highly polarized (up to 79%). Such high levels of polarization implies a distribution of dust grains lacking large grains, contrary to the usual dust models of dark clouds. We discuss the geometry of the dust distribution giving rise to the bipolar reflection nebulosity and make mass estimates for the underlying scattering material. We find that the most likely inclination of the bipolar nebulosity, south lobe inclined towards Earth, is consistent with the inclination of the large scale CO molecular outflow associated with the cluster, strengthening the identification of WK34 as the source powering it.
1 Introduction
Polarimetric images of star forming regions have revealed nebulosities with very high degrees of linear polarization which can only be accounted for by light scattering from small dust particles at nearly right angles (e.g., Werner, Capps & Dinerstein 1983). Many of these reflection nebulosities are associated with young optically invisible protostars, and in some cases even near-infrared invisible protostars. The polarization signatures associated with these reflection nebulae offer valuable clues about the spatial distribution of scattering material and the relative location of the illuminating source(s), sometimes betraying the location of previously undetected and highly obscured objects (e.g., Weintraub & Kastner 1996a). Polarization data can also be used to constrain the composition and size distribution of the dust grains responsible for scattering (e.g., Pendleton, Tielens & Werner 1990; Kim, Martin & Hendry 1994, KMH).
AFGL437 is a well studied compact cluster (0.2 pc across) of young stars and reflection nebulosity 20.5 kpc from the sun (Arquilla & Goldsmith 1984, and references therein). The youth of this cluster is inferred from the presence of B stars and associated HII regions detected using optical spectroscopy (Cohen & Kuhi 1977). Three high luminosity members were found in an infrared survey (Wynn-Williams et al. 1981), two of which are counterparts to the optical reflection nebulosity studied by Cohen & Kuhi. Other signs of active star formation include radio CO observations (Gomez et al. 1992) of a broad, large scale ( 1 pc) bipolar molecular outflow coincident with the infrared cluster, and observations of water masers associated with cluster members (Torelles et al., 1992).
Several dozen deeply embedded, lower luminosity members of the cluster were discovered through sensitive observations in the J, H and K bands by Weintraub & Kastner (1996b; hereafter WK1996). WK1996 also presented resolution ground based polarimetric images of the cluster in the J, H and K bands which revealed polarization levels up to 50% in the nebulosity adjacent to one of the three high luminosity members, AFGL437N. The polarization pseudo-vectors of the most highly polarized region showed a centrosymmetric pattern centered on a before unseen intensity peak called WK34 by the authors. Follow up 3.8 images of the cluster with resolution revealed a nebulosity centered on WK34 which is extended along the molecular CO outflow axis (Weintraub et al. 1996c).
We have performed follow up 1 to 2 polarimetric and broad band imaging of the reflection nebulosity associated with AFGL437 using HST/NICMOS. Our observations reveal a very narrow bipolar nebula in the field with polarization levels as high as 793% at 2 m. Following a presentation of the data we discuss the physical implications of the observations and constraints placed upon the underlying mass distribution. This is followed by a summary of results and concluding remarks.
2 NICMOS Observations
NICMOS polarimetric and broad band images of the central region of the AFGL437 IR cluster were obtained with 5 observations between Dec 30, 1997 and Feb 15, 1998 utilizing both the NIC1 and NIC2 cameras. The log of observations, the cameras used for each filter and the measured PSF FWHM and rms noise levels are presented in Table 1. The 1m and 2m polarimetry was obtained with the NIC1 and NIC2 cameras, respectively. Images of a blank patch of sky were observed through the F222M filter and the 2m polarizers for background subtraction. The plate scales are 0.043″for camera 1 and 0.076″for camera 2. The resulting field of view at 1 is 11.1″10.9″and the field of view for all other wavelengths is 19.5″19.3″.
Our raw MULTIACCUM image data was calibrated using custom IDL procedures to perform dark subtraction, cosmic ray removal, linearity correction and flat fielding (Thompson et al. 1999). The field was imaged in a 7-position spiral-dither pattern with a offset to sample over bad pixels and to average over sub pixel sensitivity. The most contemporaneous dark frames and flat fields maintained by the NICMOS Instrument Definition Team (IDT) team were used for the reduction. The photometric conversion from ADU s-1 pix-1 to Jy pix-1 are given in Table 1 (M.Rieke 2000, private communication). The images were rectified to correct for the rectangular pixels projected onto the sky by the NICMOS detector array (Thompson et al. 1998). The rectification step is essential for producing unskewed polarization position angles across the field of view (Weintraub et al. 2000a; Hines, Schmidt & Schneider 2000, hereafter HSS2000).
2.1 Polarimetry
Our polarimetric data was reduced using the HSL algorithm as described in HSS2000. The error analysis for NICMOS polarimetry is expounded in great detail in HSS2000 as well as Sparks & Axon (1999, hereafter SA1999). These errors are discussed in the presentation of the data in the following two sections. The foreground linear polarization expected at near infrared wavelengths due to grain alignment in the intervening interstellar medium is observed to be very low ( 4%) for line of sight extinction through dark clouds with (Goodman et al. 1995; see also Weintraub, et al. 2000b for a discussion). Therefore any foreground polarization in our data is expected to contribute (or cancel) only a small fraction of that which we have observed.
2.1.1 2 Polarimetry
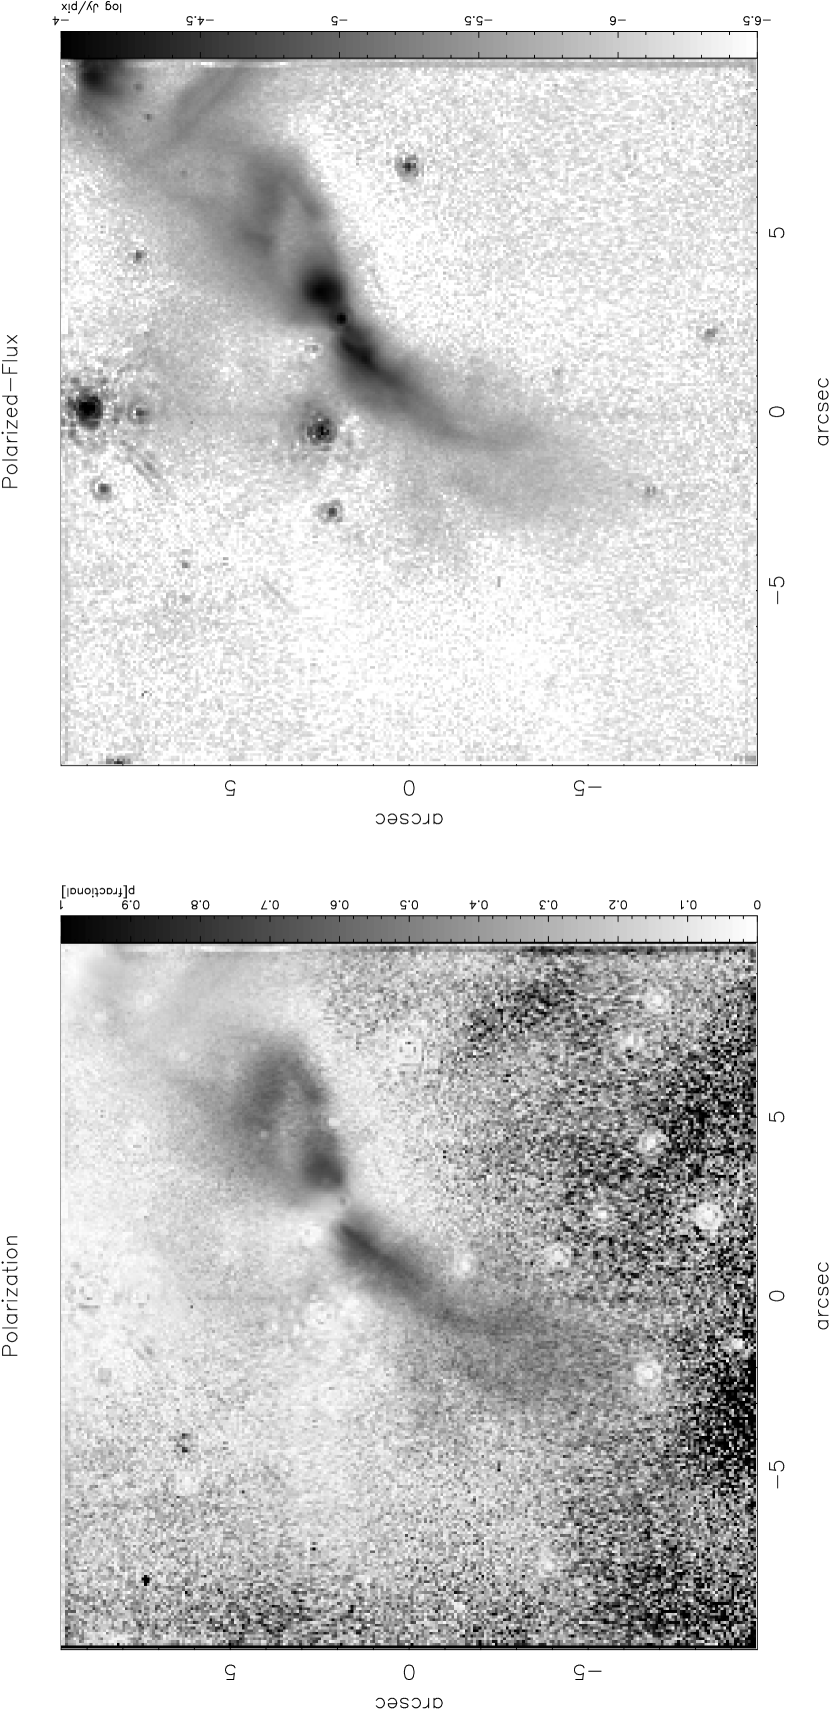
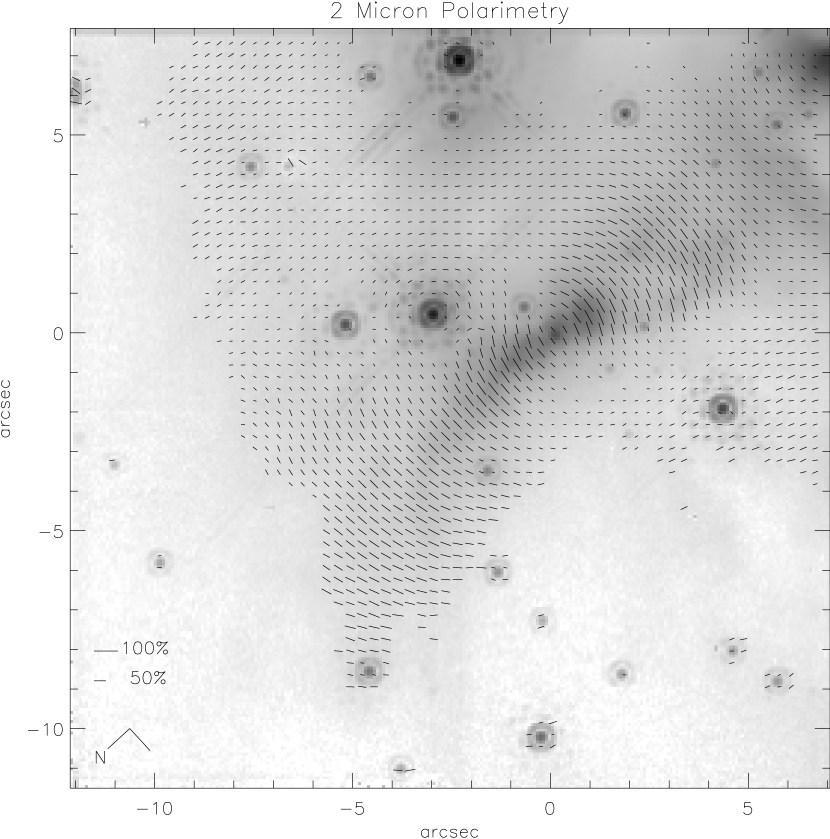
We present the polarimetric imaging results in Figures 1 and 2. In Figure 1 we present gray scale images of the fractional polarization and the polarized flux (fractional polarization times total intensity). In Figure 2 we present the polarization pseudo-vectors overlaid on a gray scale image of the total intensity image measured through the polarizers (see image captions for details). The measured polarization levels in the field are remarkably high and reach a maximum value of 79% and 75% in the north and south lobes, respectively, of the bipolar nebulosity which is located near the center of the field. The polarization levels along the bipolar nebula in the field is shown in Figure 3 (the location of the slice is indicated in Figure 6 by the line AB which is discussed below). The polarization properties have been calculated after rebinning the raw data into 2x2 pixel bins.
The errors in the measured polarization levels and the polarization angle are functions of both the intrinsic polarization levels, , and the signal to noise (S/N) of the individual polarizer images. Signal to noise levels are throughout most of the field and in the regions of the bright bipolar nebulosity. From the error analysis in SA1999 and HSS2000 we find for and an uncertainty in of and a dispersion in the position angle, . For a and with no flat field problems, and . Flat field residuals add an error and a conservative estimate will be a factor of two increase with and .
The high degrees of polarization observed in our NICMOS images are not commonly measured from the ground and are made possible by the high spatial resolution afforded by NICMOS/HST. With a native NIC2 camera resolution of 0.076″/pixel for our 2m observations and a measured FWHM of 0.175″, the effective resolution after binning the data into 2x2 pixel bins is 0.35″(see Table 1). Ground based observations of the AFGL437 field were made by WK1996 and the highest value of linear polarization that they measured was consistent with the lower spatial resolution () of their images. Similar ground-vs-HST/NICMOS “beam-depolarizing” effects were seen in observations of the Egg Nebula (Sahai et al. 1998).
The imaged field consists of many point sources and extended emission. The bright point source near the center of the field is AFGL437N and near the top of the image is AFGL437W (see Figure 2). The source between the lobes of the bipolar nebulosity is WK34. The nebulosity in the field is composed of a few main components. Centered on WK34 is an elongated narrow bipolar nebulosity extending in the N-S direction. The northern end of this bipolar structure veers slightly towards the east. The southern end of this bipolar nebulosity is seen to end in an east-west ”ridge” of higher surface brightness emission just north of AFGL437S. Small patches of nebulosity also surround AFGL437N, S and W.
In Figure 1 we see that the the bipolar nebulosity contains the most highly polarized emission. The bipolar nebulosity is also the most prominent object in the polarized flux image (where polarized flux is the total intensity image multiplied by the image of fractional polarization). Most of the polarization pseudo-vectors, shown in Figure 2, form a centrosymmetric pattern around the center of the bipolar nebula. These pseudo-vectors deviate from centrosymmetry and align in an E-W direction within a few arcseconds of the nebular waist. The polarization levels also drop to nearly zero a few arcseconds to the east and west of the nebular center.
Less pronounced centrosymmetric patterns are apparent around AFGL437N and, to a lesser degree, AFGL437S, which lies just to the south of the observed field. The polarization levels in these regions, , are much lower than surrounding WK34. The polarization pseudo-vectors align along the ”ridge” of high surface brightness in the image at the intersection of the centrosymmetric pattern around WK34 and AFGL437S. The ”ridge” may result from an interaction between these two sources (see also section 2.2).
2.1.2 1 Polarimetry
Our 1 micron polarimetric images suffer from a low signal to noise (S/N of a few) resulting in large uncertainties in polarization and position angle. Therefore, we restrict our attention in this data set to the polarization and photometry in a circular 0.5′′ radius aperture centered on the northern lobe (the location of the aperture is shown in Figure 6). For comparison we repeat this aperture measurement on the 2 micron data. The S/N in the aperture is above 100. At 1 we measure with and at 2 we measure and . The aperture polarimetric and photometric data are summarized in Table 2. The southern lobe is contaminated by a point source which is most evident in the ratio images in the bottom row of Figure 7, particularly the F160W/F110W ratio image. This point source contributes a large fraction of the flux in the region so we ignore the polarization properties of the south lobe.
2.2 Broad Band Images
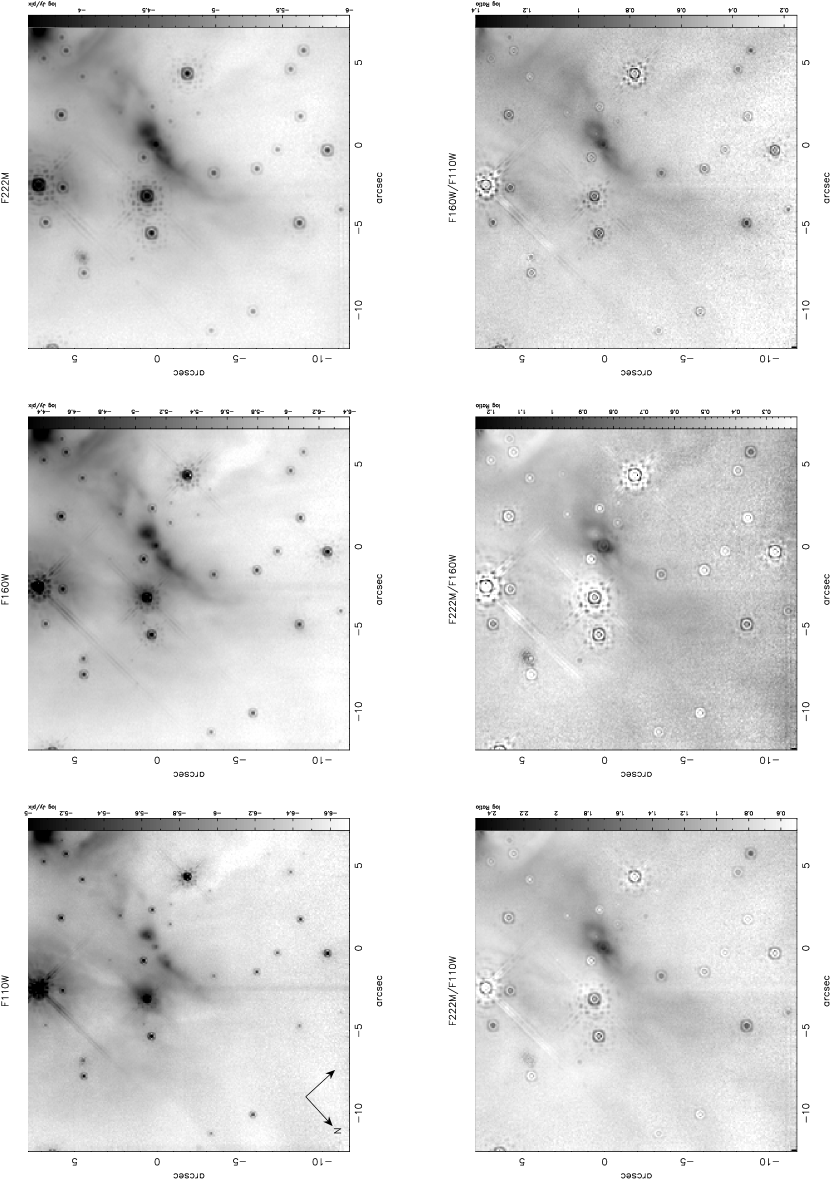
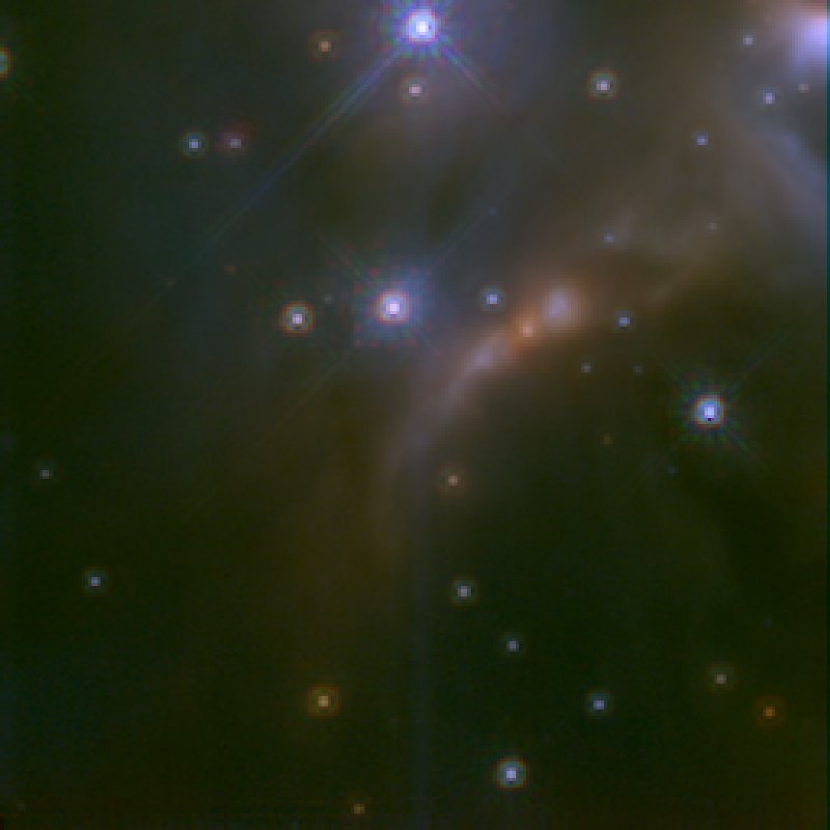
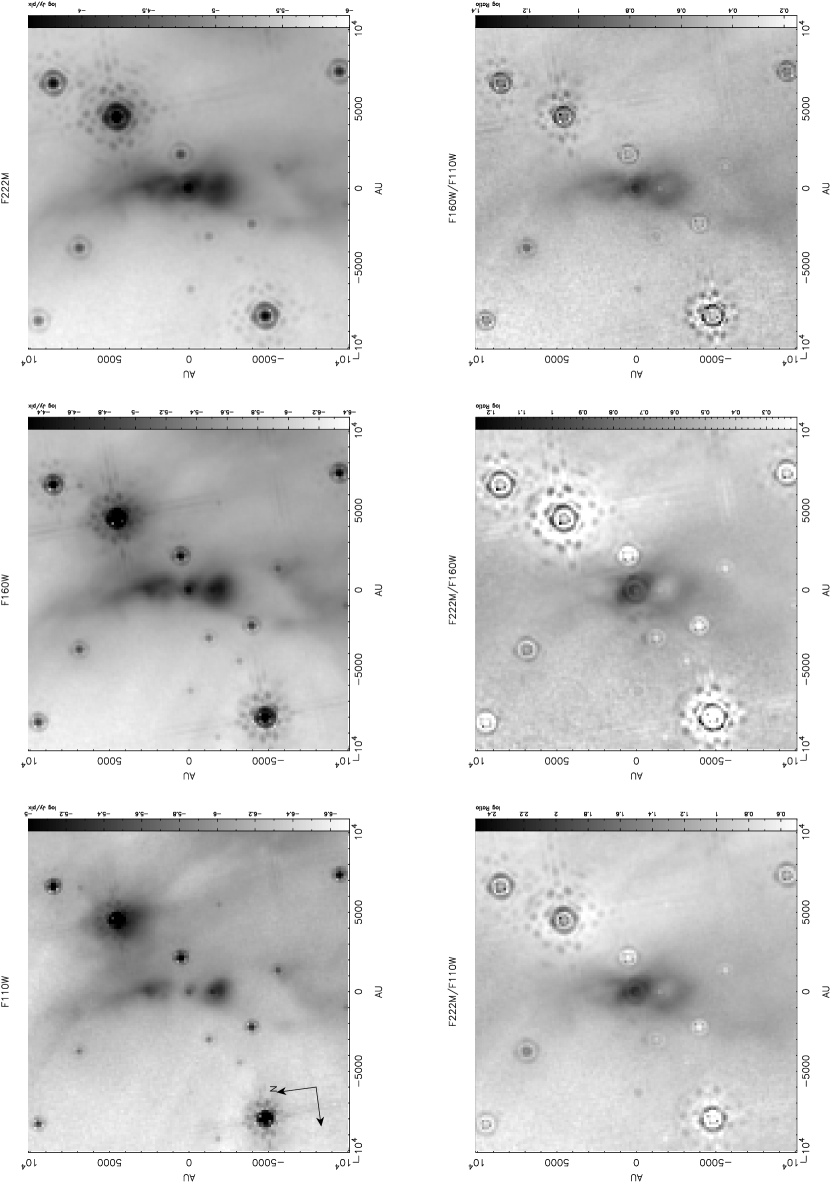
In Figure 4 we present gray scale images of the intensity measured though the F110W, F160W and F222M filters as well as the flux ratio images for the filter combinations F222M/F110W, F222M/F160W and F160W/F110W. In Figure 5 we present a three color composite image of the camera 2 data.
The point sources and reflection nebulosity display a large range of flux ratios. The nebulosity near the bright sources AFGL437N, S and W is relatively blue within the field and has an F222M/F110W flux ratio of 10. Cohen and Kuhi (1977) found that the optical spectra of the extended emission in a aperture centered on AFGL437N and S is consistent with slightly reddened ( B5 stars. We detect several faint, very red point sources in our field that were not detected in the WK1996 data of the same region.
The nebulosity associated with WK34 is extremely red with an F222M/F110W intensity ratio as high as 100 indicating either a high degree of extinction towards this nebulosity or an illuminator with an intrinsically very red spectral energy distribution. Details of the WK34 reflection nebulosity are presented in Figure 7 with axes labeled in AU assuming a distance of 2 kpc. Figure 6 indicates the region and orientation of this closeup view relative to the whole field. The data in Figure 7 has been rotated such that the principle axis of the bipolar nebulosity lies vertically. We fit this axis to the inner of the nebulosity where the axial symmetry is highest. We constrained the axis to go through WK34 and the intensity peaks in the north and south lobes. The position angle we fit is 100o east through north. We over plot this axis on the F222M intensity image in Figure 6 as line AB and its perpendicular as line CD.
An abrupt change in color is seen across an east-west “ridge” of brighter emission in the southern end of the field (see the F160W image in Figure 4 at the offset position (5.0,5.0) and compare with the color composite image in Figure 5). The nebulosity north of the “ridge” is a relatively red feature in the field, consistent with it being illuminated by WK34, while just south the nebulosity is much bluer consistent with the B5 spectrum of AFGL437S. Patchy and filamentary dark features, possibly dust patches, are also apparent in the intensity and flux ratio images.
3 Discussion
The most striking feature in the observed field is the bipolar reflection nebulosity extending in the N-S direction near the center of the field. It dominates the polarization and the polarized flux images (Figures 1 & 2). In this section we discuss this prominent bipolar nebula and the source near its center, WK34. Complementary contour plots of the region centered on the WK34 source (Figure 7) are presented in Figure 8. In the following subsections we discuss the nature of the illuminating source and the underlying mass distribution which gives rise to the reflection nebulosity.
3.1 The Illuminating Source
The polarization levels measured in the bipolar lobes are the highest in the entire field with values in the north and south lobes of 793% and 753%, respectively. The centrosymmetric polarization pseudo-vectors which surround the center of this nebulosity together with the very high percentage polarization suggests that this nebulosity is being illuminated by a single source at its center and that much of the illuminators light is singly scattered at near right angles into our line of sight and have traversed optically thin paths.
The geometry of single scattering allows us to calculate the position of the illuminating source in the bipolar nebulosity by centroiding the normals to the polarization pseudo vectors. This works because an unpolarized photon scattering from a small particle (such as a dust grain) acquires linear partial polarization in a direction perpendicular to the scattering plane (the plane containing the paths of the incident and scattered photons). We carried out a procedure to locate the illuminating source described in Weintraub et al. (2000a). We used only those pixels with and a for our centroiding calculation. The position that we find for the illuminating source using this method is within 2 pixels () of the centroid of the unresolved PSF at the equator of the bipolar object, i.e., WK34. This result strongly supports the original suggestion by WK1996 that this source is indeed illuminating the nebulosity. Furthermore, since we see an unresolved point source at this location it is very likely that we are imaging the source directly.
3.2 The Nature of WK34
The point like source at the waist of the bipolar nebula, WK34, is seen in all of our broad band images. In both the F222M and F160W images we see the characteristic NICMOS PSF superposed on a patch of nebulosity (Figure 7). The PSF is more difficult to discern in the F110W image but an intensity peak is clearly apparent and its centroid is within a fraction of a pixel of the centroid of the PSF in the F160W and F222M images. Photometry was performed in each filter by subtracting a scaled field star PSF from the same image. The dominant source of uncertainty in this photometry arises from the difficulty in gauging a good subtraction due to the patchy distribution of background nebulosity. The WK34 photometry with conservative error estimates is summarized in Table 3.
The emission from the WK34 source, presumably a young stellar object still in the outflow epoch, is likely to arise from multiple components including a photosphere, an accretion disk, as well as heated ambient material from which the star formed. Light scattering by ambient material in the vicinity of the star is also thought likely to affect the near infrared spectrum. Model spectral energy distributions of low mass young stellar objects including these components of emission have been calculated by Adams, Lada & Shu (1987). The WK34 photometry is compatible with these models which suggests that it is a low mass, low luminosity protostar. Observations at longer wavelengths are needed for a robust measure of the bolometric luminosity of this source. Nevertheless, there is additional evidence that the WK34 source is a low luminosity protostar including: (i) that the bulk of the cluster luminosity (L=104L⊙ at 2 kpc; Parmar et al. 1987) can be accounted for by the three early B ZAMS stars present in the cluster and, (ii) that the WK34 source lacks an HII region (determined by contemporaneous NICMOS observations to be presented in another paper) indicating the lack of a hard ionizing continuum usually associated with high luminosity sources.
3.3 The Underlying Mass Distribution
Many optical and near-infrared reflection nebulae associated with low mass protostars have been successfully modeled as rotationally flattened protostellar envelopes with variously shaped evacuated cavities and an accretion disk (e.g. Whitney & Hartmann, 1993; Kenyon et al. 1993; Wood et al. 2001). Associated model SEDs have been made for a wide range of wavelengths providing a theoretical underpinning to the multiwavelength studies of YSOs (Adams, Lada & Shu, 1987). We find, however, that similar models fail to reproduce the reflection nebula associated with WK34. The most striking features which distinguish the bipolar nebula in our field are: (1) The appearance of very distinct, well separated lobes forming the bipolar nebula. (2) The distance between the intensity maximum in each lobe is separated by a large distance ( 5000 AU, for a cluster distance of 2 kpc) relative to the overall nebular size. (3) The nebular lobes are much longer than they are broad. Each of these characteristics requires a rotationally flattened envelope model with parameters outside a reasonable range, indicating the inadequacy of this model to explain our observations. For example, modeling the nebula with a rotating collapsing cloud model such as that described by Tereby, Shu & Cassen (1984) requires a centrifugal radius much larger than 2000 AU to explain the large separation between lobes, but then fails to produce the observed narrowness of the lobes. After an exhaustive study of parameter space with a single scattering radiative transfer code we find that no reasonable combination of rotating envelope, evacuated cavities and accretion disk can explain the observations adequately. The small effects of multiple scattering are likely to exacerbate the modeling by contributing extra illumination at the nebular waist.
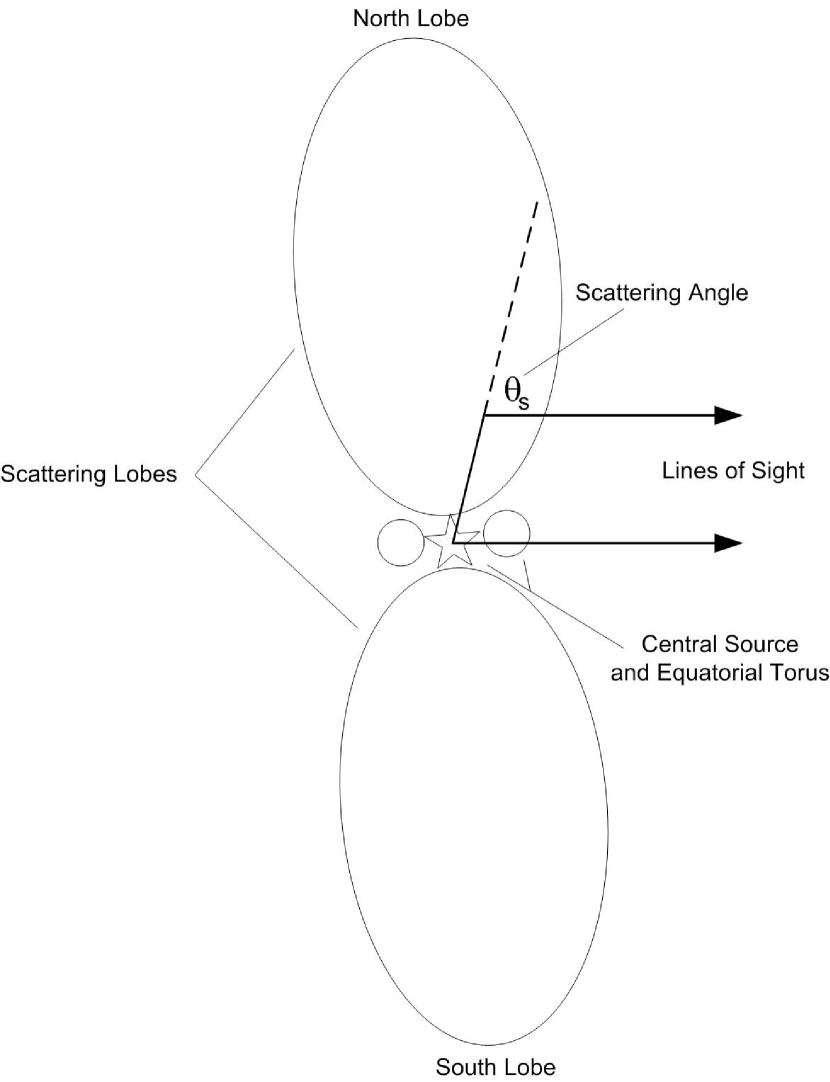
An alternative to the evacuated cavity model is one in which the bipolar reflection nebula is due to a large amount of outflow material ejected by the central source along the nebular axis. The observed bipolarity of such an outflow nebula can then be further accentuated by the presence of an obscuring torus of material surrounding the central illuminating source, perhaps the remnant of the infalling parent envelope (see schematic diagram in Figure 9). This geometry is consistent with the pattern of polarization vectors which deviate from centrosymmetry near the waist of the bipolar nebulosity where they align along the equator of the nebula (see Figure 2). This type of polarization signature has been called a “polarization disk” and has been shown to be a phenomena of multiple scatterings in the presence of an optically thick equatorial disk (Bastien & Menard, 1988; Whitney & Hartmann, 1993). This polarization signature arises on the observer side of an optically thick disk being illuminated from the bipolar lobes: we are seeing photons scattered over an optically thick disk into our line of sight. The location of the “null points”, or regions of low polarization on either side of the “polarization disk”, give us a rough estimate of the size of the optically thick disk. From Figure 2 we estimate a disk radius of 1000 AU. This pattern is common in the bipolar nebulosity associated with both YSOs as well as protoplanetary nebulae such as the Egg Nebula (Sahai et al. 1998) and OH231.8+4.2. The latter object, also known as the Rotten Egg Nebula because of its sulfur content, is one of the few other astronomical objects with measured infrared polarization levels as high as those presented here (Ageorges & Walsh 2000; Meakin et al. 2003).
The high levels of observed polarization constrain the size of dust particles responsible for scattering. The grain model proposed to explain the extinction in molecular clouds by KMH is only capable of polarizing 2m light to a maximum of 70% (Weintraub, Goodman, & Akeson, 2000b). This is due to a component of large particles in the grain size distribution of this model. It is likely that the particles in the reflection nebula observed here are composed mainly of particles much smaller than the observed wavelength. The existence of small particles in the outflow lobes may be related to the outflow mechanism. Dust grains may be selectively accelerated into the outflow material based on size, or they may be processed by shocks or photodisentegration processes which occur during the star formation process.
3.3.1 Physical Parameter Estimates
The relationship between the scattering optical depth through the lobe and the density is where is the average lobe dust density, is the line of sight extent of the nebula, and is the scattering opacity. If we assume that the nebula is optically thin, , we have:
| (1) |
From Figure 8 we estimate a total lobe thickness AU, assuming that the nebula is roughly cylindrical and that the 2m intensity image traces its extent. The mass scattering opacity for a spherical dust grain with radius is,
| (2) |
where is the density of the material composing the dust, is the extinction efficiency (proportionality between geometric cross section and extinction cross section), and is the dust albedo (ratio between scattering and extinction cross section). Both and depend on the optical constants of the dust material and the ratio of the particle size to the wavelength. For the “astronomical silicates” and the graphite materials described by Draine & Lee (1984) and for particle sizes ranging between 0.1 and 1 m, at near infrared wavelengths the product varies from close to zero to a few. We therefore expect a scattering mass opacity to be of order cm2 g-1 for material density (in g cm-3) and particle size (in microns) both of order unity. The average mass density of dust grains in the nebula for a line of sight through the nebular lobes where will then be of order g cm-3.
In the optically thin scattering limit, the intensity variation along the line of sight is proportional to the line of sight scattering optical depth and the flux from the central illuminating source which is , modulo any internal extinction between the source and the scattering location. The scattered light intensity variation with distance from the central source is then expected to vary as,
| (3) |
where is the distance between the central source and scattering location. The intensity variation along the nebular axis is plotted in Figure 10 on a log-linear and log-log plot. The intensity is seen to drop off with distance from the central source with a roughly power law dependence, with -3.0 for . Assuming that the lobe depth, , is roughly constant in the scattering lobe then the inferred average line of sight dust density decreases inversely with distance from the central source, .
Integrating this distribution the dust mass in the scattering lobe is,
| (4) |
where the integration is taken between and , a lobe width of AU is used, and is taken as our previous order of magniture estimate, g cm-3. Inferring the total mass in the lobes requires knowledge of the gas to dust mass ratio, which may be much larger than the canonical value of 100 in the diffuse ISM due to grain destruction processes that may be occurring in the outflow.
A great deal more information can be garnered from the infrared data presented in this paper by comparing it to observations at other wavelengths. For instance, high resolution CO observations of the nebula can provide a more robust map of the underlying mass distribution as well as the velocity structure. The velocity of the material can be used to test the hypothesis that we are seeing an outflow nebula, as opposed to an illuminated evacuated cavity. The combination of a molecular map and near infrared scattered light images at comparable resolution should be able to provide strong constraints on the nature of the dust particles in the outflow by providing more robust estimates of mass opacities. Dust properties may be varying strongly with location in the nebula due to the interaction of the outflow with the ambient cloud material through shocks and photodissociation processes. These processes play an important role in the life cycle of dust in the universe, and may be potentially useful probes of the outflow mechanism operating in YSOs.
3.3.2 Nebular Inclination
We conclude this section with a comment on the nebular inclination, noting that asymmetries in the morphology between the north and south lobes can be used as a constraint. It is a general feature of bipolar reflection nebula with mass distributions that have equatorial density enhancements that for small inclinations (out of the plane of the sky) the lobe tilted towards the observer has (1) a higher surface brightness, (2) is broader, and (3) peaks closer to the central illuminating source. These features arise from the relative amounts of obscuration caused by the equatorial material in projection against the illuminated lobes. All three of these features can be clearly seen in the contour plots presented in Figure 8 and the intensity profile in Figure 10 indicating that it is the south lobe that is tilted towards the Earth.
3.4 Interaction with Environment
Although the beam size in the 12CO J=(2-1) maps of Gomez et al (1992) is comparable to the size of the entire NICMOS field of view, interesting correlations in morphology exist between these two data sets. A finger of high intensity emission is discernible in the CO maps which is aligned with the WK34 bipolar nebulosity. This finger of CO emission sweeps off towards the east, as though an extension of the similarly shaped infrared nebulosity seen in our images. The observed near infrared reflection nebulosity traces the polar axis of a fairly well collimated outflow emanating from WK34 on scales of AU. The ambient gas in the region may be redirecting the northern part of this outflow towards the east. This might explain why the geometric center of the large scale molecular outflow does not lie directly over the infrared cluster. The connection between the bipolar nebulosity and the larger scale outflow is further reinforced by the fact that the inclination of WK34 implied by the morphology of the infrared nebulosity (S lobe tilted toward Earth) is consistent with the orientation of the large scale molecular outflow (S lobe is blue shifted).
4 Summary & Conclusions
We have presented high resolution polarimetric and broad band images of the infrared cluster in AFGL437 which reveals a well collimated bipolar nebula. Our polarization measurements show that this nebula is being illuminated by predominantly one source, WK34. Photometry for this source is consistent with it being a low luminosity protostar. We note the following additional results. (1) A dust model that contains too many large (m) dust particles, such as the KMH dust model which is successful in describing molecular cloud extinction, is inconsistent with the levels of polarization that we observe in the reflection nebulosity observed here. This indicates that the population of dust grains is composed mainly of smaller particles. (2) The equator of the observed bipolar nebula coincides with a “polarization disk” similar to that seen in other protostars and protoplanetary nebulae. This feature arises from the presence of an optically thick, nearly edge of torus of material. (3) The observed bipolar nebula resides near the center of a much larger scale bipolar CO outflow. We find that the inclination and alignment of the smaller scale, near-infrared bipolar nebula is similar to the cluster scale CO outflow. (4) The bipolar morphology, high aspect ratio (length to width), and high degrees of linear polarization of the near infrared nebulosity that we have observed cannot be reproduced with a collapsing envelope and evacuated cavity model which has been successful in explaining the near infrared nebulae associated with many other embedded YSOs.
From these points we are led to a picture of AFGL437 in which a low luminosity protostar is the source of a well collimated axisymmetric bipolar outflow of gas and dust that is being illuminated by the central source. The lobes contain a low density population of small grains that scatter (thus polarizing) light from the central star. The small dust grains in the outflow which differ from those typical of molecular clouds are likely a result of processes occurring near the protostar.
References
- (1) Adams, F., Lada, C.J., Shu, F. 1987, ApJ, 312, 788
- (2) Ageorges, N., & Walsh, J. R. 2000, A&A, 357, 661
- (3) Arquilla, R., & Goldsmith P.F. 1984, ApJ, 279, 664
- (4) Bastien, P. & Menard, F. 1988, ApJ, 326, 334
- Cardelli, Clayton & Mathis (1989) Cardelli, J. A., Clayton, G. C. & Mathis, J. S. 1989, ApJ, 345, 245
- (6) Cohen, M. & Kuhim L.V. 1977, PASP, 89, 829
- (7) Draine, B.T. & Lee, H.M. 1984, ApJ, 285, 89
- Goodman, Jones, Lada & Myers (1995) Goodman, A. A., Jones, T. J., Lada, E. A. & Myers, P. C. 1995, ApJ, 448, 748
- (9) Gomez, J.F., Torelles, J.M., Estalalella, R., Anglada, G., Vades-Montenegro, L. and Ho, P.T.P. 1992, ApJ, 397, 492
- (10) Hines, D.C., Schmidt, G.D., Schneider, G. 2000, PASP, 112, 983
- (11) Kenyon, S.J., Whitney, B.A., Gomez, M. & Hartmann, L. 1993, ApJ, 414, 773
- (12) Kim, S., Martin, P.G. and Hendry, P.D. 1994, ApJ, 422, 164
- (13) Mathis, Rumpl & Nordsieck, K.H., 1977, ApJ, 217, 425 (MRN)
- (14) Meakin, C.A., Bieging, J.H., Latter, W.B., Hora, J.L, Tielens, A.G.G.M. 2003, ApJ, 585, 482
- (15) Pendleton, Y., Tielems, A.G.G.M, & Werner, M.W. 1990, ApJ, 349, 107
- (16) Sahai, R., Hines, D.C., Kastner, J.H., Weintraub, D.A., Trauger, J.T., Rieke, M.J., Thompson, R.I, & Schneider, G. 1998, ApJL, 492, 163
- Sparks & Axon (1999) Sparks, W. B. & Axon, D. J. 1999, PASP, 111, 1298
- (18) Tereby, S., Shu, F., Cassen, P. 1984, ApJ, 286, 529
- Thompson et al. (1998) Thompson, R. I., Rieke, M., Schneider, G., Hines, D. C. & Corbin, M. R. 1998, ApJ, 492, L95
- Thompson et al. (1999) Thompson, R. I., Storrie-Lombardi, L. J., Weymann, R. J., Rieke, M. J., Schneider, G., Stobie, E. & Lytle, D. 1999, AJ, 117, 17
- (21) Torelles,J.M., Gomez, J.F., Anglada, G., Estalallela, R., Mauersberger, R. and Eiroa, C. 1992, ApJ, 392, 616
- (22) Weintraub, D. A. & Kastner, J. H. 1996a, ASP Conf. Ser. 97: Polarimetry of the Interstellar Medium, 345
- (23) Weintraub, D., Kastner, J.H., Gatley, I., Merill, K.M. 1996b, ApJL, 468, 45
- (24) Weintraub, D., & Kastner, J.H., 1996c, ApJ, 458, 670
- (25) Weintraub, D.A., Kastner, J.H., Hines, D.C., & Sahai, R. 2000a, ApJ, 531, 401
- (26) Weintraub, D. A., Goodman, A. A. & Akeson, R. L. 2000b, Protostars and Planets IV (Book - Tucson: University of Arizona Press; eds Mannings, V., Boss, A.P., Russell, S. S.), p. 247, 247
- Werner, Capps & Dinerstein (1983) Werner, M. W., Capps, R. W. & Dinerstein, H. L. 1983, ApJ, 265, L13
- (28) Whitney, B. and Hartmann, L. 1993, ApJ, 402, 605
- (29) Wood, K., Smith, D., Whitney, B., Stassun, K., Kenyon, S.J., Wolff, M.J., & Bjorkman, K.S. 2001, ApJ, 561, 299
- (30) Wynn-Williams, C.G., Becklin, E.E., Beichman, C.A., Capps, R. & Shakeshaft, J.R. 1981, ApJ, 246, 801


| Cameraa | Filter | Phot.Const.b | rms noisec | FWHMc | |
|---|---|---|---|---|---|
| - | - | Jy / (ADU s-1) | Jy | arcsec | |
| NIC1 | F160W | 0.4000 | 2.393566 | 0.04 | 0.12 |
| NIC2 | F110W | 0.5920 | 1.823290 | 0.023 | 0.09 |
| NIC2 | F160W | 0.4030 | 2.070057 | 0.03 | 0.14 |
| NIC2 | F222M | 0.1432 | 5.280848 | 0.16 | 0.175 |
| NIC1 | POL0S | 0.4750 | 6.995908 | 0.04 | 0.10 |
| NIC1 | POL120S | ” | 6.912439 | ” | ” |
| NIC1 | POL240S | ” | 6.914314 | ” | ” |
| NIC2 | POL0L | 0.2025 | 7.626095 | 0.2 | 0.175 |
| NIC2 | POL120L | ” | 7.529697 | ” | ” |
| NIC2 | POL240L | ” | 7.516947 | ” | ” |
| Filter | I | P | |
|---|---|---|---|
| Jy | % | deg. | |
| POL-S (1 ) | 4.87 | 45 3 | 24 1 |
| POL-L (2 ) | 7.0 | 65 3 | 28 1 |
| Units | F222M NIC2 | F160W NIC2 | F110W NIC2 | |
|---|---|---|---|---|
| WK34 | Jy | 2.30 | 2.89 | 5.54 |
| Fν (North) | Jy pix-1 | 0.8610-4 | 2.3210-5 | 3.8410-6 |
| Fν (South)aaThe platescale for NIC1 is 0.043″pix-1 and NIC2 is 0.076″pix-1.A 0.5 ″radius aperture centered on northen lobe of bipolar nebulosity (see Figure 4). | Jy pix-1 | 1.2910-4 | 3.5110-5 | 7.375210-6 |
Note. — The photometry for the north and south lobes is taken as the peak value in each lobe.