High-speed, multi-colour optical photometry of the anomalous X-ray pulsar 4U 0142+61 with ULTRACAM
Abstract
We present high-speed, multi-colour optical photometry of the anomalous X-ray pulsar 4U 0142+61, obtained with ULTRACAM on the 4.2-m William Herschel Telescope. We detect 4U 0142+61 at magnitudes of , and , consistent with the magnitudes found by Hulleman et al. (2004) and hence confirming their discovery of both a spectral break in the optical and a lack of long-term optical variability. We also confirm the discovery of Kern & Martin (2002) that 4U 0142+61 shows optical pulsations with an identical period ( s) to the X-ray pulsations. The rms pulsed fraction in our data is %, 5–7 times greater than the 0.2–8 keV X-ray rms pulsed fraction. The optical and X-ray pulse profiles show similar morphologies and appear to be approximately in phase with each other, the former lagging the latter by only cycles. In conjunction with the constraints imposed by X-ray observations, the results presented here favour a magnetar interpretation for the anomalous X-ray pulsars.
keywords:
pulsars: individual: 4U 0142+61 – stars: neutron1 Introduction
More than 100 X-ray pulsars are currently known. The vast majority of these are found in low-mass and high-mass X-ray binaries (LMXBs and HMXBs), and are hence powered by accretion onto a rotating, magnetised neutron star. There exists a small group of 8 X-ray pulsars, however, that exhibit properties very much at variance with those of the accreting pulsars in X-ray binaries. These so-called Anomalous X-ray Pulsars (AXPs) all have s spin periods which decrease steadily with time, soft (and relatively low-luminosity) X-ray spectra, no radio emission, and tend to be associated with supernova remnants in the galactic plane. Most importantly, the AXPs show no evidence of a binary companion. For a recent review of AXPs, see Woods & Thompson (2004).
This latter fact prompted a variety of models based on isolated neutron stars and white dwarfs (see the review by Israel et al. 2002), but these run into difficulty on energetic grounds: the loss of rotational energy, which powers radio pulsars like the Crab, is orders of magnitude too small to power the observed X-ray luminosity of the AXPs. An additional energy source is therefore required, for which two competing models seem to have emerged: accretion from a fossil disc or ultra-strong magnetic fields. In the former scenario, an isolated neutron star accretes from a fossil disc, such as might be produced through fall-back of material after a supernova explosion or left over from a common-envelope phase which destroyed the companion star. In the latter scenario, AXPs are “magnetars”, isolated neutron stars with enormous ( G) magnetic fields. It is the decay of the magnetic field which heats the neutron star surface, causing it to emit thermal radiation in the X-rays. Non-thermal emission is then produced by particles accelerated in the magnetosphere by the Alfvén waves from small-scale fractures on the neutron star surface (Thompson & Duncan, 1996) or Comptonization of thermal photons by magnetospheric currents (Thompson et al., 2002).
The magnetar model has begun to dominate the literature in recent years. There are sound theoretical reasons for why this is so, as the magnetar model now appears to be able to explain the observational properties of several categories of supposedly young neutron stars that are not powered by rotation, including the AXPs and the Soft Gamma Repeaters (SGRs). Such unification is supported by the recent discovery of SGR-like bursts in AXPs (Gavriil et al. 2002; Kaspi et al. 2003), which suggests there might be an evolutionary link between AXPs and SGRs (see Mereghetti et al. 2002 and references therein).
But what other observational evidence is there to support the magnetar model of AXPs? Belief in the magnetar model rests partly on the failure of the accretion model to explain the faintness of the optical/infrared counterparts, which sets strong limits on the size of an accretion disc (e.g. Hulleman et al. 2000), and the fact that the pulsed fraction of optical light is significantly greater than it is in X-rays, ruling out reprocessing of X-rays in a disc as its origin (Kern & Martin 2002; but see Ertan & Cheng 2004). Both of these optical constraints have been obtained via observations of the brightest known AXP, 4U 0142+61. In this paper we report on new high-speed, multi-colour optical observations of this object, obtained with the aim of confirming the high optical pulsed fraction observed by Kern & Martin (2002).
2 Observations and data reduction
The observations of 4U 0142+61 presented in this paper were obtained with ULTRACAM (Dhillon & Marsh 2001, Beard et al. 2002) at the Cassegrain focus of the 4.2-m William Herschel Telescope (WHT) on La Palma. ULTRACAM is a CCD camera designed to provide imaging photometry at high temporal resolution in three different colours simultaneously. The instrument provides a 5 arcminute field on its three E2V 47-20 CCDs (i.e. 0.3 arcseconds/pixel). Incident light is first collimated and then split into three different beams using a pair of dichroic beamsplitters. For the observations presented here, one beam was dedicated to the SDSS (3543Å) filter, another to the SDSS (4770Å) filter and the third to the SDSS (7625Å) filter. Because ULTRACAM employs frame-transfer chips, the dead-time between exposures is negligible: we used ULTRACAM in its two-windowed mode, each of pixels, resulting in an exposure time of 0.48 s and a dead-time of 0.025 s. A total of 30 618 and 31 304 frames of 4U 0142+61 were obtained on the nights of 2002 September 10 and 12, respectively, with each frame time-stamped to a relative accuracy of better than 50 s using a dedicated GPS system.111The absolute timing accuracy of ULTRACAM was verified with contemporaneous observations of the Crab pulsar. Our observed time of optical pulse maximum was found to agree with the ephemeris of Lyne et al. (2005) to better than 1 millisecond (the quoted error in the Crab pulsar ephemeris during September 2002). Both sets of data were obtained in photometric conditions, with no moon and -band seeing of 0.75 and 0.65 arcseconds on 10/09/02 and 12/09/02, respectively.
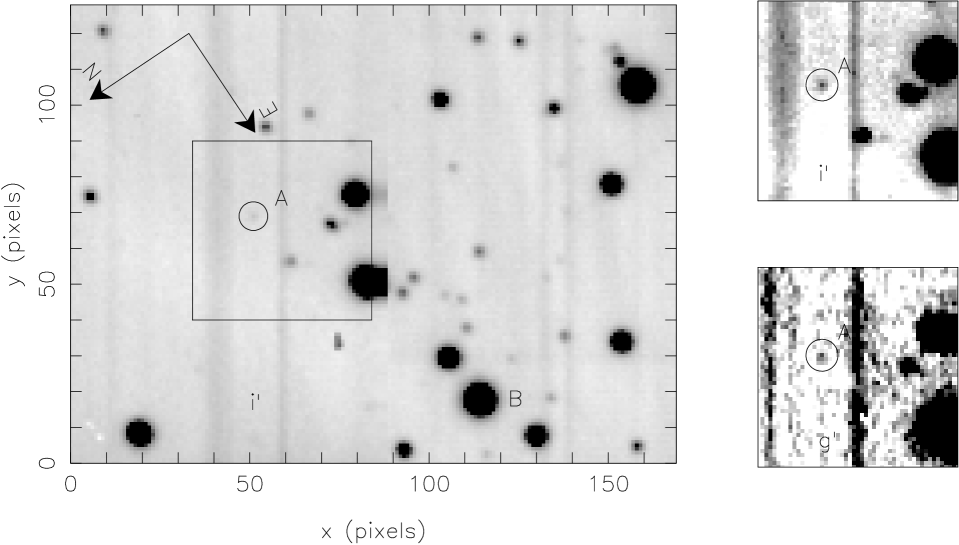
A portion of the summed image from the night of 12/09/02 is shown in figure 1. The vertical streaks are due to light from bright stars falling on the active area of the chip above the CCD windows. The data we obtained on 10/09/02 (not shown in figure 1) suffer from streaks passing through the position of 4U 0142+61, increasing the background noise level significantly. As a result, we rotated the Cassegrain rotator in advance of our observations on 12/09/02 so that no streaks passed through 4U 0142+61. For this reason, the data obtained on 12/09/02 are of a much higher quality than the data obtained on 10/09/02. Note that the vertical streaking problem has since been rectified in ULTRACAM by provision of an adjustable focal-plane mask which blocks the light from bright stars (and the sky) above the CCD windows (Stevenson, 2004).
The data were reduced using the ULTRACAM pipeline software. All frames were first debiased and then flat-fielded, the latter using the median of twilight sky frames taken with the telescope spiralling. We then extracted light curves of 4U 0142+61 using two different techniques:
2.1 Technique (i)
Kern & Martin (2002) obtained their light curve of 4U 0142+61 by synchronising the CCD clocks in their camera to the X-ray spin period of 4U 0142+61, resulting in the accumulation of 10 on-chip phase bins. This has the advantage of reducing detector noise, but the potential disadvantage that a period must be assumed before the data have been taken and, if the period is wrong, the true pulse profile is unrecoverable.
| BMJD range | |
|---|---|
| TOA arrival points | 79 |
| (Hz) | 0.11509507445(18) |
| ( Hz s-1) | –2.66478(36) |
| ( Hz s-2) | 5.08(23) |
| Epoch (BMJD) | 52 506.9748874274228 |
| rms residual (cycles) | 0.031 |
To mimic the Kern & Martin (2002) technique, we assumed a spin period for 4U 0142+61 on 12/09/02 of 8.688473130 s, which was calculated from the updated X-ray ephemeris given in table 1. Note that this ephemeris spans our WHT observations and is hence more reliable for our purposes than using the ephemeris of Gavriil & Kaspi (2002) adopted by Kern & Martin (2002). Each ULTRACAM data frame was then added to one of 10 evenly-spaced phase bins covering the spin cycle of 4U 0142+61, resulting in 10 high signal-to-noise data frames. An optimal photometry algorithm (Naylor, 1998) was then used to extract the counts from 4U 0142+61 and a bright comparison star 24 arcseconds to the east of the AXP (see figure 1), the latter acting as the reference for the profile fits and transparency-variation correction. The position of 4U 0142+61 relative to the comparison star was determined from a sum of all the images, and this offset was then held fixed during the reduction so as to avoid aperture centroiding problems. The sky level was determined from a clipped mean of the counts in an annulus surrounding the target stars, and subtracted from the object counts.
2.2 Technique (ii)
The second approach we took to light curve extraction was identical to that described above, except that we omitted the phase-binning step and simply performed optimal photometry on the 61922 individual ULTRACAM data frames. In other words, we made no assumption about the spin period of 4U 0142+61.
3 Results
3.1 Magnitudes
We were unable to detect 4U 0142+61 in , at a detection limit of . We did, however, clearly detect it in and on both nights at magnitudes of and , as shown in figure 1. Hulleman et al. (2004) measured and (where we have converted their Johnson-Morgan-Cousins magnitudes to SDSS magnitudes using the transformation equations of Smith et al. 2002), indicating that 4U 0142+61 was approximately the same magnitude during our observations.
3.2 Pulse profiles
The two data reduction techniques described in section 2 result in two different pulse profiles for 4U 0142+61.
3.2.1 Technique (i)

The first technique produced the pulse profiles shown in the top panel of figure 2. As expected, the light curve of 12/09/02 is of a significantly higher quality than that of 10/09/02, but both show approximately the same morphology as the optical pulse profile presented by Kern & Martin (2002), exhibiting a broad (arguably double-humped) structure with peaks around phases 0.65 and 1.15 and a minimum around phase 0.35. These phases are different to the corresponding phases in the pulse profile of Kern & Martin (2002), but this is to be expected given that, as discussed by Kern & Martin (2002), their optical observations were obtained outside the span of the ephemeris they used and the source does exhibit some timing noise (Gavriil & Kaspi, 2002). Our timing solution, on the other hand, is based on the updated ephemeris for 4U 0142+61 presented in table 1, which spans our WHT observations and is hence reliable.
There is some similarity in the morphologies of the optical pulse profile shown in the top panel of figure 2 and the 2–10 keV X-ray pulse profile shown below it, where the latter is an updated version of the data presented by Gavriil & Kaspi (2002). Both profiles share a similar broad/double-humped morphology. Moreover, since the X-ray light curve shown in figure 2 has also been phased using the ephemeris given in table 1, it can be seen that the optical and X-ray pulse profiles are approximately in phase with each other. To quantify this, the optical pulse profile was cross-correlated with the X-ray pulse profile. The resulting peak in the cross-correlation function was fitted with a parabola to derive a shift of cycles (i.e. s), where a positive phase shift implies that the optical pulse profile lags the X-ray pulse profile. This result is only marginally significant (at the 2 level), due to the low signal-to-noise and time resolution of the optical data, and additional data will be required in order to confirm that the phase shift is significantly different from zero (discounting the unlikely situation in which the time delay is approximately equal to some multiple of the spin period).
The modulation amplitude of the pulses presented in figure 2 can be measured using a peak-to-trough pulsed fraction, , defined as follows:
| (1) |
where and are the maximum and minimum flux in the pulse profile, respectively. We find a value of % on 12/09/02, higher than the pulsed fraction of derived by Kern & Martin (2002), although the difference between the two values is only marginally significant (, i.e. ). There are a number of factors which might contribute to a higher optical pulsed fraction in our data:
-
•
The pulsed fraction measured from our data refers to the band, whereas that of Kern & Martin (2002) is for white light (4000–10000Å). If the optical pulsed fraction varies with wavelength, this could be the source of the discrepancy. Note that our data were too faint to extract a pulse profile from, unfortunately, so we are not in a position to test this explanation.
-
•
Even a small error in the assumed period on which the data is phase-binned can result in a smearing of the pulse profile and hence a reduction in the measured pulsed fraction. We have simulated this effect and find that to reduce our pulsed fraction to the level observed by Kern & Martin (2002), the period must be in error by greater than s. This is three orders of magnitude greater than the timing accuracy achieved by the instrumentation used by Kern & Martin (2002) and hence an error in the period used to phase bin the data is an unlikely source of the discrepant pulsed fractions.
-
•
The higher pulsed fraction in our data might be due either to a decrease in the unpulsed optical component or an increase in the pulsed optical component. Hulleman et al. (2004) found no evidence for long-term -band variability in 4U 0142+61, down to a 2- limit of 0.09 magnitudes, and our magnitude estimates (section 3.1) appear to support this conclusion. Note, however, that Hulleman et al. (2004) did find long-term variability of magnitude in their -band observations of 4U 0142+61, which they tentatively attributed to the occurence of SGR-like bursts in 4U 0142+61. X-ray observations of this source have not shown such bursts, but this might be due to their (expected) low amplitude and the efficiency of the X-ray monitoring.
-
•
The peak-to-trough pulsed fraction defined in equation 1 effectively adds any noise present in the light curve to the true pulsed fraction, thereby tending to increase the resulting measurement. A more robust estimate is given by the root-mean-square (rms) pulsed fraction, , defined as follows:
(2) where is the number of phase bins per cycle, is the number of counts in the phase bin, is the error on and is the mean number of counts in the cycle. As expected, measuring the optical pulsed fraction in this way gives a lower value of %. This is much closer to the value derived by Kern & Martin (2002), but it should be stressed that these authors measured the peak-to-trough pulsed fraction (equation 1), not the rms pulsed fraction (equation 2).
-
•
The higher pulsed fraction in our data could be due to some systematic problem with the sky subtraction. We consider this to be unlikely, however, as one would not then expect our magnitude estimates to agree with those of Hulleman et al. (2004).
3.2.2 Technique (ii)

The second data reduction technique (section 2.2) can be used to provide a check on the reliability of the optical pulse profile shown in figure 2. To do this, it is first necessary to fold the extracted light curve on the pulse period. Rather than do this by adopting the X-ray ephemeris given in table 1, as we did in figure 2, we can instead determine the pulse period directly from our optical data using a periodogram and then fold the data on this period.
Figure 3 shows the Lomb-Scargle periodograms (Press & Rybicki, 1989) for the 30 618 and 31 304 points in the light curves obtained on 10/09/02 and 12/09/02, respectively. The light curves were unfortunately too noisy to perform such an analysis. The light curves were first corrected for transparency variations and then detrended by subtracting their mean level. The highest peak in the resulting periodogram of 12/09/02 occurs at a period of s, where the error is given by the width () of a Gaussian fit to the peak in the periodogram. This period is consistent with the X-ray pulse period given in table 1. Although noisier, an equivalent peak is also present in the periodogram of 10/09/02, with a period of s, thereby confirming that we have indeed detected the X-ray pulsation of 4U 0142+61 in the optical. We further tested the robustness of our period detection by constructing 10000 randomised light curves from the original light curves by randomly re-ordering the -axis points. Only 0.12% of the resulting 10000 periodograms for the 12/09/02 dataset showed a higher peak at 8.687 s, and only 0.38% showed a higher peak at 8.688 s in the 10/09/02 dataset.
Folding the light curve of 12/09/02 on the derived optical pulse period of 8.687 s gives the pulse profile shown in figure 4. The same data folded on the X-ray pulse period of 8.688473130 s is shown for comparison. Note that the phasing of both profiles can be directly compared to that in figure 4, as all of the data were folded using the zero point given in table 1.
As one would expect, the -data folded on the X-ray pulse period (dotted line in figure 4) is in excellent agreement with that presented in figure 2, in terms of morphology, phasing and pulsed fraction (%). The -data folded on the optically-determined pulse period (solid line in figure 4) shares approximately the same phase of pulse maximum and pulsed fraction (%), but the morphology is slightly different. In particular, the shape and phase of pulse minimum is very different, This is to be expected, however, given that the data have been folded on the optically-derived period of 8.687 s, which is much less accurate than the X-ray period due to the lower quality of the optical data.

4 Discussion and conclusions
Using two different data reduction techniques we have shown that the optical light from 4U 0142+61 pulsates on the X-ray period, thereby confirming the discovery of Kern & Martin (2002). The morphologies of the 2–10 keV and pulse profiles are quite similar, both exhibiting a broad/double-humped structure. The optical lags the X-rays by only cycles ( s), i.e. there is no strong evidence for a phase shift between the two pulse profiles. The most reliable value we have derived for the optical pulsed fraction is %, as this is the more robust rms figure (as opposed to the peak-to-trough value) and has been obtained by folding the best dataset, that of 12/09/02, on the accurately known X-ray period (see figure 1). The X-ray pulsed fraction of 4U 0142+61 cannot be measured from the X-ray pulse profile shown in figure 2, unfortunately, as the background level (i.e. the minimum flux) in these data is unrelated to the pulsar. This is because the X-ray data were obtained with the Proportional Counter Array (PCA) on the Rossi X-ray Timing Explorer (RXTE), which has approximately a 1∘ field of view and no imaging capability. Instead, we turn to the work of Patel et al. (2003), who reported X-ray pulsed fractions for 4U 0142+61 of % between 0.2–1.3 keV, % between 1.3–3.0 keV and % between 3.0–8.0 keV; Patel et al. (2003) also quote corresponding peak-to-trough pulsed fractions of %, % and %. These values demonstrate that the optical rms pulsed fraction we have measured is 5–7 times greater than the X-ray rms pulsed fractions, consistent with the factor of 5–10 times derived by Kern & Martin (2002) from their peak-to-trough pulsed fraction measurements.
We have measured and magnitudes consistent with the magnitudes found by Hulleman et al. (2004), supporting their finding that, although variable in the infrared and X-rays, 4U 0142+61 does not appear to show long-term variability in the optical part of the spectrum. Moreover, the fact that we have used the and magnitudes of Hulleman et al. (2004) to derive a magnitude consistent with our own confirms that the spectral break between and found by Hulleman et al. (2004) is real.
The optical observations presented in this paper therefore lend additional weight to the arguments given by Hulleman et al. (2000), Kern & Martin (2002) and Hulleman et al. (2004) that the AXP’s are best explained by the magnetar model, mainly thanks to the failure of most alternative models to explain the observations (a notable exception is the disc-star dynamo gap model of Ertan & Cheng 2004). In particular, fall-back accretion disc models (e.g. Perna et al. 2000) fail because the optical flux is assumed to be due to reprocessing of the X-ray flux in the disc and therefore would not be expected to show either an optical pulsed fraction significantly in excess of the X-ray pulsed fraction (see Kern & Martin 2002) or a non-thermal spectral energy distribution in the optical. In addition, such reprocessing might also be expected to result in the optical pulses lagging the X-ray pulses in phase by an amount depending on the light-travel time to the reprocessing structure, the reprocessing timescale within it and its location with respect to the X-ray source and Earth. We have shown that there is no strong evidence for a phase shift between the optical and X-ray pulses, lending further evidence in support of the magnetar model.
Acknowledgments
We thank the referee for his valuable comments on the original manuscript. TRM acknowledges the support of a PPARC Senior Research Fellowship. SPL is supported by PPARC grant PPA/G/S/2003/00058. ULTRACAM is supported by PPARC grant PPA/G/S/2002/00092. The William Herschel Telescope is operated on the island of La Palma by the Isaac Newton Group in the Spanish Observatorio del Roque de los Muchachos of the Instituto de Astrofísica de Canarias.
References
- Beard et al. (2002) Beard S. M., Vick A. J. A., Atkinson D., Dhillon V. S., Marsh T. R., McLay S., Stevenson M. J., Tierney C., 2002, in Lewis H., ed., Advanced Telescope and Instrumentation Control Software II. SPIE, 4848, p. 218
- Dhillon & Marsh (2001) Dhillon V., Marsh T., 2001, New Astronomy Review, 45, 91
- Ertan & Cheng (2004) Ertan Ü., Cheng K. S., 2004, ApJ, 605, 840
- Gavriil & Kaspi (2002) Gavriil F. P., Kaspi V. M., 2002, ApJ, 567, 1067
- Gavriil et al. (2002) Gavriil F. P., Kaspi V. M., Woods P. M., 2002, Nat, 419, 142
- Hulleman et al. (2000) Hulleman F., van Kerkwijk M. H., Kulkarni S. R., 2000, Nat, 408, 689
- Hulleman et al. (2004) Hulleman F., van Kerkwijk M. H., Kulkarni S. R., 2004, A&A, 416, 1037
- Israel et al. (2002) Israel G. L., Mereghetti S., Stella L., 2002, Mem. Soc. Astron. Ital., 73, 465
- Kaspi et al. (2003) Kaspi V. M., Gavriil F. P., Woods P. M., Jensen J. B., Roberts M. S. E., Chakrabarty D., 2003, ApJ, 588, L93
- Kern & Martin (2002) Kern B., Martin C., 2002, Nat, 417, 527
- Lyne et al. (2005) Lyne A. G., Jordan C. A., Roberts M. E., 2005, Monthly ephemeris, Jodrell Bank Crab Pulsar Timing Results. Jodrell Bank Observatory, University of Manchester
- Mereghetti et al. (2002) Mereghetti S., Chiarlone L., Israel G. L., Stella L., 2002, in Becker W., Lesch H., Trümper J., eds, Neutron Stars, Pulsars, and Supernova Remnants MPE Report 278, p. 29
- Naylor (1998) Naylor T., 1998, MNRAS, 296, 339
- Patel et al. (2003) Patel S. K., Kouveliotou C., Woods P. M., Tennant A. F., Weisskopf M. C., Finger M. H., Wilson C. A., Göğüş E., van der Klis M., Belloni T., 2003, ApJ, 587, 367
- Perna et al. (2000) Perna R., Hernquist L., Narayan R., 2000, ApJ, 541, 344
- Press & Rybicki (1989) Press W. H., Rybicki G. B., 1989, ApJ, 338, 277
- Smith et al. (2002) Smith J. A., Tucker D. L., Kent S., Richmond M. W., Fukugita M., Ichikawa T., Ichikawa S., Jorgensen A. M., Uomoto A., Gunn J. E., Hamabe M., Watanabe M., Tolea A., Henden A., Annis J., Pier J. R., McKay T. A., Brinkmann J., Chen B., Holtzman J., Shimasaku K., York D. G., 2002, AJ, 123, 2121
- Stevenson (2004) Stevenson M. J., 2004, PhD thesis, University of Sheffield
- Thompson & Duncan (1996) Thompson C., Duncan R. C., 1996, ApJ, 473, 322
- Thompson et al. (2002) Thompson C., Lyutikov M., Kulkarni S. R., 2002, ApJ, 574, 332
- Woods & Thompson (2004) Woods P. M., Thompson C., 2004, in Lewin W. H. G., van der Klis M., eds, Compact Stellar X-ray Sources. CUP, Cambridge, in press (astro-ph/0406133)