Multiple CO lines in SMM J16359+6612 – Further evidence for a merger
Using the IRAM 30 m telescope, we report the detection of the CO(3–2), CO(4–3), CO(5–4) and CO(6–5) lines in the gravitational lensed submm galaxy SMM J16359+6612 at . The CO lines have a double peak profile in all transitions. From a Gaussian decomposition of the spectra we show that the CO line ratios, and therefore the underlying physical conditions of the gas, are similar for the blue and the redshifted component. The CO line Spectral Energy Distribution (SED; i.e. flux density vs. rotational quantum number) turns over already at the CO 5–4 transition which shows that the molecular gas is less excited than in nearby starburst galaxies and high–z QSOs. This difference mainly arises from a lower average H2 density, which indicates that the gas is less centrally concentrated than in nuclear starburst regions in local galaxies. We suggest that the bulk of the molecular gas in SMM J16359+6612 may arise from an overlap region of two merging galaxies. The low gas density and clear velocity separation may reflect an evolutionary stage of the merger event that is in between those seen in the Antennae and in the more evolved ultraluminous infrared galaxies (ULIRGs) like e.g. Mrk 231.
Key Words.:
galaxies: formation – galaxies: high-redshift – galaxies: ISM – galaxies: individual (SMM J16359+6612) – cosmology: observations1 Introduction
The intensity of the far–infrared (FIR) background indicates that
emission from warm dust contributes significantly to galaxies’
overall energy output over the Hubble time (Puget et al. puget96 (1996), Fixsen et al. fixsen98 (1998)). Recent surveys at
submm and mm wavelengths with SCUBA at the JCMT and MAMBO at the IRAM
30 m telescope have identified part of the underlying galaxy population
responsible for the strong FIR emission. Up to now several hundred
submm/mm galaxies (SMGs) have been identified (e.g. Smail et al. smail97 (1997), Bertoldi et al. bertoldi00 (2000), Ivison et al. ivison02 (2002), Webb et al. webb03 (2003), Greve et al. greve04 (2004)). These surveys,
however, are limited by confusion and therefore
only trace the bright part of the SMG luminosity function
(Blain et al. blain02 (2002)). Observations of CO, providing
valuable information on the dynamics, size and mass of the
molecular reservoirs in these objects, have only
been reported for 12 SMGs so far (e.g. Frayer et al. frayer98 (1998), Ivison et al. ivison01 (2001), Downes & Solomon
downes03 (2003), Genzel et al. genzel03 (2003), Neri et al. neri03 (2003), Greve et al. greve05 (2005)). Due to their selection
based on the mm/submm continuum, all these sources, however, are intrinsically
luminous, and not representative of the faint end
of the SMG luminosity function that dominates the FIR background.
Recently Kneib et al. (kneib04 (2004)) discovered the strongly lensed
submillimeter galaxy SMM J16359+6612
towards the galaxy cluster A 2218. This source
is lensed by the cluster into 3 discrete images and the
large magnification (14, 22 & 9 for images A, B & C respectively)
implies that its intrinsic submm flux density
( mJy, corresponding to (Kneib et al. kneib04 (2004)))
is below the confusion limit of existing 850 m surveys
( mJy, Blain et al. blain02 (2002)). It therefore
provides a unique opportunity to investigate a source which is
presumably more representative for the submm population.
Detections of CO towards SMM J16359+6612 have been reported by Sheth et al. (sheth04 (2004), CO 3–2) and Kneib et al. (kneib05 (2005), CO 3–2 &
7–6). In this letter we report on the detection of the CO 3–2, 4–3,
5–4 & 6–5 lines towards the strongest lensed component B.
For the derived quantities in this paper, we use a cosmology with
km s-1 Mpc-1, and (Spergel
et al. spergel03 (2003)).
2 Observations
Observations towards SMM J16359+6612 B were made with the IRAM 30 m
telescope during nine runs between Jan. and March 2005 in mostly
excellent weather conditions. We used the AB and CD receiver
configuration with the A/B receivers tuned to the CO(3–2)
( GHz, 3 mm band) and CO(6–5) ( GHz 1 mm band) and
C/D to CO(4–3) or CO(5–4) ( GHz, 2 mm band). The beam
sizes/antenna gains for increasing observing frequencies are
25′′/6.1 Jy K-1, 19′′/6.5 Jy K-1, 15′′/6.9 Jy K-1 and
12.5′′/7.7 Jy K-1. Typical system temperatures were
120 K, 220 K, and 270 K () for the 3, 2, and 1 mm
observations. The observations were done in wobbler
switching mode, with switching frequencies of 0.5 Hz
and a wobbler throw of in azimuth. Pointing was checked
frequently and was found to be stable to within . Calibration was
done every 12 min using the standard hot/cold–load absorber
measurements. The planets Uranus and Neptune were used for absolute
flux calibration.
We estimate the flux density scale to be accurate to about 10–15%.
Data were taken with the 1 MHz filter banks on the A/B 3mm
receivers (512 channels, 512 MHz bandwidth, 1 MHz channel spacing) and
the 4 MHz filter banks for the 2 and 1.3 mm observations (256
channels, 1 GHz bandwidth, 4 MHz channel spacing). The data were processed
with the CLASS software.
We omitted scans with distorted baselines, and only subtracted linear baselines
from individual spectra.
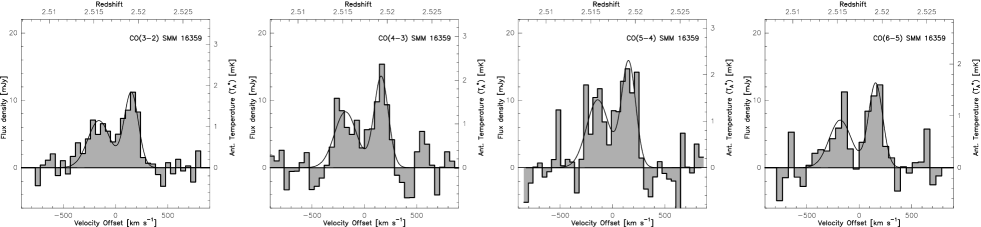
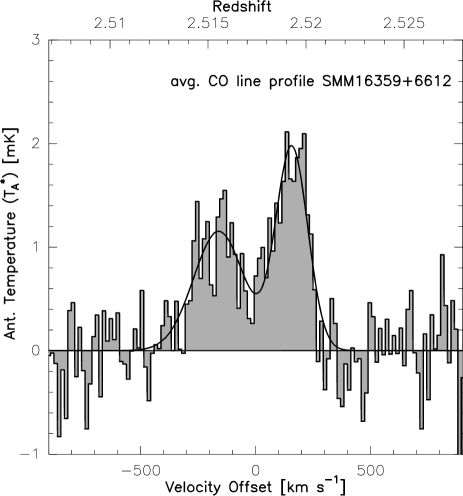
Their average was then regridded to a velocity resolution of 50 km s-1 (CO 3–2, 4–3, 5–4 ) and 55 km s-1(6–5) leading to rms noise values () of 0.26 mK (1.6 mJy), 0.47 mK (3.0 mJy), 0.6 mK (4.1 mJy) and 0.38 mK (2.9 mJy) respectively. The total observing time in the final spectra is 8.7h, 6.8h, 4.7h and 8.2h for the 3–2 to 6–5 lines, respectively. The final spectra are presented in Fig. 1. We also generated an averaged CO spectrum by averaging all individual CO transitions, with equal weight.
| blue | red | |
|---|---|---|
| v [ km s-1]a | ||
| FWHM [ km s-1] | ||
| 1 | ||
| 1 |
-
a
Center velocity relative to =2.5174 (Kneib et al. kneib05 (2005)).
This spectrum is shown at a velocity resolution of 15 km s-1 in Fig. 2.
3 Results
We detected all observed CO transitions from SMM J16359+6612 B.
The line profiles for all four lines are similar, and show the
characteristic double peak (see Fig. 1) already
recognized in previous interferometric studies (Sheth et al. sheth04 (2004), Kneib et al. kneib05 (2005)).
The small separation between the lensed images A and B of
(Kneib et al. kneib04 (2004)) implies that our
spectra also have a contribution from component A. Taking the
relative integrated flux densities between component A/B and
the beam size of the 30 m telescope at the four observing frequencies
into account, we estimate the contribution from component A to the
integrated line intensities of our
spectra to be 24%, 12%, 4% and 2% for the 3–2 to 6–5 transitions
respectively. These corrections have been applied to the following
quantitative analysis.
Due to the larger distance to component C and its lower magnification, the
contribution from this component is negligible.
Since the line profiles for all transitions are similar,
we used the average spectrum of all CO lines
(Fig. 2) to determine the line parameters of the
blue and redshifted component in the spectrum. A Gaussian
decomposition yields line widths of km s-1 and
km s-1 for the blue and the red components respectively.
The integrated flux density
ratio between the blue and the red component is close to unity
(). The parameters of the spectral
decomposition are summarized in Table 1.
For the Gaussian decomposition of the individual CO lines we fixed
the line width in both components to the values derived above.
The line parameters for each transition are given in Table 2.
Our integrated CO(3–2) line flux is in agreement with the Bure
flux reported by Kneib et al. (kneib05 (2005)) (2.8 vs 2.5 Jy km s-1)
but lower than the flux reported by Sheth et al. (3.5 Jy km s-1, sheth04 (2004)).
| Transition | ||||||||
|---|---|---|---|---|---|---|---|---|
| [mJy] | [mJy] | [ km s-1] | [Jy km s-1] | [109 K km s-1 pc2] | [10] | |||
| CO(=32) | 2.51737 | |||||||
| CO(=43) | 2.51732 | |||||||
| CO(=54) | 2.51746 | |||||||
| CO(=65) | 2.51738 |
-
a
corrected for a magnification (Kneib et al. kneib04 (2004))

The integrated and peak flux densities of the CO lines
are rising with increasing rotational quantum number up to the 5–4
line. The line luminosities (, see e.g. Solomon et al. (solomon97 (1997)) for the definition) show that already the 4–3 line
is subthermally excited relative to the 3–2 line.
To investigate the CO excitation in more detail we used a spherical,
one-component, large velocity gradient model (LVG). We use the
collision rates from Flower (flower01 (2001)) with an ortho/para H2 ratio of 3 and a CO abundance per velocity gradient
of [CO]/.
All lines are well fitted with a
single LVG model. A good fit to the observations is provided by
n(H2) = 103.4 cm-3 and K. Other
temperature–density combinations with similar H2 pressure also
match the data (see Fig. 3). H2 densities
above n(H2) cm-3, however, do not provide a good fit
to the observations.
In Fig. 3 we compare selected
LVG models with the observed integrated flux densities including the
CO 3–2 and 7–6 measurements by Kneib et al. (kneib05 (2005)). We
estimated the 7–6 flux using a line ratio of (line integral corrected for the
continuum emission at 1 mm). The figure shows that the predicted
integrated flux density for the CO(1–0) line is not a strong function of the
model parameters. Our models predict Jy km s-1 or K km s-1 pc2 (corrected for a magnification
).
Our Gaussian decomposition of the individual CO
transitions shows that the integrated flux density ratio between the
blue and the red part of the spectrum is near unity for all CO
transitions (see in Table 2). This implies
that gas masses, CO line ratios and also the underlying excitation
conditions are similar in the red and the blue components.
4 Discussion
At first glance the double horn line profile and the similarity
of the gas properties in both spectral components suggests
that we are looking at a circumnuclear molecular toroid.
However, if such a stable molecular gas distribution would supply
the large star formation rate ( M⊙ yr-1 Kneib et al. kneib04 (2004))
we would expect much higher gas excitation
(the same is true if we were looking at independent molecular disks
surrounding the nuclei of two merging galaxies). This is
exemplified in Fig. 3 where we compare the normalized CO line
SEDs (flux density vs. rotational quantum number) of SMM J16359+6612 to
those in other starburst galaxies/QSOs. The normalization is relative to
the integrated CO(1–0) flux density (and therefore to the molecular gas
mass). These CO SEDs can be used to constrain the CO excitation as
the turnover of the CO line SED is a sensitive measure of the
underlying gas density and temperature.
In SMM J16359+6612 the CO SED turnover occurs at the 5–4 line, which
shows that the average gas excitation is lower than in the center of the
well-studied nearby starburst galaxies NGC 253 and M 82. In both
cases, the CO SED turns over at the 6–5 line (Bradford et al. bradford03 (2003), Bayet et al. bayet04 (2004), Mao et al. mao00 (2000),
Weiß et al. weiss05 (2005)). Even higher CO excitation is
present in Henize 2-10 (Bayet et al. bayet04 (2004)) and some high-z
QSOs such as BR1202-0725 (, Omont et al. omont96 (1996), Carilli
et al. carilli02 (2002)) and the Cloverleaf (, Barvainis et al. barvainis97 (1997)) where the flux density is still rising even up to the
CO(7–6) transition. This comparison shows that the molecular gas pressure
in SMM J16359+6612 is lower than in other active systems. From our
models, we conclude that the difference mainly arises due to the
moderate average gas density (n(H2) cm-3) in
SMM J16359+6612. This suggests that the molecular gas is
less centrally concentrated than gas in starburst nuclei and QSO host
galaxies. This view is supported by the large extent (1.5 – 3 kpc)
of the molecular emission region found by Kneib et al. (kneib05 (2005)).
One possiblity to explain the combination of lower CO excitation and
high FIR luminosity (, Kneib et al. kneib04 (2004))
may be that the CO flux comes from an ’overlap’ region between two
merging galaxies.
Such a geometry has first been suggested by Kneib et al. based on
the UV/optical morphology of the potential two nuclei (their regions
and ) and the reddened overlap region (their region
). Such active overlap regions are often found in nearby
interacting systems (e.g., the Antennae: Wilson et al. wilson00 (2000), NGC 6090: Bryant & Scoville bryant99 (1999), Wang
et al. wang04 (2004)).
For comparison, we therefore also show the CO SED for the overlap
region in the Antennae in Fig. 3 (Zhu
priv. com.). Although no observations above the CO(3–2) line
have been published in literature so far, the low average
CO(3–2)/CO(1–0) line ratio suggests that the gas in the
Antennae overlap region has a lower excitation than
the starburst galaxies/QSOs and SMM J16359+6612.
More detailed models of the molecular gas in the Antennae show
that the bulk of the CO emission arises from gas at moderate density
of n(H2) cm-3 (Zhu et al. zhu03 (2003)).
Given the early stage of the merging process of the Antennae and its
low FIR luminosity (, Sanders et al. sanders03 (2003)) we suggest that SMM J16359+6612 may be a more
advanced merger (with higher FIR luminosity and higher mean gas
density than in the Antennae overlap region) but not yet in the
typical ULIRG stage (with the gas concentrated in the central kpc
region), such as, e.g., Mrk 231.
Acknowledgements.
We thank M. Zhu for providing us with the CO fluxes for the Antennae and the IRAM receiver engineers D. John & S. Navarro as well as the telescope operators for their great support on optimizing the receiver tuning. IRAM is supported by INSU/CNRS (France), MPG (Germany) and IGN (Spain).References
- (1) Barvainis, R., Maloney, P., Antonucci, R., & Alloin, D. 1997, ApJ, 484, 695
- (2) Bayet, E., Gerin, M., Phillips, T.G., & Contursi, A. 2004, A&A, 427, 45
- (3) Bertoldi, F., Carilli, C.L., Menten, K.M., et al. 2000, A&A, 360, 92
- (4) Blain, A.W., Smail, I., Ivison, R.J., Kneib, J.P. & Frayer, D.T 2002 Phys. Rep. 369, 111
- (5) Bradford, C.M., Nikola, T., Stacey, C.J., et al. 2003, ApJ, 586, 891
- (6) Bryant, P.M.& Scoville, N.Z. 1999, AJ, 117, 2632
- (7) Carilli, C.L., Kohno K., Kawabe, R., et al. 2002, AJ, 123, 1838
- (8) Downes, D., & Solomon, P.M. 1998, ApJ, 507, 615
- (9) Downes, D., & Solomon, P.M. 2003, ApJ, 528, 37
- (10) Fixsen, D.J., Dwek, E., Mather, J.C., Bennett, C.L. & Shafer, R.A. 1998, ApJ, 508, 123
- (11) Fixsen, D.J., Bennett, C.L. & Mather, J.C. 1999, ApJ, 526, 207
- (12) Flower, D. R. 2001, J. Phys. B: At. Mol. Opt. Phys., 34, 1
- (13) Frayer, D.T., Ivison, R., Scoville, N.Z., et al. 1998, ApJ, 506, L7
- (14) Genzel, R., Baker, A., Tacconi, L., et al. 2003, ApJ, 584, 633
- (15) Greve, T.R., Ivison, R.J., Bertoldi, F., et al. 2004, MNRAS, 354, 779
- (16) Greve, T.R., Bertoldi, F., Smail, I., et al. 2005, MNRAS, 359, 1165
- (17) Ivison, R.J., Smail, I., Frayer, D.T, Kneib, J.P. & Blain, A.W. 2001, ApJ, 561, L45
- (18) Ivison, R.J., Greve, T.R., Smail, I., et al. 2002, MNRAS, 337, 1
- (19) Kneib, J.-P., van der Werf, P., Knudsen, K.K., et al. 2004, MNRAS, 349, 1211
- (20) Kneib, J.-P., Neri, R., Smail, I., et al. 2005, A&A, 434, 819
- (21) Mao, R.Q., Henkel, C., Schulz, A., et al. 2000, A&A, 358, 433
- (22) Neri, R., Genzel, R., Ivison, R.J., et al. 2003, ApJ, 597, L113
- (23) Omont, A., Petitjean, P., Guilloteau, S.,McMahon, R.G., Solomon, P.M. & Pecontal, E. 1996, Nature, 382, 428
- (24) Puget, J.-L., Abergel, A., Bernard, J.-P., et al. 1996, A&A, 308, 5
- (25) Sanders, D.B., Mazzarella, J.M., Kim, D.-C., Surace, J.A. & Soifer, B.T. 2003, AJ, 126, 1607
- (26) Sheth, K, Blain, A., Kneib, J.-P., Frayer, D., van der Werf, P.P. & Knudsen, K.K. 2004, ApJ, 614, L5
- (27) Smail, I., Ivison, R.J & Blain, A., 1997, ApJ, 490, L5
- (28) Solomon, P.M., Downes, D., Radford, S.J.E., & Barrett, W.J. 1997, ApJ, 478, 144
- (29) Spergel, D.N., Verde, L., Peiris, H., et al. 2003, ApJS, 148, 175
- (30) Wang, J., Zhang, Q., Wang, Z., Ho, P.T.P., Fazio, G.G. & Wu, Y. 2004, ApJ, 616, 67
- (31) Webb, T.M.A., Lilly, S.J., Clemens, D.L., et al. 2003, ApJ, 597 680
- (32) Weiß, A., Walter, F. & Scoville, N.Z. 2005, A&A, 438, 533
- (33) Wilson, C,D., Scoville, N., Madden, S.C. & Charmandaris, V. 2000, ApJ, 542, 120
- (34) Zhu, M., Seaquist, E.R. & Kuno, N. 2003, ApJ, 588, 243