Non-thermal Cosmic Backgrounds from Blazars:
the contribution to the CMB, X-ray and -ray Backgrounds
We present a new assessment of the contribution of the Blazar population to the extragalactic background radiation across the electromagnetic spectrum. Our calculations rely on deep Blazar radio counts that we have derived combining several radio and multi-frequency surveys. We show that Blazar emission integrated over cosmic time gives rise to a considerable broad-band non-thermal Cosmic Background that in some parts of the electromagnetic spectrum dominates the extragalactic brightness.
We confirm that Blazars are the main discrete contributors to the Cosmic Microwave Background where we estimate that their integrated emission causes an apparent temperature increase of 5-50 K in the frequency range 50-250 GHz. The CMB primordial fluctuation spectrum is contaminated starting at multipole in the case of a completely random source distribution, or at lower values if spatial clustering is present. We estimate that well over one hundred-thousand Blazars will produce a significant signal in the maps of the upcoming Planck CMB anisotropy mission. Because of a tight correlation between the microwave and the X-ray flux these sources are expected to be X-ray emitters with flux larger than a few erg cm-2s-1 in the soft X-ray band. A large fraction of the foreground sources in current and near future CMB anisotropy maps could therefore be identified and removed using a multi-frequency approach, provided that a sufficiently deep all sky X-ray survey will become available in the near future.
We further show that Blazars are a major constituent of all high energy extragalactic backgrounds. Their contribution is expected to be 11-12 % at X-ray frequencies and possibly 100% in the MeV band. At higher energies (MeV) the estimated Blazar collective emission, obtained extrapolating their integrated micro-wave flux to the -ray band using the SED of EGRET detected sources, over-predicts the extragalactic background by a large factor, thus implying that Blazars not only dominate the -ray sky but also that their average duty cycle at these frequencies must be rather low. Finally, we find that Blazars of the HBL type may produce a significant amount of flux at TeV energies.
Key Words.:
galaxies: active - galaxies: Blazar: BL Lacertae surveys:1 Introduction
The identification of the first quasar (Schmidt (1963)) marked the beginning of AGN astrophysics but also the discovery of the first flat spectrum radio quasar (3C273), a type of highly variable, often polarized extragalactic radio sources that, together with the even more puzzling BL Lacertae objects, make the class of Blazars, the most extreme type of Active Galactic Nuclei known. The Blazar typical observational properties include the emission of electromagnetic radiation across the entire spectrum, from radio waves to the most energetic -rays, irregular rapid variability, apparent super-luminal motion, flat radio spectrum, large and variable polarization at radio and, especially, at optical frequencies.
Blazar of the BL Lacertae type (BL Lacs) are distinguished by non-thermal emission with no (or very weak) emission lines, are often associated with the nuclei of elliptical galaxies and are the only population of extragalactic sources that shows negative cosmological evolution (Bade et al. (1998); Giommi et al. (1999); Rector et al. (2000)). Flat Spectrum Radio Quasars (FSRQs) share the strong non-thermal emission of BL Lacs but also show intense broad line emission and strong cosmological evolution similar to that of radio quiet QSOs (Caccianiga et al. (2002); Landt et al. (2001); Wall & Peacock (1985)).
Blazars are widely assumed to be powerful sources emitting a continuum of electromagnetic (e.m.) radiation from a relativistic jet viewed closely along the line of sight (Blandford & Rees (1978); Urry & Padovani (1995)). The broad-band electromagnetic spectrum is composed of a synchrotron low-energy component that peaks (in a representation) between the far infrared and the X-ray band, followed by an Inverse Compton component that has its maximum in the hard X-ray band or at higher energies, depending on the location of the synchrotron peak, and extends into the -ray or even the TeV band. Those Blazars where the synchrotron peak is located at low energy are usually called Low energy peaked Blazars or LBL, while those where the synchrotron component reaches the X-ray band are called High energy peaked Blazars or HBL [see Fig. 1 and Padovani & Giommi (1995)]. LBL sources are the large majority among Blazars [e.g., Padovani et al. (2003a)] and are usually discovered in radio surveys, while HBL objects are preferentially found in X-ray flux limited surveys since at these frequencies they are hundreds, or even thousands, of times brighter than LBLs of similar radio power.

Radio quiet AGN are approximately one order of magnitude more abundant than Blazars and have been shown to be the major constituent of the Cosmic X-ray Background (CXB) (Giacconi et al. (1962); Rosati et al. (2002); Moretti et al. (2003)) leading to the now consolidated picture in which the CXB is composed of radiation generated by the accretion onto super-massive black holes integrated over cosmic time.
Despite the relatively low space density of Blazars, their strong emission across the entire electromagnetic spectrum makes them potential candidates as significant contributors to extragalactic Cosmic Backgrounds at frequencies where the accretion mechanism does not produce much radiation. These extragalactic backgrounds would then be mostly composed of non-thermal radiation generated in Synchrotron/Inverse Compton-type environments.
Recently, Giommi & Colafrancesco (2004) showed that Blazars are by far the largest population of extragalactic objects detected as foreground sources in CMB anisotropy maps and that their emission contaminates the CMB angular power spectrum at a significant level. Padovani et al. (1993), based on the detection of a small sample of Blazars at -ray frequencies concluded that the Blazar population should produce a large fraction of the high energy Cosmic Background.
In this paper we re-assess the Blazar contribution to the Cosmic energy in the microwave (CMB), in the X-ray (CXB), in the Gamma-ray (CGB) and TeV (CTB) part of the electromagnetic spectrum. Our calculations rely on a new estimation of the Blazar radio LogN-LogS, that we have assembled combining several radio and multi-frequency surveys, on flux ratios in different energy bands and on observed Blazar broad-band Spectral Energy Distributions (SED).
2 The Blazar radio LogN-LogS
In this section we use several radio and multi-frequency surveys to build a new deep Blazar radio LogN-LogS that updates and extends to lower fluxes the counts presented in Giommi & Colafrancesco (2004). Since the surveys considered have been carried out at three different observing frequencies (1.4, 2.7 and 5 GHz), we convert all flux densities to a common frequency before proceeding. We take 5 GHz as the reference frequency and (unless otherwise stated) we apply the flux conversions assuming a spectral slope = 0.25 () which is approximately equal to the average value in all our samples.
The derived Blazar counts are shown in Fig. 2 and can be described by a broken power law with parameters defined in the following equation:
| (1) |
The slope up to 15 mJy (dot-dashed line) is a good representation of the data, whereas the flattening at fainter fluxes (dotted line) is necessary to avoid that the predicted Blazar space density exceeds the total density of NVSS radio sources at a few mJy. The slope below the break is somewhat arbitrary as only upper limits are available in this flux regime. We have chosen a value of 0.9 since this is the average slope of the LogN-LogS of radio quiet AGN in the two flux decades below the break (Rosati et al. (2002); Moretti et al. (2003)) and is consistent with all the available constraints.
In the following we discuss the details of all the surveys in order of decreasing radio flux limit.
2.1 Two Jansky flat spectrum radio survey
The two Jansky 2.7 GHz sample (Wall & Peacock (1985)) is based on a complete radio flux limited survey of flat spectrum (, ) sources covering the entire sky with the exclusion of the Galactic plane (). The sample includes 60 Blazars (di Serego-Alighieri et al. (1994); Urry & Padovani (1995)) corresponding to a space density of 0.002 deg-2. This value has been plotted as an open square symbol in Fig. 2.

2.2 One Jansky ASDC-RASS-NVSS Blazar Sample
The ASDC-RASS-NVSS 1Jy Blazar (1Jy-ARN) Survey (Giommi et al. (2002c)) is a radio flux limited (GHz ) sample of Blazars selected by means of a cross correlation between the ROSAT All Sky Survey (RASS) catalog of X-ray sources (Voges et al. (1999)) and the subsample of NVSS survey (Condon et al. (1998)) sources with flux density larger than 1 Jansky. The selection was carried out applying the same multi-frequency technique used for the definition of the extreme HBL BL Lac sample in the Sedentary survey (Giommi et al. (1999)). To avoid the complications due to high photoelectric absorption close to the Galactic plane, only sources located at Galactic latitudes larger than 20 degrees were considered. The accurate radio positions allowed us to obtain firm associations with all the optical counterparts. The sample includes a total of 226 sources, 96% of which were previously known objects, in most cases well documented in the literature as they are bright radio sources. The class composition of the sample is reported in Table 1.
| Number | Classification |
|---|---|
| of sources | |
| 132 | FSRQs |
| 25 | BL Lac |
| 36 | SSRQs |
| 21 | radio galaxies |
| 3 | other galaxies |
| 9 | unidentified (3 flat, 6 steep) |
From past X-ray measurements we know that Blazars are characterized by a ratio ranging from erg cm-2s-1Jy-1 to over erg cm-2s-1Jy-1 (Padovani (2002)) and therefore all Blazars with flux larger than 1 Jy should be detectable in a survey with X-ray sensitivity of erg cm-2s-1Jy-1 . However, the X-ray limiting flux of the RASS strongly varies across the sky depending on the effective exposure and on the amount of Galactic absorption () along the line of sight.
Figure 3 shows the high Galactic Latitude () sky coverage of the RASS in the region of overlap with the NVSS survey. The curve was calculated taking into account of the ROSAT effective exposure in sky bins of 1 square degrees in size and converted to sensitivity assuming a power law spectrum with energy index and setting the amount of equal to the Galactic value in the direction of each sky bin.
The X-ray sensitivity ranges from somewhat below erg cm-2s-1 , where about 1000 square degrees of sky are covered, to erg cm-2s-1 , where the maximum area of 23,000 square degrees is reached.

Assuming that the three unidentified flat spectrum sources are Blazars, the number of objects of this type (FSRQ+BL Lacs+unidentified sources with 0.5) in the 1Jy-ARN survey is 160.
This sample has been used to estimate the Blazar space density above 1Jy taking into account that the sky coverage of Fig. 3 implies that faint sources with flux around e.g. erg cm-2s-1 could be detected only in square degrees of sky, whereas brighter X-ray sources with flux of e.g. erg cm-2s-1 could be detected over a much larger portion of the sky ( square degrees). The counts have been converted to 5GHz and then plotted as open circles in Fig. 2.
2.3 WMAP microwave selected Blazars
The Wilkinson Microwave Anisotropy Probe (WMAP) is a space observatory dedicated to the accurate investigation of primordial fluctuations in the Cosmic Microwave Background (Bennett et al. (2003a)). A catalog of 208 bright foreground sources detected in one or more of the five microwave WMAP channels during the first year all sky survey has been published by Bennett et al. (2003b). With very few exceptions all entries are well known bright sources at cm wavelengths and in most cases observed at several radio frequencies. Giommi & Colafrancesco (2004) have recently shown that the large majority of these objects are Blazars.
To determine how WMAP selected Blazars contribute to the 5GHz counts we have considered all high Galactic latitude ( deg) detections with flat radio spectrum ( 0.5, ) and with SED typical of Blazars. Table 2 gives the detailed statistics:
| Number | Classification |
|---|---|
| of sources | |
| 141 | FSRQs |
| 23 | BL Lac |
| 13 | radio galaxies |
| 5 | SSRQs |
| 2 | starburst galaxies |
| 2 | planetary nebulae |
| 17 | unidentified |
| 5 | no radio counterpart |
| (probably spurious) |
The space density of WMAP detected sources with radio flux above 1, 3, 5 and 10 Jansky at 5GHz has been plotted in Fig. 2 as filled star symbols.
With the exception of the point at 1 Jansky, which is most likely an underestimation due to incompleteness of the WMAP catalog at this flux limit (Bennett et al. (2003b)), the agreement with other radio surveys at cm wavelengths is very good implying that the Blazar selected by WMAP and at radio frequencies belong to the same population of objects.
2.4 The Parkes quarter-Jansky Flat Spectrum sample
The Parkes quarter-Jansky Flat Spectrum sample (Wall et al. (2004)) is a 100% identified radio flux limited survey at a frequency of 2.7 GHz.
A total of 328 FSRQ and 43 BL Lacs have been detected with flux density higher than 0.25 Jy in an area of 8785 square degrees (sample 1 of Wall et al. (2004)). Considering that this survey only accepts sources with spectral index flatter than () we rescale the sample density by a factor 1/0.75 which is the ratio of QSOs and BL Lacs with to those with in the Parkes survey known as PKSCAT90 with flux density larger than 0.25 Jy. A similar ratio is present in the 1Jy-ARN survey.
The space density of Blazar in this survey is therefore 0.06 objects per square degree. We convert 2.7GHz fluxes to 5GHz and plot the density as an open diamond in Fig. 2.
We note that 84 additional sources are classified by Wall et al. (2004) as flat radio spectrum Galaxies (57 of which without redshift); as some of these may well be BL Lacs the Blazar content of this sample will probably grow in the future.
2.5 The DXRBS Blazar Survey
The Deep X-Ray Radio Blazar Survey (DXRBS) is a radio flux limited sample based on a double selection technique at radio and X-ray frequencies and uses optical data to refine the sample. DXRBS searches for Blazar candidates among serendipitous X-ray sources of the ROSAT PSPC pointed observations listed in the WGA catalog (White et al. (1995)), restricting the sample to objects with radio spectral index flatter than = 0.5 and with broad-band spectral indices and in the region occupied by Blazars. Details of the selection method and of the optical identification of the candidates are described in Perlman et al. (1998); Landt et al. (2001); Padovani et al. (2005).
Although the radio limit of the survey is 50 mJy at 5GHz, the X-ray sensitivity of the ROSAT PSPC pointings is not deep enough to ensure completeness at all radio fluxes, as some Blazars with flux lower than 100 mJy are expected to have an X-ray flux below the ROSAT WGA limit of erg cm-2s-1 . We have therefore estimated the Blazar space density taking into account the latest LogN-LogS results of Padovani et al. (2005) for both FSRQs and BL Lacs and correcting the points at 50 and 100 mJy for the fraction of lost objects as predicted from the distribution of Fig. 4 .
The final Blazar space density from this survey is plotted in Fig. 2 as open triangles.
2.6 The ASDC-XMM-Newton-NVSS (AXN) Sample
In order to push the radio limit to fluxes significantly below 50 mJy at 5GHz using the same multi-frequency selection method of the DXRBS survey it is necessary to reach X-ray sensitivities proportionately deeper than that of the ROSAT-PSPC. For this purpose, we have searched for serendipitous NVSS radio sources in XMM-Newton EPIC-pn (Strüder et al. (2001)) X-ray images which provide approximately one order of magnitude better sensitivity than ROSAT.
We have used the data in the XMM-Newton public archive available at the ASI Science Data Center (ASDC) in December 2004. At that date a standard processing, which removes periods of high background resulting from solar flares and detects serendipitous sources, had been run at ASDC on 1220 EPIC-pn fields, 847 of which at high galactic latitude ().
Of these EPIC-pn observations we have considered the subsample of 188 non-overlapping fields that satisfy the conditions listed below that are necessary to ensure that the sample of serendipitous sources is suitable for our purposes:
-
1.
the EPIC-pn instrument was used in full window mode;
-
2.
the pointing of the XMM observation was at declination north of -40 degreed to ensure overlap with NVSS survey;
-
3.
no bright or extended source is present in the field of view;
-
4.
whenever more than one exposure of the same field was available in the archive, the deeper one was taken.
In addition, we have excluded a 5 arc-minutes circular area around the target of each field. The total area covered by the 188 fields is 26.3 square degrees. A careful inspection of all the X-ray/radio/optical associations with broad-band spectral indices and in the region occupied by Blazars (Giommi et al. (1999)) led to the results summarized in Table 3.
| Number | Space density | Flux limit | Flux limit |
|---|---|---|---|
| of sources | sources deg-1 | 1.4 GHz | 5 GHz ∗ |
| 50 | 50 | 31 | |
| 107 | 20 | 12 | |
| 149 | 10 | 6 |
∗ We assume a spectral slope
For this first (conservative) estimation we assume that all XMM fields are sufficiently deep to detect all Blazars above 50 mJy. Because of the spread in exposure times and of the reduction in sensitivity at large off-axis angles due to vignetting effects and PSF degradation, some objects (of the order of 20-30%) might have been missed and the number of Blazars found is only a lower limit. On the other hand, from the 1Jy-ARN and other surveys, we expect that a similar percentage of candidates be associated to steep spectrum objects, so that the two effects roughly cancel out. We will discuss the impact of this reduction in sensitivity in a future paper (Cavazzuti et al. (2005)) where the sky coverage of the sample will be fully taken into account.
The space density at 50 mJy at 1.4GHz (31 mJy at 5.GHz) has been plotted in Fig. 2 as a filled circle. The points at 12 and 6 mJy are drawn as lower limits because in this case a significant fraction (e.g. 50%) of these faint Blazars (especially at 6 mJy) is expected to be below the sensitivity limit of our XMM-Newton X-ray images. In fact, the distribution of known Blazars (see Fig. 4) implies that the expected soft X-ray flux of a 10 mJy Blazar is below erg cm-2s-1 in about 30% of the cases. These X-ray sources could not be detected in most of our EPIC images, especially at large off-axis angles where most of the area is located.
2.7 The Sedentary Survey of extreme High Energy Peaked BL Lacs
We conclude this section summarizing some of the results from the multi-frequency ‘Sedentary Survey’ (Giommi et al. (1999); Piranomonte et al. (2004); Giommi et al. (2005)) which is a deep ( mJy at 1.4 GHz), 100% identified radio flux limited sample of 150 extreme HBL objects characterized by a ratio higher than erg cm-2s-1Jy-1 . This survey does not have a direct impact on the full Blazar LogN-LogS of Fig. 2 since such extreme HBL objects only represent a tiny minority of the full Blazar population at radio frequencies. However, the very high flux ratio, which in these sources ranges from five hundred to over five thousand times that of typical Blazars, makes these rare radio emitters a numerically important population of sources at X-ray and TeV frequencies and therefore makes them potentially significant contributors to the Cosmic Background radiation at these frequencies. The space density of the objects at fluxes mJy (5 GHz) in this survey is reported in Fig. 2 as filled squares.
3 From radio frequencies to other spectral bands
Once the LogN-LogS of a population of sources is known in a given energy band, it is possible to estimate their emission in other parts of the electromagnetic spectrum provided that the flux ratio in the two bands, or even better, the overall energy distribution, is known.
In this section we deal with flux ratios and SEDs of Blazars that will be used later in the paper to estimate the contribution to Cosmic Backgrounds at frequencies higher than the radio ones.
The collection of SED of a large sample of Blazars built using BeppoSAX and multi-frequency data presented by Giommi et al. (2002a) clearly shows that a wide variety of broad-band spectral forms exist. This large spectral diversity, however, can be reproduced, at least in first approximation, by Synchrotron Self Compton (SSC) emission models as those shown in Fig. 1. Sometimes, to explain the -ray part of the distribution, it is necessary to add other components to this simple picture. We will deal with this possibility later when we consider the contribution of Blazars to the -ray background.
Although a continuous range of synchrotron peak energies probably exists, it is useful to divide the population of Blazars into Low energy peaked Blazars (or LBL) whose X-ray emission is due to Inverse Compton radiation, and in High energy peaked Blazars (HBL) characterized by a much higher X-ray flux (for the same radio flux) since their synchrotron component extends into the X-ray band. This simple separation in two broad categories also reflects the early selection methods since LBL objects have mostly been discovered in radio surveys, while HBL objects have been typically found in X-ray flux limited samples.
The large difference in X-ray emission in LBL and HBL objects is graphically reflected in the distribution of flux ratios shown in Fig. 4 which spans about 4 orders of magnitudes.
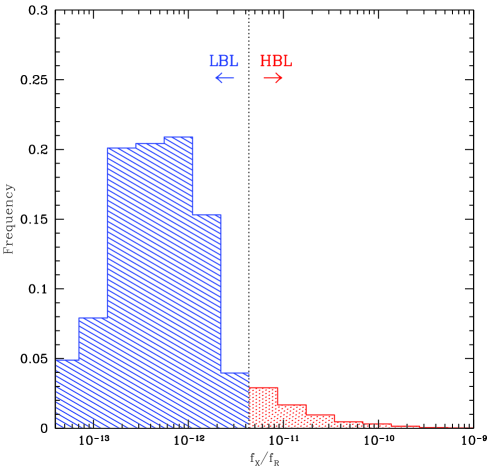
The plot shown in Fig. 4 was built using two radio flux limited samples. At values lower than erg cm-2s-1Jy-1 (corresponding to LBL objects) we have used the 1Jy-ARN sample corrected for the RASS sky coverage. As the percentage of Blazars sharply drops at values larger than erg cm-2s-1Jy-1 the 1Jy-ARN sample rapidly becomes statistically inadequate and lager samples are clearly needed. We have therefore built a radio flux limited sample including nearly 2000 Blazar candidates with erg cm-2s-1Jy-1 applying the same technique used for the Sedentary survey which is about 85% efficient in selecting HBL Blazars with erg cm-2s-1Jy-1 (Giommi et al. (2005)).
To that purpose, we have cross-correlated the positions of the X-ray sources in the ROSAT All Sky Survey (Voges et al. (1999)) with the radio sources of the NVSS catalog (Condon et al. (1998)) and we have estimated optical (J or F) magnitudes from the GSC2 Guide Star Catalog (McLean et al. (2000)). We have then calculated the broad-band and spectral slopes and we have only accepted objects in the area of the - plane occupied by Blazars (Giommi et al. (1999)). Whenever no optical counterpart was found within the radio positional uncertainty we have assumed a lower limit of Jmag = 19.5, which is the limit of the GSC2 catalog.
To estimate the distribution at erg cm-2s-1Jy-1 the radio flux limit of the sample must correspond to an X-ray flux at which the ROSAT survey covers a sky area large enough to allow the detection of at least a few objects. We have chosen 25 mJy, corresponding to erg cm-2s-1 where the RASS covers about 2000 square degrees of sky. We have then derived the tail of the distribution for erg cm-2s-1Jy-1 taking into account the RASS sky coverage shown in Fig. 3.
We have checked the reliability of this selection method using the subsample of 514 objects for which Sloan Digital Sky Survey (SDSS) [e.g., York et al. (2000); Stoughton et al. (2002)] spectral data (Turriziani et al. (2005)) are available and we have found that over 80% of the 319 candidates with erg cm-2s-1Jy-1 are indeed spectroscopically confirmed Blazars.
To properly normalize this distribution we scaled it so that the fraction of Blazars with erg cm-2s-1Jy-1 (the limit of the Sedentary survey) is equal to the density ratio between the full Blazar population and that of the extreme HBL of the sedentary survey (dashed line and filled squares in Fig. 2).
The combined distribution is shown in Fig. 4 where we see that the large majority (94%) of Blazars are of the LBL type (defined here as objects with erg cm-2s-1Jy-1 ).

4 The contribution of Blazar to Cosmic Backgrounds
Figure 5 shows the spectral energy distribution of the Cosmic Extragalactic Background radiation in the microwave, X-ray and -ray band, that is where we expect that the Blazar collective emission gives a significant contribution.
The Cosmic Microwave Background (CMB), taken from the very accurate measurements of the COBE satellite is represented by a black-body spectrum with temperature of 2.725 oK (Mather et al. (1999)); the X-ray Background (CXB) is taken from HEAO-1 measurements (Marshall et al. (1980); Gruber et al. (1999)) and has been scaled to match the more recent BeppoSAX , ASCA and XMM-Newton results in the softer 2-10 keV band (Vecchi et al. (1999); Lumb et al. (2002); Kushino et al. (2002)). The Gamma Ray Background is derived from the COMPTEL data in the range MeV (Kappadath (1998)), and from EGRET data in the range MeV - GeV. We recall that the estimate of the extragalactic -ray background emission depends on the Galactic diffuse emission model which itself is not yet firmly established. In Fig. 5 we report the results of two different analysis of the EGRET data: open circles from Sreekumar et al. (1998) and filled circles from Strong et al. (2004), which uses an improved model of the Galactic diffuse continuum gamma-rays. As for the TeV diffuse background, we report the upper limits in the - TeV region derived from the HEGRA air shower data analysis (Aharonian et al. (2002)). Note that the HEGRA measurements are sensitive both to non-isotropic (galactic) and isotropic (extragalactic) component. In the 1 TeV – 1 PeV energy range, other experiments give only upper limits and there is no clear observation of a diffuse photon signal yet.
In the following we estimate the Blazar contribution to the above described Cosmic Backgrounds basing our calculation on the radio LogN-LogS built in Sect. 2 and on flux ratios in different bands or on the observed Spectral Energy Distributions of -ray detected sources.
4.1 The Cosmic Microwave Background
The contribution of Blazars to the Cosmic Microwave Background (CMB) has been estimated in the past from different viewpoints (see, e.g., Toffolatti et al. (1998); Giommi & Colafrancesco (2004)).
Here we use the Blazar radio LogN-LogS of Fig. 2 to update the results presented in Giommi & Colafrancesco (2004).
From Fig. 2 we see that the Blazar LogN-LogS can be represented by a broken power law model with alpha=1.62 (integral slope) up to a break point where the slope flattens significantly. The precise position of the break and the amount of flattening cannot be estimated with our data. However, a break must occur somewhere around 10-15 mJy otherwise the number of Blazars would exceed the total number of radio sources at about 2-3 mJy. In the following we use the somewhat conservative values of 15 mJy for the break and 0.9 for the slope below the break. Both values are consistent with the lower limits on the Blazar counts at 12 and 6 mJy (see Sect. 2)
The integrated background intensity due to Blazars therefore can be expressed as
| (2) |
where dN/dS is the differential of eq. (1). The minimum integration flux of 0.1 mJy for is likely to be conservative since Blazars with radio flux near or below 1 mJy are already included in the Einstein Medium Sensitivity Survey BL Lac sample (Rector et al. (2000)). The integrated intensity is then converted from 5GHz to microwave frequencies convolving the flux value with the observed distribution of spectral slopes between 5GHz to microwave frequencies as estimated from the 1Jy-ARN sample (see Giommi & Colafrancesco (2004) for details).
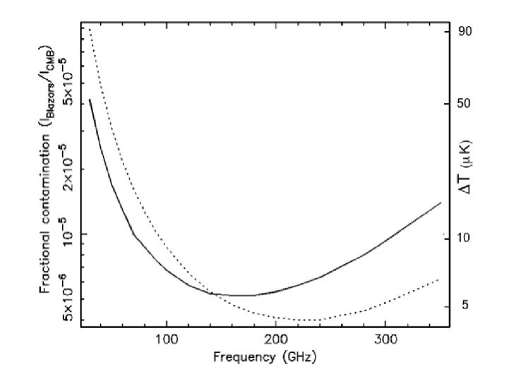
Figure 6 plots the fractional contamination, defined as , that is the ratio between the Blazar integrated emission and the CMB intensity (solid line), and the equivalent apparent temperature increase of the CMB (dotted line), as a function of frequency.
The contribution of Blazars to the temperature anisotropy spectrum of the CMB is calculated as
, where
| (3) |
assuming that the Blazars are spatially distributed like a Poissonian random sample (Tegmark & Efstathiou (1996); Scott & White (1999); Giommi & Colafrancesco (2004)). The quantity at the right hand side in eq. (3) is the usual Poisson
shot-noise term (Peebles (1980); Tegmark & Efstathiou (1996)). We neglect here the clustering term, ,
which adds to the Poissonian term since there is not yet a clear estimate of the Blazar clustering. We
note however, that the inclusion of clustering can significantly increase the amount of contamination,
especially at large angular scales (Gonzales-Nuevo et al. (2005)).
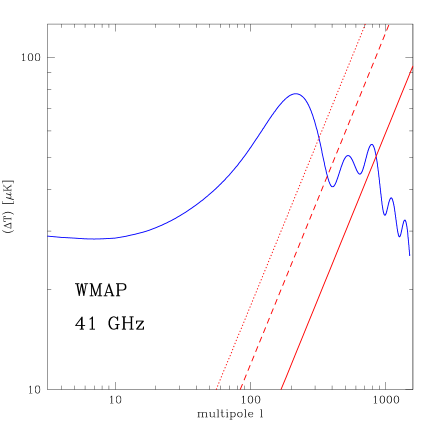
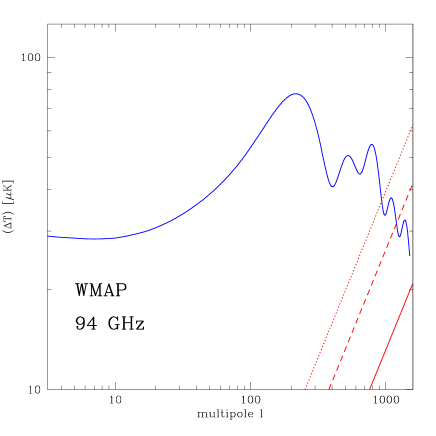
For the Blazar population described by the LogN-LogS given in fig. 2, we found at 41 GHz and at 94 GHz. Our results can be translated into temperature units using the conversion between the isotropic black-body (Planckian)
brightness and the CMB temperature which can be written as
| (4) | |||||
Here GHz is the a-dimensional frequency given in
terms of the Planck constant , of the speed of light and of the Boltzmann constant .
We found a value at 41 GHz and
at 94 GHz. We show in Figs. 7
and 8 the quantity and we compare it to the CMB fluctuation power spectrum which
best fits the available data.
The previous value is shown as solid lines and has to be considered as a definite lower limit for since it neglects the contribution of steep-spectrum sources at low frequencies which
flatten at these frequencies (41 and 94 GHz) and the effect of flux variability. The dashed lines in Figs. 7
and 8 show the Blazar power
spectrum by adding the contribution of radio sources with steep-spectrum at low radio frequencies
which flatten at higher frequencies. The effect of spectral and flux
variability also allows for an increase of the fluctuation level
because many Blazars below the sensitivity threshold of CMB experiments can be detected
during flares. The Blazar flux variability at millimeter wavelengths may be very substantial (higher
than factors 3-10 on time scales of weeks to years seen at cm wavelengths) and could definitely
increase the level of contamination of CMB maps when these are built over long integration periods.
The dotted lines in Figs. 7 and 8 show the Blazar power spectrum when also this last contribution is taken into account.
Our numerical estimates are subject to some uncertainties which depend on the parameters of the LogN-LogS that are not well constrained. For instance if instead of using the conservative values of 15 mJy and 0.9 for the break flux and slope below the break we used the less conservative values of 10 mJy and we would have an increase of 50% for and of 4% for .
The contamination level shown in Figs. 7 and 8 is that expected in case no Blazars are removed from the CMB data. The observed WMAP angular power spectrum reported by Hinshaw (2003) has been obtained using a procedure in which a pure primordial signal has been initially assumed, and then subtracting the foreground sources that could be recognized as such in the WMAP data, thus removing only the bright tail of the Blazar LogN-LogS distribution. The procedure adopted to derive the CMB power spectrum should take into account the full point-like source contribution implied by our LogN-LogS. Such an approach would both influence the shape of the expected power spectrum and increase the statistical uncertainties of the WMAP data points, especially at high multipoles, where the Blazar contribution is larger.
We stress that the previous calculations are performed neglecting the clustering term and thus they must be considered again as a lower limit to the realistic angular power spectrum contributed by the Blazars. The effects of clustering of FSRQ on the CMB fluctuation spectrum has been partially estimated by some authors: for instance Gonzales-Nuevo et al. (2005) calculated from simulations that the clustering of extragalactic radio sources is rather small at for the Planck frequencies, while the contribution of the clustering term to the confusion noise is likely to be the dominant one. Scott and White (1999) estimated instead that the clustering of SCUBA sources to the expected Planck CMB spectrum provides an increase of a factor 5-10 with respect to the Poissonian term for the point-like source contribution at . It is clear that the expectations for the clustering effect strongly depend on the adopted model for the source counts and on their clustering model. Based on the correlation function of Loan et al. (1997) (adopted by Toffolatti) and on that for the SCUBA sources adopted by Scott & White (1999) and using our Blazar LogN-LogS, we expect that the contamination of the first peak of the fluctuation spectrum (at the WMAP 41 GHz channel) is at a level comprised in the range 20-25 %. This estimate does not include possible variability effects and additional core-dominated radio sources
4.2 The Soft X-ray Background
We estimate the contribution of Blazars to the CXB at 1 keV using two methods: i) converting the integrated radio flux calculated with eq. (2) into X-ray flux using the observed distribution of flux ratios of Fig. 4; and ii) converting the integrated Blazar contribution to the CMB (at 94 GHz) to X-ray flux using the distribution of , the microwave (94 GHz) to X-ray (1keV) spectral slope, defined as
| (5) |
and estimated from the subsample of Blazars detected by WMAP in the 94 GHz channel and for which an X-ray measurement is available (see Fig. 9).
The first method gives a total Blazar contribution to the X-ray background of erg cm-2s-1deg-1 (about 70% of which due to HBL sources with erg cm-2s-1Jy-1 ) in the ROSAT 0.1-2.4 keV energy band. Assuming an average Blazar X-ray energy spectral index of = 0.7 (which is a compromise between a flatter spectrum that is typical of LBL sources and an steeper than 1 for HBL objects) this flux converts to erg cm-2s-1deg-1 in the 2-10 keV band or 11% of the CXB which is estimated to be erg cm-2s-1deg-1 (Perri & Giommi (2000)).

The distribution of microwave to X-ray spectral slope of Fig. 9 has an average value of = 1.07 and a standard deviation of 0.08 corresponding only to about a factor 3 in flux. This distribution is much narrower than that between the radio and X-ray band (Fig. 4, ) and the dispersion is comparable to the variability that Blazars show at radio and especially at X-ray frequencies.
Since the 94 GHz and X-ray measurements are not simultaneous most of the dispersion in the
distribution shown in Fig. 9 is probably due to variability both in the microwave and X-ray
band. The intrinsic dispersion is therefore likely to be much smaller. For this reason in converting
from the background level at 94 GHz estimated in the previous section to 1 keV we use the average value and assume no dispersion. We must note however that, just like the 1Jy radio surveys, the WMAP
distribution hardly includes any HBL sources, which make only a few percent of the population.
From eq. (5) we get
| (6) |
Since the Blazar integrated emission at 94 GHz is CMB94GHz or 0.64 Jy/deg2 and the Cosmic X-ray Background is erg cm-2s-1 (Perri & Giommi (2000)) in the 2-10 keV band, equivalent to 2.31Jy/deg2 at 1 keV, eq. (6) for =0.64 Jy/deg2 gives f1keV = 0.09 Jy/deg2 or 3.9% of the CXB.
Taking into account that the distribution of Fig. 9 only includes LBL objects and that HBL sources make two thirds the total contribution to the CXB (see above), the percentage scales to about 12% which is very close to the 11% obtained with the previous method.
Both result are in good agreement with the independent estimate of Galbiati et al. (2004), based on the XMM-Newton Bright Serendipitous Survey, who conclude that the radio loud AGN content of the CXB is 13%.
4.3 Hard X-ray – soft -ray Background
The number of sources detected at energies higher than soft X-rays is still rather low and building reliable distributions of flux ratios between radio or microwaves and the Hard X-ray/-ray fluxes similar to those of Fig. 4 and 9 is not currently possible. In order to estimate the Blazar contribution to high energy Cosmic Backgrounds (E100 keV) we have therefore followed a different approach. We have extrapolated the predicted Blazar integrated intensity at microwave frequencies (eq. 2) to the hard X-ray and soft -ray band using a set of hypothetical Synchrotron Self-Compton Spectral Energy Distributions.
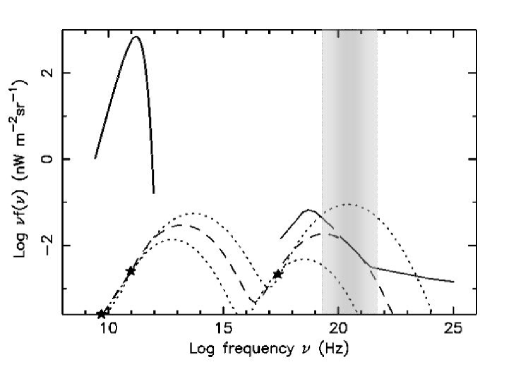
Figure 10 shows the CMB, CXB and CGB together with three predicted SED from a simple homogeneous SSC models whose parameters are constrained to 1) be consistent with the expected integrated flux at 94 GHz, 2) have the slope equal to the mean value of the WMAP Blazars ( = 1.07) and 3) possess a radio spectral slope equal to the average value in the WMAP sample. The three curves, forced to pass through the three star symbols graphically representing the three constraints listed above, are characterized by synchrotron peak frequencies of = , and Hz. From Fig. 10 we see that a high value of over-predicts by a large factor the observed Hard-X-ray to soft -ray ( Hz or 500 keV-10 MeV) Cosmic Background, whereas a too low value of predicts a negligible contribution. The case = Hz predicts 100% of the Cosmic Background. Since the Log( ) values of Blazars in the 1Jy-ARN survey and WMAP catalog peak near 13.5 and range from 12.8-13.7 within one sigma from the mean value, we argue that the data presently available indicate that Blazars may be responsible for a large fraction, possibly 100%, of the Hard-Xray/Soft -ray Cosmic Background.
4.4 -ray Background
The SSC distributions of Fig. 10 predict a negligible Blazar contribution to the extragalactic -ray Background above MeV. Nevertheless, it is well known that Blazars are the large majority of the extragalactic -ray (E 100 MeV) identified sources detected by the EGRET experiment (Hartman et al. (1999)) aboard the Compton Gamma-ray Observatory, and therefore are likely to contribute in a significant way to the -ray Background. Indeed Padovani et al. (1993), on the basis of a small number of sources detected by EGRET, concluded that Blazars should make a large fraction, if not the totality, of the extragalactic -ray background. However, these early calculations relied upon a small database and had to assume no strong variability, a characteristics that has been later demonstrated to be very common in -ray detected Blazars.
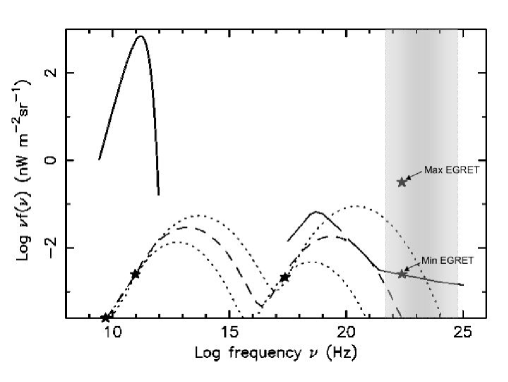
Instead of considering simple average values of the radio to -ray flux ratio as in Padovani et al. (1993) we estimate the Blazar contribution to the -ray Background using the full SED of Blazars scaling it to the integrated Blazar flux intensity as calculated with eq. (2). Figure 11 compares the energy distribution of the CMB, CXB and CGB to the SED of 3C 279, a well known bright EGRET detected Blazar, scaled as explained above.
Figure 11 shows the large variability of 3C 279 in the X-ray and -ray band. While at X-ray frequencies the contribution to the CXB ranges from a few percent to over 10% in the higher states, the predicted flux at -ray frequencies ranges from about 100% to several times the observed Cosmic Background intensity. This large excess implies that either 3C279 is highly non representative of the class of Blazars, despite the contribution to the CXB is consistent with other estimates, or its duty cycle at -ray frequencies is very low (see Fig. 12).

The same approach can be followed with other Blazars detected at -ray frequencies. In most EGRET detected Blazars the SED of LBL Blazars over-predicts the CGB by a large factor.
A way of quantifying the ratio between the -ray intensity predicted assuming that the source were representative of the entire population and the actual Background intensity is to use, in analogy with eq. (5), a microwave (94 GHz) to -ray (100 MeV) slope :
| (7) | |||||
We also define an as the of an hypothetical source that would produce 100% of the CGB if representative of the entire class. This value is based on a CGB intensity at 100 MeV shown in Fig. 5. Any real source with flatter than would then predict an integrated flux in excess of the observed -ray Background if representative of the entire population, alternatively its duty cycle must be lower than 100%.
Table 4 lists the main properties of the 34 Blazars detected by WMAP and by EGRET. Column 1 gives the source name, columns 2 and 3 give the Right Ascension and Declination, column 4 gives the 5GHz radio flux, column 5 gives the 94 GHz microwave flux measured by WMAP or estimated from the extrapolation from measurements in lower WMAP channels or from the literature, column 6 gives the minimum and maximum -ray flux measured by EGRET (excluding lower limits) taken from the third EGRET catalog (Hartman et al. (1999)), column 7 gives the corresponding values, column 8 gives the maximum duty cycle allowed assuming that the source is representative of the entire Blazar population, columns 9 and 10 give the EGRET and WMAP source names. We note that all sources in the list must have a duty cycle lower than 100%.
| Blazar Name | R.A. | Dec | Radio flux | WMAP flux | EGRET flux | Duty | EGRET | WMAP | |
|---|---|---|---|---|---|---|---|---|---|
| J2000.0 | J2000.0 | 5 GHz | 94 GHz | 100 MeV | cycle | name | catalog | ||
| Jy | Jy | cm-2s-1 | % | 3EG J | number | ||||
| (1) | (2) | (3) | (4) | (5) | (6) | (7) | (8) | (9) | (10) |
| 4C15.05 | 02 04 50.3 | 15 14 10 | 3.073 | 1.6∗ | 9-53 | 0.846-0.914 | 2-12 | 0204+1458 | 092 |
| 1Jy0208-512 | 02 10 46.2 | 51 01 02 | 3.198 | 1.8 | 35-134 | 0.816-0.867 | 1-4 | 0210-5055 | 158 |
| B2 0234+28 | 02 37 52.3 | 28 48 08 | 2.794 | 2.1∗ | 11-31 | 0.877-0.917 | 5-13 | 0239+2815 | 093 |
| CTA26 | 03 39 30.8 | 01 46 35 | 3.014 | 3.2 | 13-178 | 0.827-0.926 | 1-17 | 0340-0201 | 106 |
| PKS 0420-01 | 04 23 15.7 | 01 20 32 | 4.357 | 3.9 | 9.3-64.2 | 0.873-0.946 | 4-29 | 0422-0102 | 110 |
| 1Jy0454-463 | 04 55 50.7 | 46 15 59 | 1.653 | 3.8 | 5.5-22.8 | 0.911-0.966 | 11-47 | 0458-4635 | 151 |
| 1Jy0454-234 | 04 57 03.1 | 23 24 51 | 1.863 | 2.7 | 8.1-14.7 | 0.915-0.938 | 13-23 | 0456-2338 | 128 |
| PKS 0506-61 | 05 06 44.0 | 61 09 40 | 1.211 | 1.1∗ | 6-29 | 0.855-0.915 | 3-13 | 0512-6150 | 154 |
| 1Jy0537-441 | 05 38 51.3 | 44 05 11 | 4.805 | 6.7 | 16.5-91.1 | 0.880-0.945 | 5-28 | 0540-4402 | 148 |
| PKS 0735+178 | 07 38 07.3 | 17 42 18 | 1.812 | 1.7∗ | 15-29 | 0.872-0.896 | 4-8 | 0737+1721 | 113 |
| B2 0827+24 | 08 30 52.0 | 24 10 57 | 0.886 | 2.6∗ | 16-111 | 0.837-0.911 | 2-11 | 0829+2413 | 112 |
| S50836+710 | 08 41 24.4 | 70 53 40 | 2.342 | 1.2∗ | 9-33 | 0.854-0.903 | 2-9 | 0845+7049 | 089 |
| OJ 287 | 08 54 48.8 | 20 06 30 | 2.908 | 2.5 | 9.7-15.8 | 0.910-0.928 | 11-18 | 0853+1941 | 115 |
| 4C 29.45 | 11 59 31.7 | 29 14 43 | 1.461 | 2.1 | 7.5-163.2 | 0.814-0.931 | 1-19 | 1200+2847 | 111 |
| PKS1221-82a | 12 24 54.3 | 83 13 10 | 0.797 | 1.2∗ | 11-36 | 0.850-0.895 | 2-7 | 1249-8330 | 178 |
| 1Jy1226+023 | 12 29 06.3 | 02 03 04 | 36.923 | 9.0 | 8.5-48.3 | 0.916-0.982 | 13-73 | 1229+0210 | 170 |
| 3C279 | 12 56 11.0 | 05 47 19 | 11.192 | 19.0 | 15-250 | 0.882-1.000 | 5-100 | 1255-0549 | 181 |
| PKS 1313-333 | 13 16 07.9 | 33 38 59 | 1.093 | 1.3∗ | 15-32 | 0.858-0.887 | 3-6 | 1314-3431 | 182 |
| 1Jy1406-076 | 14 08 56.4 | 07 52 25 | 1.080 | 1.7∗ | 10-128 | 0.815-0.912 | 1-12 | 1409-0745 | 203 |
| 1Jy1424-418 | 14 27 56.2 | 42 06 19 | 2.597 | 1.5∗ | 12-55 | 0.842-0.901 | 2-9 | 1429-4217 | 191 |
| 1Jy1510-089 | 15 12 50.4 | 09 06 00 | 3.080 | 1.7 | 12.6-49.4 | 0.851-0.903 | 2-9 | 1512-0849 | 207 |
| 1Jy1606+106 | 16 08 46.0 | 10 29 07 | 1.412 | 3.1 | 21.0-62.4 | 0.865-0.907 | 3-10 | 1608+1055 | 009 |
| DA 406 | 16 13 40.9 | 34 12 46 | 2.324 | 1.4 | 19-68.9 | 0.831-0.880 | 1-5 | 1614+3424 | 023 |
| 4C38.41 | 16 35 15.4 | 38 08 04 | 3.221 | 4.2 | 31.8-107.5 | 0.856-0.902 | 3-9 | 1635+3813 | 033 |
| PMNJ1703-6212 | 17 03 36.2 | 62 12 39 | 0.616 | 1.9∗ | 14-53 | 0.853-0.904 | 2-9 | 1659-6251b | 198 |
| S41739+522 | 17 40 36.9 | 52 11 42 | 1.699 | 1.2∗ | 10-45 | 0.842-0.899 | 2-8 | 1738+5203 | 048 |
| PKS 1814-63c | 18 19 34.9 | 63 45 47 | 4.506 | 1.3∗ | 14-27 | 0.864-0.889 | 3-6 | 1813-6419 | 200 |
| PMNJ1923-2104 | 19 23 32.1 | 21 04 33 | 2.885 | 2.1∗ | 29∗∗ | 0.880 | 5 | 1921-2015 | 008 |
| PKS 2052-47 | 20 56 15.5 | 47 14 37 | 2.026 | 1.3∗ | 9-35 | 0.854-0.906 | 3-10 | 2055-4716 | 208 |
| BL Lac | 22 02 43.2 | 42 16 39 | 2.940 | 3.8∗ | 9-40 | 0.890-0.947 | 7-29 | 2202+4217 | 058 |
| PKS2209+236 | 22 12 05.9 | 23 55 39 | 1.123 | 1.3∗ | 7-46 | 0.844-0.916 | 2-13 | 2209+2401 | 050 |
| CTA102 | 22 32 36.3 | 11 43 50 | 3.967 | 3.1 | 12.1-51.6 | 0.873-0.928 | 4-18 | 2232+1147 | 047 |
| 1Jy2251+158 | 22 53 57.6 | 16 08 52 | 14.468 | 5.9 | 24.6-116.1 | 0.866-0.925 | 3-16 | 2254+1601 | 055 |
| 1Jy2351+456 | 23 54 21.6 | 45 53 03 | 1.127 | 1.7∗ | 12-43 | 0.874-0.923 | 4-15 | 2358+4604 | 074 |
∗ Not detected by WMAP in the W-band; flux taken from 90GHz measurements
∗∗ Detected only
once by EGRET reported in NED or extrapolated from lower (K,Ka,Q, V-Band) WMAP channels.
a This
source does not have an optical spectroscopic identification yet. However, the radio SED is very flat,
typical of Blazars. We propose this as a Blazar candidate and associate it with the EGRET source 3EG
J1249-8330 (previously tentatively associated to PMNJ1249-8303 by Mattox et al. (1997)).
b This EGRET
detection has also been associated to the bright radio source PMN J1647-6437 (Mattox et al. (1997)) which
is further away from the -ray position.
c This source is a radio galaxy with steep
radio spectrum at centimeter wavelengths. At microwave frequencies where WMAP is sensitive its
spectrum is flat and indistinguishable from a that of a Blazar.
4.5 TeV Background
All Blazars so far detected at TeV energies are of the HBL type. This is readily interpreted within the SSC scenario since only objects where the synchrotron radiation extends to near or within the X-ray band can produce a corresponding Inverse Compton flux that reaches TeV energies, at least assuming a single scattering.
In the following we estimate the Blazar contribution to the TeV background in a graphical way as in the previous paragraph for the case of the -ray Background but only considering the HBL component and not the entire Blazar population. From a comparison between the normalization of the Blazar radio LogN-LogS and that of the Sedentary survey (Giommi et al. (1999); see also Fig. 2 which is representative of extreme HBLs), we estimate that these objects are about 0.1 % of the Blazar population.
In Fig. 13 we plot the SED of the well known TeV detected Blazar MKN421 normalized at 94 GHz so that the flux is scaled to 0.1% of the intensity produced by the entire population of Blazars.
From this figure we see that, despite HBLs are a tiny minority, their integrated X-ray flux makes a fair fraction of the CXB and that their TeV emission may produce a significant amount of extragalactic light, even taking into account that the real flux level should be lower than that shown in Fig. 13 at TeV energies since only the objects closer than z can be detected at these energies.
We note however that since extreme HBLs such as those of the Sedentary survey are very rare (one object in several thousand degrees with flux above a few mJy) the extragalactic light at TeV energies should be very patchy, associated to single sources, rather than a diffuse light resulting from the superposition of many unresolved discrete sources as in the other cosmic backgrounds.

5 Summary and discussion
Blazars are the only type of AGN known to emit non-thermal radiation across the entire electromagnetic spectrum, from radio waves to the most energetic -rays. In some energy bands the power emitted by these sources is orders of magnitude larger than that generated through the accretion process by other types of AGN. At these frequencies, despite their low space density, Blazars are the dominant population in the extragalactic sky and contribute in a significant way to the extragalactic Cosmic Backgrounds.
A deep understanding of the Blazar contribution to the Cosmic Background light is becoming an increasing necessity as the microwave, the -ray and the TeV band are about to be intensively explored by a new generation of astronomy satellites and ground-based Cherenkov telescopes.
The overall Cosmic Background energy has two well understood components: the primordial Black Body emission peaking at microwave frequencies, or Cosmic Microwave Background (CMB) and the X-ray apparently diffuse emission arising from the accretion onto super-massive black holes in AGN integrated over cosmic time, or Cosmic X-ray Background (CXB). We have shown that Blazars add a third non-thermal component that at low frequencies contaminates the CMB fluctuation spectrum and complicates its interpretation, while at the opposite end of the electromagnetic spectrum dominates the extragalactic background radiation.
Our calculations are based on a new, deep Blazar radio LogN-LogS that was assembled combining several radio and multi-frequency surveys. The integrated radio flux from the entire population has been extrapolated to other energy bands using observed flux ratios and broad-band Spectral Energy Distributions.
Our results can be summarized as follows.
Contribution to the CMB. The results presented here confirm and extend the findings of Giommi & Colafrancesco (2004). The Blazar contribution to the Cosmic Background intensity at microwave frequencies ranges between to of the CMB, depending on observing wavelength. The consequences are twofold: i) there is an apparent temperature excess of 5-50 K, and ii) the CMB fluctuation spectrum is affected by a spurious signal that becomes significant or dominant at multipole (see Figs. 7 and 8). Since Blazars, as all cosmic sources, are probably not distributed in a completely random way across the sky, the source clustering may significantly increase the amount of contamination, particularly at large angular scales (Gonzales-Nuevo et al. (2005)).
We also note that the temperature excess causes a bias in the statistical distribution of the
primordial CMB fluctuation spectrum. If not properly removed, this non-thermal foreground radiation
may greatly complicate the detection of primordial non-Gaussianity that may carry important
information on the dynamics of the inflationary phase (e.g., Peebles (1997)).
Contribution to the CXB. The contribution to the soft X-ray Background has been
derived converting the integrated radio and microwave Blazar emission into X-ray flux using observed
flux ratio distributions. Our estimated values of 11-12% of the CXB are in very good agreement with
the independent measurement of 13% for radio loud AGN obtained by Galbiati et al. (2004) using
XMM-Newton data. For the large part this X-ray flux is composed of emission due to the end of the
synchrotron component of HBL objects, while for about one third the X-ray flux is due to the flat
Inverse Compton spectral component of LBL sources. Given the very different X-ray spectral slopes of
LBL and HBL Blazars, at energies higher than 1 keV, the blend between the (steep) synchrotron HBL
component and the (flat) Inverse Compton LBL component must change in favour of the latter. Since the
spectral slope of the Inverse Compton component is very similar to that of the CXB up to 40-50 keV,
the LBL contribution should stay roughly constant around 4-5% up to that energy. Above 50
keV the observed CXB steepens, and the contribution of LBL Blazars should progressively increase. One
of the methods that we have used is based on the distribution of Fig. 4 where LBL
sources are the large majority among Blazars while HBL Blazars are only about 5%. We have converted
the integrated radio flux into X-rays assuming that the distribution remains constant at all radio fluxes. A strong increase of the fraction of HBL Blazars at low radio luminosity (hence
fluxes), as required by the Blazar sequence within the unified schemes of Fossati et al. (1997) and
Ghisellini et al. (1998), would result in a much larger Blazar contribution to the CXB, inconsistent with the
observations. This conclusion, together with the findings of Giommi et al. (2002b), Padovani et al. (2003b), Caccianiga & Marchã (2004),
Giommi et al. (2005) and Nieppola et al. (2005) cast serious doubts on the validity of the Blazar sequence.
Contribution to the soft -ray Background. At energies higher than 100 keV the contribution to the Cosmic Background flux was estimated converting the expected Blazar contribution to the diffuse background at microwave frequencies using SEDs predicted by simple homogeneous Synchro-Self-Compton models, constrained to have a microwave-to-X-ray spectral slope equal to the observed average value of 1.07.
The Hard X-ray/Soft -ray Background is reproduced both in shape (spectral slope) and intensity assuming an average SSC distribution where the synchrotron component peaks
at Hz, well within the range of observed values.
We conclude that the Cosmic Background between 0.5 and 10 MeV is consistent with being due to the tail of the Inverse Compton component of LBL objects (see Fig. 10) .
Contribution to the -ray Background.
The SED of Blazars detected by EGRET predict much more -ray Background
than observed and therefore they cannot be representative of the entire population, at least in a stationary situation. Either EGRET detected sources are special, non representative objects, or their
-ray duty cycle must be low. Indeed, strong variability at -ray energies is very common and
most objects have been detected in widely different intensity states. A plausible scenario for the
origin of the -ray Background is that it is due to a mixture of Inverse Compton radiation produced by LBL Blazars during strong flares (Fig. 12) and perhaps a less variable component due to the still rising part of the Compton spectrum in HBL objects (Fig. 13).
A TeV cosmic Background? The existence of a Cosmic Background at TeV energies has not yet been established. Blazars of the HBL type, especially those where the synchrotron peak is located at very high energies can in principle produce a significant integrated flux (Fig. 13). A precise prediction is however difficult given the uncertainties in the amount of absorption of TeV photons via interaction with photons of the Infra-red background. In addition, we note that since the space density of extreme HBL is very low (less than one object in one hundred square degrees at a radio flux of 3.5 mJy) the TeV background produced by Blazars is composed of widely separated discrete sources rather than an apparently diffuse light like e.g. the Cosmic X-ray Background.
In all our estimations we have assumed that the broad band SED of Blazars is characterized by
approximately equal power in the syncrotron and inverse Compton components. We note that an average
SED, where the inverse Compton component is much more powerful than the synchrotron component, is not
acceptable as it would predict a much larger than observed background at hard-X-ray/soft Gamma ray
energies (see Fig. 10). The large inverse Compton emission compared to synchrotron flux
observed in some LBL sources (e.g., Ballo et al. (2002)) should therefore be associated to either rare
objects or transient events rather than to an average emission.
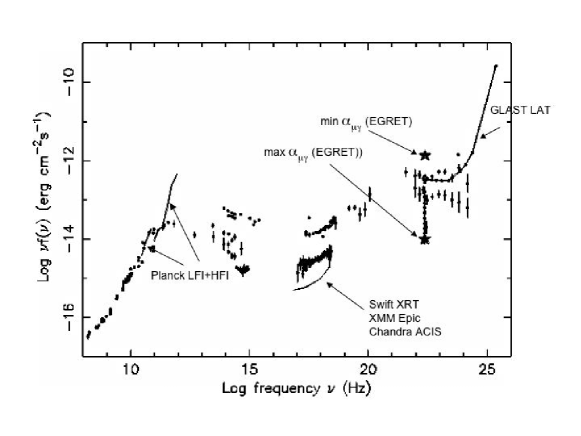
Blazars and future observatories. Figure 14 shows the observed SED of the
well known LBL Blazar 3C279, scaled down by a factor 1000, overlaid with the limiting sensitivities of
the upcoming Planck and GLAST satellites and with a 0.5-10 keV sensitivity that can be reached by
existing X-ray observatories. This hypothetical mJy LBL Blazar (or 1 milli-3C279) is at the
limit of the Planck sensitivity, it is detectable with a deep Swift exposure (or a less deep
XMM-Newton or Chandra observation) and it is detectable by GLAST during strong flares. Since the radio
LogN-LogS of Fig. 2 predicts a space density of objects per square degree with
flux above 10 mJy, the Planck mission should detect 100,000-200,000 Blazars in the
square degree high galactic latitude sky. A fraction of these sources will also be
detected by GLAST when flaring, exactly how many strongly depends on the duty cycle.
A deep all-sky X-ray survey to clean the data from Planck and future CMB missions and to provide a database of 100,000 Blazars for GLAST and other -ray observatories. Given the significant impact of the Blazar foreground emission on the CMB power spectrum it is important to remove as much as possible this contaminating component from the CMB. One possible efficient way to achieve this is to exploit the fact that the spectral slope distribution between microwave and soft X-ray flux of LBL Blazars is very narrow (see Fig. 9) with a dispersion that is probably mostly due to intrinsic variability. The soft X-ray flux of LBL Blazars (that is 90% of the Blazar population) is therefore a very good estimator of the flux at microwave frequencies and could be used to locate and remove foreground Blazars from the CMB. Figures 9 and 14 imply that a hypothetical all-sky survey with limiting sensitivity of a few erg cm-2s-1 in the soft X-ray band, would detect the large majority of Blazars above the limiting sensitivity of Planck and therefore allow the construction of a database including well over 100,000 Blazars with flux measurements at radio, microwave and X-ray frequencies. Although this type of surveys are currently not planned for the near future, they are clearly needed to address the previous issues. The extremely large sample of Blazars produced by such survey could also be used to study with great detail the statistical properties of Blazars, including the spatial correlation function and would provide a large number of targets for the next generation of -ray observatories such as AGILE, GLAST and future instruments operating in the still poorly explored MeV spectral region.
Acknowledgements.
This work is partly based on XMM-Newton, BeppoSAX and ROSAT X-ray archival data taken from the the ASI Science Data Center (ASDC), Frascati, Italy, and on data taken from the following on-line servicesthe NASA/IPAC Extragalactic Database (NED) and the Sloan Digital Sky Survey (SDSS, Data Release 3).
We are grateful to Paolo Padovani for providing DXRBs LogN-LogS results in advance of publication and to Enrico Massaro for useful discussions.
S.C. is supported by PRIN-MIUR under contract No.2004027755003.
References
- Aharonian et al. (2002) Aharonian, F. A., Akhperjanian, A. G., Barrio, J. A., et al. 2002, APh, 17, 459
- Bade et al. (1998) Bade, N., Beckmann, V., Douglas, N. G., et al. 1998, A&A, 334, 459
- Ballo et al. (2002) Ballo, L., Maraschi, L., Tavecchio, F., et al. 2002, ApJ, 567, 50
- Bennett et al. (2003a) Bennett, C. L. et al. 2003a, ApJ, 583, 1
- Bennett et al. (2003b) Bennett, C. L. et al. 2003b, ApJS, 148, 97
- Blandford & Rees (1978) Blandford, R. D. & Rees, M. J. 1978, in Pittsburgh Conference on BL Lac Objects, ed. A. M. Wolfe (University of Pittsburgh, Pittsburgh), 328
- Caccianiga & Marchã (2004) Caccianiga, A. & Marchã, M. J. 2004, MNRAS, 348, 937
- Caccianiga et al. (2002) Caccianiga, A., Marchã, M. J., Antón, S., Mack, K.-H., & Neeser, M. J. 2002, MNRAS, 329, 877
- Cavazzuti et al. (2005) Cavazzuti et al., E. 2005, in preparation
- Condon et al. (1998) Condon, J. J., Cotton, W. D., Greisen, E. W., et al. 1998, AJ, 115, 1693
- di Serego-Alighieri et al. (1994) di Serego-Alighieri, S., Danziger, I. J., Morganti, R., & Tadhunter, C. N. 1994, MNRAS, 269, 998
- Fossati et al. (1997) Fossati, G., Celotti, A., Ghisellini, G., & Maraschi, L. 1997, MNRAS, 289, 136
- Galbiati et al. (2004) Galbiati, E., Caccianiga, A., Maccacaro, T., et al. 2004, a&A, in press, astro-ph/0410432
- Ghisellini et al. (1998) Ghisellini, G., Celotti, A., Fossati, G., Maraschi, L., & Comastri, A. 1998, MNRAS, 301, 451
- Giacconi et al. (1962) Giacconi, R., Gursky, H., Paolini, F., & Rossi, B. 1962, Phys.Rev.Lett., 9, 439
- Giommi et al. (2002a) Giommi, P., Capalbi, M., Fiocchi, M., et al. 2002a, in Blazar Astrophysics with BeppoSAX and Other Observatories, ed. P. Giommi, E. Massaro, & G. Palumbo, 63
- Giommi & Colafrancesco (2004) Giommi, P. & Colafrancesco, S. 2004, A&A, 414, 7
- Giommi et al. (1999) Giommi, P., Menna, M. T., & Padovani, P. 1999, MNRAS, 310, 465
- Giommi et al. (2002b) Giommi, P., Padovani, P., Perri, M., Landt, H., & Perlman, E. 2002b, in Blazar Astrophysics with BeppoSAX and Other Observatories, ed. P. Giommi, E. Massaro, & G. Palumbo, 133
- Giommi et al. (2002c) Giommi, P., Perri, M., Piranomonte, S., & Padovani, P. 2002c, in Blazar Astrophysics with BeppoSAX and Other Observatories, ed. P. Giommi, E. Massaro, & G. Palumbo, 123
- Giommi et al. (2005) Giommi, P., Piranomonte, S., Perri, M., & Padovani, P. 2005, A&A, 434, 385
- Gonzales-Nuevo et al. (2005) Gonzales-Nuevo, J., Toffolatti, L., & Argueso, F. 2005, ApJ, 621, 1
- Gruber et al. (1999) Gruber, D. E., Matteson, J. L., Peterson, L. E., & Jung, G. V. 1999, ApJ, 520, 124
- Hartman et al. (1999) Hartman, R. C., Bertsch, D. L., Bloom, S. D., et al. 1999, ApJS, 123, 79
- Kappadath (1998) Kappadath, S. C. 1998, ph. D. Thesis, University of New Hampshire, USA.
- Kushino et al. (2002) Kushino, A., Ishisaki, Y., Morita, U., et al. 2002, PASJ, 54, 327
- Landt et al. (2001) Landt, H., Padovani, P., Perlman, E. S., et al. 2001, MNRAS, 323, 757
- Loan et al. (1997) Loan, A. J., Wall, J., & Lahav, O. 1997, MNRAS, 286, 994
- Lumb et al. (2002) Lumb, D. H., Warwick, R. S., Page, M., & De Luca, A. 2002, A&A, 389, 93L
- Marshall et al. (1980) Marshall, F. E., Boldt, E. A., Holt, S. S., et al. 1980, ApJ, 235, 4
- Mather et al. (1999) Mather, J., Fixsen, D., Shafer, R. A., Mosier, C., & Wilkinson, D. T. 1999, ApJ, 512, 511
- Mattox et al. (1997) Mattox, J., Schachter, J., Molnar, L., Hartman, R., & Patnaik, A. 1997, ApJ, 481, 95
- McLean et al. (2000) McLean, B., Greene, G. R., Lattanzi, M. G., & Pirenne, B. 2000, in in ASP Conf. Ser., ADASS IX, ed. V. C. . C. D. Manset N., Vol. 216, 145–148
- Moretti et al. (2003) Moretti, A., Campana, S., Lazzati, D., & Tagliaferri, G. 2003, ApJ, 588, 696
- Nieppola et al. (2005) Nieppola, E., Tornikoski, M., & Valtaoja, E. 2005, a&A, submitted
- Padovani (2002) Padovani, P. 2002, in Blazar Astrophysics with BeppoSAX and Other Observatories, ed. P. Giommi, E. Massaro, & G. Palumbo, 101
- Padovani et al. (1993) Padovani, P., Ghisellini, G., Fabian, A., & Celotti, A. 1993, MNRAS, 260, L21
- Padovani & Giommi (1995) Padovani, P. & Giommi, P. 1995, ApJ, 444, 567
- Padovani et al. (2005) Padovani, P., Giommi, P., & et. al. 2005, in preparation
- Padovani et al. (2003a) Padovani, P., Perlman, E., Landt, H., Giommi, P., & Perri, M. 2003a, ApJ, 58, 128
- Padovani et al. (2003b) Padovani, P., Perlman, E., Landt, H., Giommi, P., & Perri, M. 2003b, ApJ, 588, 128
- Peebles (1980) Peebles, P. 1980, in The Large Scale Sturcture of the Universe, ed. P. U. P. Priceton
- Peebles (1997) Peebles, P. 1997, ApJ, 483, L1
- Perlman et al. (1998) Perlman, E. S., Padovani, P., Giommi, P., et al. 1998, AJ, 115, 1253
- Perri & Giommi (2000) Perri, M. & Giommi, P. 2000, MNRAS, 362, L61
- Piranomonte et al. (2004) Piranomonte, S., Perri, M., Giommi, P., Padovani, P., & Landt, H. 2004, submitted to A&A
- Rector et al. (2000) Rector, T. A., Stocke, J. T., Perlman, E. S., Morris, S. L., & Gioia, I. M. 2000, AJ, 120, 1626
- Rosati et al. (2002) Rosati, P., Tozzi, P., Giacconi, R., et al. 2002, ApJ, 566, 667
- Schmidt (1963) Schmidt, M. 1963, Nature, 197, 1040
- Scott & White (1999) Scott, D. & White, M. 1999, A&A, 346, 1
- Sreekumar et al. (1998) Sreekumar, P., Bertsch, D. L., Dingus, B. L., et al. 1998, ApJ, 494, 523
- Stoughton et al. (2002) Stoughton, C., Lupton, R. H., Bernardi, M., et al. 2002, AJ, 123, 485
- Strong et al. (2004) Strong, A., Moskalenko, I., & Reimer, O. 2004, ApJ, 613, 956
- Strüder et al. (2001) Strüder, L., Briel, U., Dennerl, K., et al. 2001, A&A, 365, L18
- Tegmark & Efstathiou (1996) Tegmark, M. & Efstathiou, G. 1996, MNRAS, 281, 1297
- Toffolatti et al. (1998) Toffolatti, L., Argueso Gomez, F., de Zotti, G., et al. 1998, MNRAS, 297, 117
- Turriziani et al. (2005) Turriziani, S., Giommi, P., & Cavazzuti, E. 2005, in preparation
- Urry & Padovani (1995) Urry, C. M. & Padovani, P. 1995, PASP, 107, 803
- Vecchi et al. (1999) Vecchi, A., Molendi, S., Guainazzi, M., Fiore, F., & Parmar, A. N. 1999, A&A, 349, L73
- Voges et al. (1999) Voges, W., Aschenbach, B., Boller, T., et al. 1999, A&A, 349, 389
- Wall et al. (2004) Wall, J. V., Jackson, C. A., Shaver, P. A., Hook, I. M., & Kellermann, K. I. 2004, A&A, submitted
- Wall & Peacock (1985) Wall, J. V. & Peacock, J. A. 1985, MNRAS, 216, 173
- White et al. (1995) White, N. E., Giommi, P., & Angelini, L. 1995, , http://wgacat.gsfc.nasa.gov
- York et al. (2000) York, D. G., Adelman, J., Anderson, J. E., J., et al. 2000, AJ, 120, 1579