Initial Conditions for Massive Star Birth – Infrared Dark Clouds
Abstract
We summarize the properties of Infrared Dark Clouds, massive, dense, and cool aggregations of interstellar gas and dust that are found througout the Galaxy in projection against the strong mid-infrared background. We describe their distribution and give an overview of their physical properties and chemistry. These objects appear to be the progenitors of high-mass stars and star clusters, but seem to be largely devoid of star formation, which however is taking place in localized spots.
keywords:
stars: formation, ISM: clouds, ISM: molecules, infrared: general, radio lines: ISM, masers1 Introduction
Observations of dust and molecules provide almost all of the accessible information on deeply embedded high-mass (pre-)protostars, whose emission is frequently not detected even at mid-infrared wavelengths. As evidenced by, a.o., many contributions to this symposium, much current effort is expended on extensive surveys of unequivocal signposts of high-mass star formation, such as sources with tell-tale far-infrared spectral energy distributions and hot, dense molecular cores highlighted by maser emission in the methanol and water molecules.
All the regions traced by these signposts are containing already formed (proto)stars and only recently have clouds with the potential of forming high-mass stars and/or clusters, but still yet largely devoid of stellar objects, been identified: Infrared Dark Clouds, whose observational status we shall summarize here.
2 Infrared Dark Clouds
First recognized in mid-infrared images from the Infrared Space Observatory (ISO) and Midcourse Space Experiment (MSX) satellites Infrared Dark Clouds (IRDCs) appear in silhouette against the Galactic mid-infrared (MIR) background, frequently in filamentary shapes. Perault et al. (1996) report that ISOGAL111ISOGAL is a 7 and m survey with ISOCAM (the ISO 3 – m camera) of in the Galactic Plane interior to . images show “unexpectedly, a number of regions which are optically thick at m which are likely due to absorption” and “a convincing correlation with a depletion in m source counts”. They estimate and put forward “that these would be good candidates for precursors of star formation sites.” Even before IRDCs became generally known as a distinct class of objects, Lis & Menten (1998) found absorption in the 45 m ISO LWS detector band against the MIR background and emission in the 173 m band toward M0.25+0.11, the low Galactic longitude end of the Galactic center “dust ridge’, a string of submillimeter (submm) condensations found by Lis & Carlstrom (1994) which terminates with the prominent Sgr B2 star-forming region at its high longitude end. M0.25+0.11 was studied, even earlier, in detail by Lis et al. (1994), who found very little, if any (a weak H2O maser) signs of star formation in it. Lis & Menten performed grey body spectral fits to the far-infrared data combined with their previous 350 – 800 m submillimeter measurements and obtained a low temperature, K, for the bulk of the dust in M0.25+0.11’s core. In addition, they found that the grain emissivity is a very steep function of frequency (; see §4.1). Lis & Menten derived a gigantic mass of for this object, comparable to the core of the “mini starburst region” Sgr B2.
The first extensive dataset on IRDCs was compiled with the SPIRIT III infrared telescope aboard the Midcourse Space Experiment (MSX; see Price 1995), which surveyed the whole Galactic plane in a wide strip (Price et al. 2001) in four MIR spectral bands between 6 and 25 m at a spatial resolution of ′′ . In an initial census of a long strip of the Galactic plane (between ), Egan et al. (1998) find “compact objects seen in absorption against bright mid-infrared emission from the Galactic plane. Examination of MSX and IRAS images of these objects reveal that they are dark from 7 to 100 m.”
The IRDCs are best identified in the m MSX “A” band, because, first, the 7.7 and 8.6 m PAH features associated with star-forming regions contribute to a brighter background emission and, second, the MSX A band is more sensitive than the satellite’s other bands.
M0.25+0.11 and the other condensations of the Galactic center dust ridge also appear conspicuously in absorption on an m MSX image presented by Egan et al. 1998.
Hennebelle et al. (2001) in a systematic analysis of the ISOGAL images extracted a total of IRDCs, for which they derive m opacities of 1 to 4.
The four newly-detected massive and dense cold cores identified by Garay et al. (2004; see also his contribution to these proceedings) also represent an interesting sample of IRDCs. These objects are not mid-IR but mm-contiumm selected: The 1.2 mm dust emission reveals massive () and cold ( K) cores.
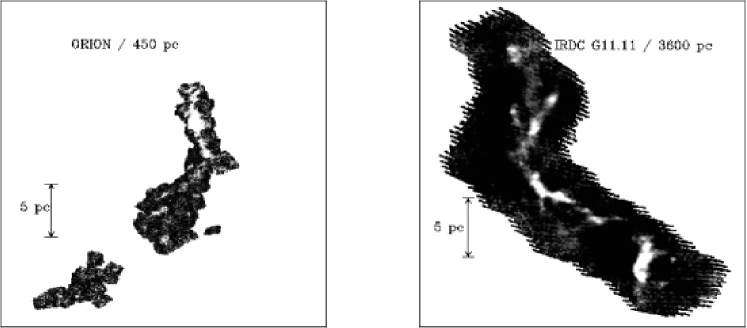
How do IRDCs compare to the Orion Molecular Cloud I (OMC-1), probably the best-studied high-mass molecular cloud/star-forming region complex? In Fig. 1, we show the 1.2 mm dust continuum emission from OMC-1 mapped with MAMBO222The MAx-Planck Millimeter BOlometer array is operated at the IRAM 30m telescope on Pico Veleta, Spain. and the 850m SCUBA333The Submillimeter Common User Bolometer Array is operated at the 15 m James-Cleck-Maxwell Telescope on Mauna Kea, Hawaii. dust continuum map of IRDC G11.11-0.12 (Johnstone at al. 2003). At a distance of 3.6 kpc (see §4.1) G11.11-0.12 has a remarkable resemblance with the integral-shaped Orion filament, both, in structure and in dimensions. The bright MIR emission along the Galactic plane favours the identification of a massive cold cloud as infrared dark, which the OMC-1 region is not due to the absence of a MIR background caused by its location outside of the Galactic plane. One glaring difference though exists between the two maps: the prominent maximum in OMC-1, marking the very active BN/KL high-mass stars-forming region (see §5).
3 Galactic distribution and distances
Using a standard Galactic rotation curve, Carey et al. (1998) determined kinematic distances for some of the IRDCs in their sample. They obtain distances between 2.2 and 4.8 kpc, proving without a doubt that the clouds are not local. Their distances agree with those of HII regions in their vicinity.
Recently, Simon et al. (2004) prepared a catalogue of 380 IRDCs identified from the MSX survey, based on the morphological correlation of MIR extinction and 13CO emission, as observed in the BU-FCRAO Galactic ring survey (GRS) of the inner Milky Way. They find that the majority of the dark clouds are concentrated in the Galactic ring at a galactocentric radius of 5 kpc. The kinematic distances derived range from 2 – 9 kpc. In Table 1, we list the source parameters of all the IRDCs for which data at wavelengths other than the MIR have been collected.
| Name | R.A. | Decl. | d | |||
|---|---|---|---|---|---|---|
| (J2000.0) | (J2000.0) | (km s-1) | (kpc) | () | (K) | |
| DF+04.36-0.06 t | 17:55:53.07 | 25:13:18.7 | ||||
| DF+09.86-0.04 t | 18:07:37.22 | 20:25:54.5 | ||||
| DF+15.05+0.09 t | 18:17:37.87 | 15:48:59.9 | ||||
| DF+18.56-0.15 t | 18:25:19.52 | 12:49:57.0 | ||||
| DF+18.79-0.03 t | 18:25:19.84 | 12:34:23.1 | ||||
| DF+25.90-0.17 t | 18:39:10.13 | 06:19:58.8 | ||||
| DF+30.23-0.20 t | 18:47:13.16 | 02:29:44.7 | ||||
| DF+30.31-0.28 t | 18:47:39.03 | 02:27:39.8 | ||||
| DF+30.36+0.11 t | 18:46:21.16 | 02:14:19.0 | ||||
| DF+30.36-0.27 t | 18:47:42.37 | 02:24:43.2 | ||||
| DF+31.03+0.27 t | 18:47:00.39 | 01:34:10.0 | ||||
| DF+36.95+0.22 t | 18:57:59.51 | +03:40:33.3 | ||||
| DF+51.47+0.00 t | 19:26:12.74 | +16:26:12.6 | ||||
| G353.85+0.23 P1 c | 17:29:16.5 | 34:00:06 | ||||
| G353.51-0.33 P1 c | 17:30:26.0 | 34:41:48 | ||||
| G357.51+0.33 P1 c | 17:40:49.9 | 31:14:50 | ||||
| G10.74-0.13 P1 c | 18:09:45.9 | 19:42:04 | ||||
| G11.11-0.12P1p | 18:10:29.27 | 19:22:40.3 | ||||
| G19.30+0.07 p | 18:25:56.78 | 12:04:25.0 | ||||
| G24.72-0.75 p | 18:36:21.07 | 07:41:37.7 | ||||
| G24.63+0.15 p | 18:35:40.44 | 07:18:42.3 | ||||
| G28.34+0.06P1p | 18:42:50.9 | 04:03:14 | ||||
| G28.34+0.06P2p | 18:42:52.4 | 03:59:54 | ||||
| G33.71-0.01p | 18:52:53.81 | +00:41:06.4 | ||||
| G79.27+0.38 p | 20:31:59.61 | +40:18:26.4 | ||||
| G79.34+0.33 p | 20:32:26.20 | +40:19:40.9 | ||||
| G81.50+0.14 p | 20:40:08.29 | +41:56:26.4 |
Notes: Columns are name, right ascension, declination, LSR velocity, distance, total column density, and kinetic temperature. In souces with a distance ambiguity, the near distance was chosen. t refers to sources from Teyssier et al. 2002, c from Carey et al. (2000), ’P1/P2’ refers to the brightest submm peaks of Carey et al. (2000), p means that the position of the brightest ammonia peak is given rather than the submm peak position (see Pillai et al. 2005a).
The cloud sizes as reported by Carey et al. (1998) are from 0.4 – 15 pc while Teyssier at al. (2002) report structures of filaments down to sizes pc.
4 Physical parameters or IRDCs
4.1 Density, column density and temperature
Based on observations of the formaldehyde molecule (H2CO), Carey et al. (1998) argue that IRDCs objects are dense ( cm-3), cold ( K) cores, apparently without surrounding envelopes. However, later work by Teyssier at al. on a different IRDC sample report that large field maps obtained with the 4-m Nanten telescope in the 13CO J line, which probes relatively low densities, (Zagury et al., unpublished data) indicate that at least these IRDCs may indeed have lower density envelopes. We have confirmed this for the Carey et al. sample with hitherto unpublished 13CO maps retrieved from the GRS.
Carey et al. (1998) conclude that the IRDCs they have studied have extinctions in excess of 2 mag at 8 m. Using the infrared (visual through m) extinction law Lutz et al. (1996) derived for the Galactic center, this indicates visual extinctions of mag. How representative Lutz et al.’s law is for other lines of sight is unknown. Certainly it does lack the pronounced minimum for standard graphite-silicate mixes in the 4 – 8 m range predicted by Draine & Lee (1984), which seems well-established by observations toward various lines-of-sight (see references therein).
Actually, IRDC opacities at two wavelengths (e.g. 7 and 15 m) can be used as a check on the extinction curve and its possible variation with different lines of sight; see Teyssier et al. 2002. These authors find a (marginally) lower 7 to 15 m opacity ratio for clouds located away from the Galactic center compared to clouds that appear in the Galactic center direction. For the latter value they derive , which is consistent with Lutz et al.’s law.
Using the relation given by Bohlin et al. (1978), assuming that all the hydrogen is in molecular form and a “standard” ratio of total to selective extinction of 3.1, hydrogen column densities in excess of cm-3 is derived.
An independent H2 column density estimate can be obtained from observations of (sub)millimeter dust emission, which, in addition, also allow determination of the cloud (gas+dust) mass (see, e.g., Mezger et al. 1987, 1990; Lis & Menten 1998). At (sub)millimeter wavelengths the dust emission is generally optically thin over most of the volume of an interstellar cloud. Thus, at wavelength the measured flux density, , is given by , where is the temperature of the dust, its optical depth and is the Planck black body brightness. The integration is either over the beam solid angle for a point-like source or over the source’s angular extent, if the latter is extended. is proportional to the hydrogen column density, , and the dust absorption cross section per hydrogen atom , which itself is assumed to be proportional to .
Using all of the above, one finds that the H2 column density is related to as . The cloud mass, , is proportional to , where is the cloud’s distance.
Carey et al. (2000) imaged a sample of 8 IRDCs in and m dust emission using SCUBA. Since it impossible to determine, both, and with just two data points, Carey et al. calculated dust color temperatures for three different values of , 1.5, 1.75, and 2 and note that higher -values (meaning lower temperatures) yield a better fit to the low temperatures Carey et al. (1998) obtained from H2CO observations. The (high) column densities implied by choosing are around cm-2 for 4 sources of their sample and around cm-2 for three. Three of the cores corresponding to the brightest submm peaks have masses around 100 , two other have 400 and 1200 , respectively. Two clouds in the Cygnus region have masses around 40 , but we note that distance estimates for that region are very uncertain and probably a short distance (1 kpc used by Carey et al. 1998) was chosen for the latter calculations. For , all these values are to be reduced by a factor of 2.
As reported above (see §2), for M0.25 Lis & Menten derive a very high value of of 2.8. They take that to indicate the presence of dust grains covered with thick ice mantles.
The values for the high densities and low temperatures deduced by Egan et al. (1998) are confirmed by Carey et al. (1998), who made, for 10 IRDCs, millimeter-wavelength observations of H2CO, which is a well-established density probe (Mangum & Wootten 1993; Mundy et al. 1987). Since they observed several transition, they were able, using a Large Velocity Gradient method, to determine temperatures and abundances. Unfortunately, these authors do not discuss their results source by source, but only give general statements.
Leurini in her dissertation (Bonn University; see also Leurini et al. 2004) has shown that methanol (CH3OH) is a highly useful interstellar density and temperature probe. Consequently, she conducted observations of IRDCs in a selected series of lines of that molecule, which she showed to be overabundant in these sources (see §4.3) and, thus, easy to detect. Leurini also corroborates the high densities ( – cm-3) indicated by the H2CO data. However, she only observed positions of submillimeter emission peaks, some of which (if not all) harbour embedded sources. Her analysis does, thus, not necessarily apply to general, cool IRDC material, but to gas that is influenced by embedded protostars (see §5). This is reflected most directly in the high-velocity outflows seen in some sources, e.g, G11.11-0.12 and in the high kinetic temperatures of order 40 to 60 K she derives for these.
4.2 Morphology
A significant fraction of IRDCs (although no all) are filamentary. Are IRDCs really filaments, i.e. elongated cylinders, or are they sheets seen edge-on? This is actually an important question linked to their evolutionary state.
Larson (1985), using theoretical arguments and numerical simulations, argues that fragmentation is unlikely to occur in an initially uniform cloud. Either an initial anisotropy or rotation or a magnetic field will in general cause the cloud to collapse toward a flattened or filamentary structure. Once overall collapse has been halted and approximate equilibrium has been established, gravitational instability can cause the resulting sheet or filament to break into fragments of a characteristic mass that depends on the temperature and the surface density of the cloud.
Larson’s arguments are supported by the work of Miyama et al. (1987a,b), who investigated the fragmentation instability of an isothermal gas layer, in order to see whether the observed structures of many dense interstellar clouds are the results of fragmentation of sheet like clouds. Linear perturbation theory predicts fragmentation of a parent sheet-like cloud in elongated structures, and using further nonlinear analysis they found that, if fragments are initially elongated, they become elongated more and more as they go on collapsing, ending up as very slender cylinders, which fragment further.
The G11.11-0.12 IRDC has a distinct filamentary appearance (see Figs. 1 and 4). Using a sophisticated computational technique Fiege et al. (2004) compared observations to three different models of self-gravitating, pressure-truncated filaments, namely the non-magnetic Ostriker (1964) model, and two magnetic models from the literature. Analysing the m SCUBA observations of G11.11-0.12, Johnstone et al. (2003) concluded that this source has a much steeper ) radial density profile than other (lower moss, lower extinction) filaments, where the density varies approximately as , This steep density profile is consistent with the Ostriker model. After a wider search of parameter space, Fiege et al. conclude that the observed radial structure of G11.11-0.12 can be understood in the context of all three models. Discrimination between the different models may be possible with polarization measurements as the magnetic models predict dominant poloidal magnetic fields that are dynamically significant; G11.11-0.12 may be radially supported by a poloidal field. Fiege et al. predict polarization patterns expected for both magnetic models, which produce different polarization patterns. Polarimetry should, thus, be able to distinguish between the two magnetic models or a non-magnetic model.
An instrument of choice will be PolKa, the Polarization Kamera designed to be used together with the bolometer arrays developed at the Max-Planck-Institut f r Radioastronomie, for example with the 295 element m Large APEX BOlometer CAmera (LABOCA), which is soon to be installed at the 12m Atacama Pathfinder EXperiment telescope (Siringo et al. 2004).
To decide the sheet or cylinder question, let us consider G11.11-0.12. That cloud is at a distance of 3.6 kpc (Carey et al. 1998). The elongated submillimeter emission has an extent of 24 pc in the long and an average pc in the short axis. The density is uncertain: values between 105 and 106 cm-3 have been derived by Carey et al. (1998) from their H2CO data, Johnstone et al. (2003) argue for a few times cm-3. The H2 column density is between 0.2 and 2 cm-2 (Carey et al. 2000). Using the extremes of these values, we find that the extent along the line of sight must be between a few times and 0.5 pc, definitely ruling out a sheet seen edge on.
4.3 Chemistry of IRDCs
Complex organic (i.e. O- and C-bearing) molecules in the interstellar medium are mostly found in hot, dense cores surrounded by high-mass protostars. They frequently have very high over abundances (factors of 100 – 1000) compared to dark cloud values. These are usually explained by the evaporation of icy dust grain mantles on which these molecules are formed in a cooler phase in the clouds lifetime by hydrogenation of CO to H2CO. Further hydrogenation leads to even more complex species. (Relatively) complex molecules are also found in cold dark clouds, with TMC-1 being a prominent nearby example (See, e.g. Kaifu et al. 2004). However, in the latter they all have very small abundances and are observable only because of TMC-1’s proximity (yielding a high filling factor) and its moderately high density ( cm-3) leading to substantial beam-averaged column densities. This makes exotic (but not organic in the strict sense of the work) species detectable, such as the polyyene carbon chains (Kaifu et al. 2004).
What is the organic content of normal molecular clouds? This, essentially, is an unanswered question (the one example TMC-1 aside). Its answer has profound impact on astrochemistry (are grain mantles really needed to form these molecules?) and even astrobiology. Their high column densities make IRDCs ideal laboratories to address this question and potentially detect complex molecules. Such species might be present and widespread in many clouds, but would be rendered undetectable because of the modest column densities of ordinary clouds: Lines from almost all molecules significantly rarer than NH3 or CH3OH will most likely be optically thin, which makes their line intensity directly proportional to the column density.
Observations of molecules in IRDCs so far have concentrated on just a few species: CO (several isotopomers), H2CO, CH3OH, and NH3. In addition, Teyssier et al. (2002) observed several HC3N lines and two -series of CH3CCH. The latter, a symmetric top, can be used as a temperature probe and its observations yield values for the kinetic temperature, , between 8 and 25 K; the higher values found toward embedded objects. Large Veloity Gradient (LVG) model calculations of HC3N, 13CO, and C18O yield densities larger than cm-3 in the densest parts. Teyssier et al. ascribe the relatively low observed intensities (a factor of a few lower than in TMC-1) to a very low kinetic temperature (difficult to understand, as TMC-1 is cold, too, K), a small filling factor or depletion on grains.
In Fig. 2, we show the spectra of different molecules observed towards the brightest submm peak position of G11.11-0.12 (P1).
![[Uncaptioned image]](/html/astro-ph/0508030/assets/x2.png)
|
|
The NH3 and CH3OH observations produced interesting results: CH3OH and NH3 are overabundant by factors of 5 – 10 relative to “normal”(= lower density) and less turbulent dark clouds , such as TMC-1 (Leurini, dissertation and 2005, Pillai et al. 2005a in prep.). In contrast, H2CO is underabundant by a factor of (Carey et al. 1998). Given this situation it is completely unclear which molecules might be detectable and which ones not. Could it be that species with emission sufficiently strong and widespread to be easily detectable have until now been completely missed?
Systematic searches for other molecules will yield a more complete picture of the chemistry of IRDCs, which, while certainly interesting in itself, will also shed light on general formation mechanisms of complex molecules. Moreover, they might help identify new temperature and density tracers and allow studies of (molecule-)selective depletion.
4.3.1 Ammonia
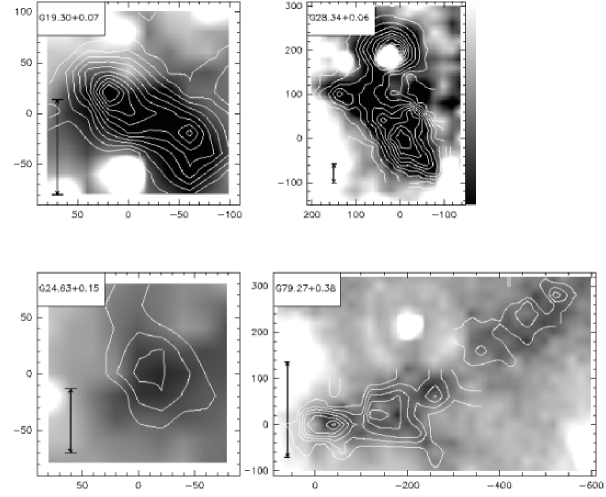
To exploit NH3’s properties as an excellent molecular cloud thermometer (Danby et al. 1988) 10 IRDCs were studied in the course of T. Pillai’s dissertation (see also Pillai et al. 2005): They were mapped in the (1,1) and (2,2) transitions near cm wavelength ( GHz) with the MPIfR Effelsberg 100m telescope. The FWHM beam size at the frequencies of the NH3 lines was . The NH3 emission correlates very well with MIR absorption and ammonia peaks (in the following referred to as “cores”) distinctly coincide with dust continuum peaks, as shown in Fig. 3.
Several compact sources were detected within the clouds with sizes smaller than the FWHM beam size. The total gas masses derived for entire clouds from NH3 data range from 103 – 104 .
We can constrain the average gas temperatures to K. The temperature distribution within clouds has also been analysed and we find significant temperature gradients, with the temperature rising in outward direction, in all of the cases where we have a good signal-to-noise ratio throughout the map. This outward rise in temperature we find in all except one core can be readily interpreted as influence of the strong external UV field warming up the cloud.
The only case where we find a positive correlation between the gas temperature and the integrated intensity is also the only case where the turbulence seems to increase towards the core. This one has the most evolved core and is also the most massive in our sample. We observe large line widths () km s-1, hence turbulence plays an important role in the stability of this IRDC. The column densities translate to extremely high of 55 – mag, therefore early star formation, if any, would be deeply embedded. The virial parameter defined as is for most of the clumps. Hence the cores appear to be unstable against gravitational collapse; in fact direct evidence for collapse might be revealed from VLA observations we have recently obtained.
The fractional abundance of NH3 (relative to ) is . This together with the excellent correlation in morphology of the dust and gas is consistent with the time dependant chemical model for NH3 of Bergin & Langer (1997) and implies that NH3 remains undepleted. We can constrain the ages of IRDCs based on this model to years for densities cm-3, assuming that the NH3 has reached its chemical equilibrium abundance. The time scales we derive for the clouds to disperse due to their own internal motions, of a few Myrs, provide a better upper limit to the life time of these clouds. There are significant velocity gradients observed between the cores but we find that they are not attributable to rotation. The effects of external shock/outflow tracers need to be investigated.
Based on the observed line widths, the derived gas temperatures and the NH3 column densities, we made a comparison of IRDC condensations with objects representing more evolved stages of high-mass star formation like the High-mass Protostellar Objects (HMPOs) studied by Sridharan et al. (2002) and Beuther et al. (2002). There is a clear trend in temperature from the low temperatures of the IRDCs to typical temperatures of 20 – 30 K for the HMPOs without (significant) HII region to the higher temperatures of UCHII/hot core regions. The line widths in the HMPOs are generally higher than those in the IRDCs.
4.4 Magnetic fields
Theoretical studies suggest that magnetic fields play a crucial role in the star formation process. But contrary to other parameters like density, temperature, the velocity field, and molecular abundances, it has been notoriously difficult to determine -fields in any regime of the interstellar medium (ISM) from diffuse clouds to dense star-forming cores (see, e.g., Crutcher 1991 and these proceedings).
Virtually the only method for a direct determination of is the Zeeman effect, which causes a frequency shift of the right-circularly polarized (RCP) relative to the left circularly polarized (LCP) component of a spectral line from a molecule with a suitable electronic structure and also from the 21 cm line of the hydrogen atom.
One of the few interstellar molecules with detectable Zeeman splitting is hydroxyl (OH), whose ground-state hyperfine structure (hfs) transitions near 18 cm wavelength (at 1665, 1667, 1612, and 1720 MHz) have measurable splittings. OH is found in the general molecular interstellar medium and can be detected in clouds with densities a few cm-3. However, it is also found, at elevated abundance, in the dense, expanding envelopes of ultracompact HII regions, which have densities cm-3 (Hartquist et al. 1995).
fields of order a few tens of G have been found from OH Zeeman measurements of low density dark clouds (see, e.g. Goodman et al. 1989; Crutcher & Troland 2000), while much stronger, few mG, fields are derived for the much denser maser regions (see, e.g., Fish et al. 2003).
While it is relatively easy to measure Zeeman-splitting in OH masers, over the years, large amounts of observing time have been dedicated to measuring Zeeman-splitting in lower density clouds with few, but precious results. A picture has emerged in which the -field strength increases with density, , i.e. . From theoretical arguments (conservation of magnetic flux and mass) one expects for a collapsing cloud if the -field is unimportant throughout the collapse and in the opposite case (Crutcher 1991). Models of ambipolar diffusion-driven cloud contraction deliver (Fiedler & Mouschovias 1993).
See Fig. 1 of from Padoan & Nordlund 1999 for a recent compilation of measured -field strengths vs. density. It is apparent from this figure that there is a dearth of -field data points for densities between and cm-3. -field measurements of IRDCs will probe just this highly interesting portion of parameter space.
A preliminary survey with the Effelsberg 100m telescope showed OH absorption in both the 1665 and the 1667 MHz hyperfine lines with total (Stokes ) intensities of order K or deeper in several IRDCs. Given the IRDCs’ densities cited above we would expect of order several hundred mG, similar to the values found in high-mass star-forming regions. A 2 hour integration on one source, G yielded an upper limit of 135 G at a 99% (3) confidence level, consistent with the upper limits derived by Crutcher at al. (1993) for regions of similar density.
The -field morphology will be determined from submillimeter polarization observations (see 4.2). Feldman et al. (2003) report in an abstract SCUBA polarization observations of MSX IRDCs where they quote very high percentage polarizations (%) and find that inferred magnetic field directions are correlated with the cloud structure. There seems to be trend for to align along the direction of a filament. Bright, compact sources in the filaments are much less polarized, and their inferred -field directions are perpendicular to the orientation of the filaments.
5 Ongoing star formation in IRDCs
While large volumes of IRDCs appear to be devoid of signposts of ongoing star formation, such as ultracompact HII regions and/or CH3OH, OH or H2O masers, isolated centers of high or intermediate star formation are found in many clouds.
Teyssier et al. (2002) found that OH and class II CH3OH masers et al. (1995) are associated with positions of (not overly pronounced) peak emission from the column density tracer C18O in the IRDCs DF+9.86-0.04 and DF+30.23-0.20. These are close to dust emission peaks. Since CH3OH masers are unambiguous tracers of high-mass star formation, we have obtained data on the 6.7 GHz CH3OH maser transition, towards a sample of 50 dark clouds with a high ( 25%) rate of detections.
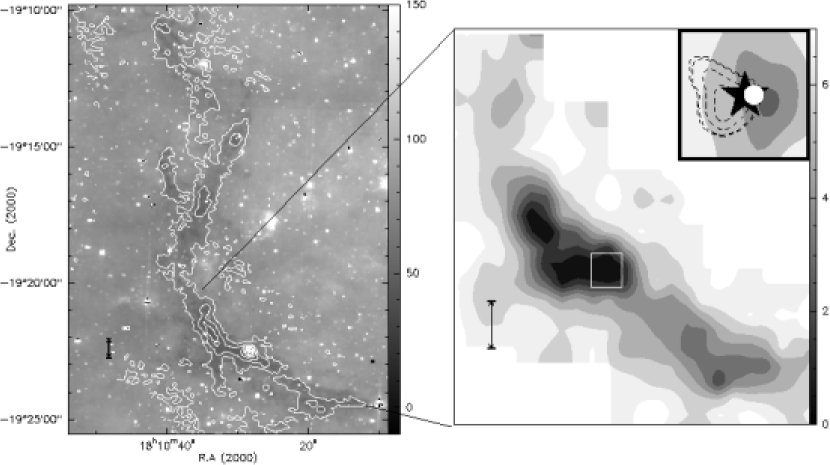
Maybe to date the best-studied example of a star-forming core in an IRDC is the 850 m emission peak in G11.11-0.12 studied in detail by Pillai et al. (2005a; in press). Coincident with a compact dust continuum source are both, an H2O and a CH3OH maser as shown in the inset of Fig. 4. Interferometric imaging with the Australia Telescope Compact Array show the CH3OH emission, which has a total velocity spread of km s-1 to have a velocity gradient with emission at different velocities aligned in a line, reminiscent of a disk. Other persuasive arguments for an embedded source are the detection of emission in the high excitation (3,3) line of ammonia with a wider linewidth than the lower excitation (1,1) and (2,2) lines (see Fig. 2). Model fits to all three NH3 lines indicate a compact source with a size of , characterized by a rotation temperature of 60 K, while the more extended emission from the ambient cloud has a rotation temperature of 15 K. The NH3 column density of the hot, compact component is 9 times higher than that of the cool extended one. Finally, the infrared spectral energy distribution is best modelled by a source with a luminosity of 1200 , corresponding to a ZAMS star of mass 8 . -band 2MASS data show what possibly is reflected light emanating from the protostellar source, which is embedded in a compact mm-wavelength dust continuum source imaged with the Berkeley-Illinois-Maryland Array (BIMA).
6 Conclusions
The earliest phases of high-mass star formation are expected to be massive (a few hundred to thousand M⊙), cold (10 – 20 K) and quiescent clouds, emitting primarily at (sub)mm wavelenghts and containing no obvious IR sources or star formation tracers. One approach to identify the earliest, cold phases of massive star formation is to search for objects which appear in absorption at MIR wavelengths. Thus IRDCs are the most potential candidates for studying these initial conditions. Centimeter through submm observations reveal that typical IRDCs have gas densities , temperatures and sizes of 1 – 10 pc but studies of their star formation content are still rare.
Studies up to now seem to show that they are not all cold and quiescent. IRDCs appear to harbour sources of different evolutionary stages, not all of them necessarily in the high-mass regime. A better classification scheme based on molecular gas content, MIR contrast and extend is needed to compare IRDCs with local molecular cloud complexes (not clouds). Extensive studies of their energetics, kinematics and chemistry are essential to ascertain their role in forming stars, massive or otherwise. These would be the ideal test grounds for testing the present theories of forming massive stars via turbulent cores (McKee & Tan 2003; see also their contributions to these proceedings). We will need large, Galaxy wide surveys to understand the formation of IRDCs and their lifetimes.
We would like to thank Malcolm Walmsley for comments on the manuscript.
References
- [Bergin and Langer (1997)] Bergin, E.A. and Langer, W.D.1997, ApJ, 486,316
- [Beuther et al.(2002)] Beuther, H., Schilke, P., Menten, K. M., Motte, F., Sridharan, T. K., & Wyrowski, F. 2002, ApJ, 566, 945
- [Bohlin et al.(1978)] Bohlin, R. C., Savage, B. D., & Drake, J. F. 1978, ApJ 224, 132
- [Carey et al.(1998)] Carey, S. J., Clark, F. O., Egan, M. P., Price, S. D., Shipman, R. F., & Kuchar, T. A. 1998, ApJ 508, 721
- [Carey et al.(2000)] Carey, S. J., Feldman, P. A., Redman, R. O., Egan, M. P., MacLeod, J. M., & Price, S. D. 2000, ApJ (Letters) 543, L157
- [Crutcher(1991)] Crutcher, R. M. 1991, IAU Symp. 147: Fragmentation of Molecular Clouds and Star Formation, 147, 61
- [Crutcher et al.(1993)] Crutcher, R. M., Troland, T. H., Goodman, A. A., Heiles, C., Kazes, I., & Myers, P. C. 1993, ApJ, 407, 175
- [Crutcher & Troland(2000)] Crutcher, R. M., & Troland, T. H. 2000, ApJ, 537, L139
- [Danby et al.(1988)] Danby, G., Flower, D. R., Valiron, P., Schilke, P., & Walmsley, C. M. 1988, MNRAS, 235, 229
- [Draine & Lee(1984)] Draine, B. T., & Lee, H. M. 1984, ApJ, 285, 89
- [Egan et al.(1998)] Egan, M. P., Shipman, R. F., Price, S. D., Carey, S. J., Clark, F. O., & Cohen, M. 1998, ApJ, 494, L199
- [Feldman et al.(2003)] Feldman, P. A., Redman, R. O., Carey, S. J., & Wyrowski, F. 2003, SFChem 2002, eds. C. L. Curry & Michel Fich, NRC Press, Ottawa, Canada, p. 292.
- [Fiedler & Mouschovias(1993)] Fiedler, R. A., & Mouschovias, T. C. 1993, ApJ, 415, 680
- [Fiege et al.(2004)] Fiege, J. D., Johnstone, D., Redman, R. O., & Feldman, P. A. 2004, ApJ, 616, 925
- [Fish et al.(2003)] Fish, V. L., Reid, M. J., Argon, A. L., & Menten, K. M. 2003, ApJ, 596, 328
- [Garay et al.(2004)] Garay, G., Faúndez, S., Mardones, D., Bronfman, L., Chini, R., & Nyman, L. 2004, ApJ, 610, 313
- [Goodman et al.(1989)] Goodman, A. A., Crutcher, R. M., Heiles, C., Myers, P. C., & Troland, T. H. 1989, ApJ, 338, L61
- [Hartquist et al.(1995)] Hartquist, T. W., Menten, K. M., Lepp, S., & Dalgarno, A. 1995, MNRAS, 272, 184
- [Hennebelle et al.(2001)] Hennebelle, P., Pérault, M., Teyssier, D., & Ganesh, S. 2001, A&A 365, 598
- [Johnstone et al.(2003)] Johnstone, D., Fiege, J. D., Redman, R. O., Feldman, P. A., & Carey, S. J. 2003, ApJ, 588, L37
- [Kaifu et al.(2004)] Kaifu, N., et al. 2004, PASJ, 56, 69
- [Larson(1985)] Larson, R. B. 1985, MNRAS, 214, 379
- [Leurini et al.(2004)] Leurini, S., Schilke, P., Menten, K. M., Flower, D. R., Pottage, J. T., & Xu, L.-H. 2004, A&A, 422, 573
- [Lis et al.(1994)] Lis, D. C., Menten, K. M., Serabyn, E., & Zylka, R. 1994, ApJ, 423, L39
- [Lis & Carlstrom(1994)] Lis, D. C., & Carlstrom, J. E. 1994, ApJ, 424, 189
- [Lis & Menten(1998)] Lis, D. C., & Menten, K. M. 1998, ApJ, 507, 794
- [Lutz et al.(1996)] Lutz, D., et al. 1996, A&A, 315, L269
- [Mangum & Wootten(1993)] Mangum, J. G., & Wootten, A. 1993, ApJS, 89, 123
- [McKee & Tan(2003)] McKee, C. F., & Tan, J. C. 2003, ApJ, 585, 850
- [Mezger et al.(1990)] Mezger, P. G., Zylka, R., & Wink, J. E. 1990, A&A, 228, 95
- [Mezger et al.(1987)] Mezger, P. G., Chini, R., Kreysa, E., & Wink, J. 1987, A&A, 182, 127
- [Miyama et al.(1987)] Miyama, S. M., Narita, S., & Hayashi, C. 1987a, Progress of Theoretical Physics, 78, 1051
- [Miyama et al.(1987)] Miyama, S. M., Narita, S., & Hayashi, C. 1987b, Progress of Theoretical Physics, 78, 1273
- [Mundy et al.(1987)] Mundy, L. G., Evans, N. J., Snell, R. L., & Goldsmith, P. F. 1987, ApJ 318, 392
- [Ostriker(1964)] Ostriker, J. 1964, ApJ, 140, 1529
- [Padoan & Nordlund(1999)] Padoan, P., & Nordlund, Å. 1999, ApJ, 526, 279
- [] Pillai, T ., Wyrowski, F, Menten, K. M., & Krügel, E., A&A, 2005a, in press
- [] Pillai, T ., Wyrowski, F, Menten, K. M., & Carey, S. J., A&A, 2005b, to be submitted
- [Price(1995)] Price, S. D. 1995, Space Science Reviews 74, 81
- [Perault et al.(1996)] Perault, M., et al. 1996, A&A 315, L165
- [Price et al.(2001)] Price, S. D., Egan, M. P., Carey, S. J., Mizuno, D. R., & Kuchar, T. A. 2001, AJ 121, 2819
- [Redman et al.(2003)] Redman, R. O., Feldman, P. A., Wyrowski, F., Côté, S., Carey, S. J., & Egan, M. P. 2003, ApJ 586, 1127
- [Simon et al.(2004)] Simon, R., Shah, R. Y., Rathborne, J., Jackson, J. M., Bania, T. M., Clemens, D. P., & Heyer, M. H. 2004, ASP Conf. Ser. 317: Milky Way Surveys: The Structure and Evolution of our Galaxy, 317, 159
- [Sridharan et al.(2002)] Sridharan, T. K., Beuther, H., Schilke, P., Menten, K. M., & Wyrowski, F. 2002, ApJ, 566, 931
- [Teyssier,Hennebelle, & Pérault] Teyssier, D., Hennebelle, P., & Pérault, M. 2002, A&A, 382, 624