Dissecting the spiral galaxy M 83: mid-infrared emission and comparison with other tracers of star formation††thanks: Based on observations with ISO, an ESA project with instruments funded by ESA Member States (especially the PI countries: France, Germany, the Netherlands and the United Kingdom) and with the participation of ISAS and NASA.
We present a detailed mid-infrared study of the nearby, face-on spiral galaxy M 83 based on ISOCAM data. M 83 is a unique case study, since a wide variety of MIR broad-band filters as well as spectra, covering the wavelength range of 4 to 18 m, were observed and are presented here. Emission maxima trace the nuclear and bulge area, star-formation regions at the end of the bar, as well as the inner spiral arms. The fainter outer spiral arms and interarm regions are also evident in the MIR map. Spectral imaging of the central () field allows us to investigate five regions of different environments. The various MIR components (very small grains, polycyclic aromatic hydrocarbon (PAH) molecules, ionic lines) are analyzed for different regions throughout the galaxy. In the total 4 m to 18 m wavelength range, the PAHs dominate the luminosity, contributing between 60% in the nuclear and bulge regions and 90% in the less active, interarm regions. Throughout the galaxy, the underlying continuum emission from the small grains is always a smaller contribution in the total MIR wavelength regime, peaking in the nuclear and bulge components. The implications of using broad-band filters only to characterize the mid-infrared emission of galaxies, a commonly used ISOCAM observation mode, are discussed. We present the first quantitative analysis of new H and 6 cm VLA+Effelsberg radio continuum maps of M 83. The distribution of the MIR emission is compared with that of the CO, HI, R band, H and 6 cm radio. A striking correlation is found between the intensities in the two mid-infrared filter bands and the 6 cm radio continuum. To explain the tight mid-infrared–radio correlation we propose the anchoring of magnetic field lines in the photoionized shells of gas clouds.
Key Words.:
Galaxies: individual: M 83 – galaxies: spiral – galaxies: ISM – ISM: dust – ISM: magnetic fields1 Introduction
Galaxies are composed of stars, gas, dust, dark matter, magnetic fields and cosmic rays, with each component responding differently to local and large-scale dynamical effects. A complete and self-consistent galaxy model should incorporate information on the stellar distribution and its relationship to the atomic, molecular and ionized gas and dust and the subsequent interplay between these ingredients, in order to understand the physics controlling the heating, cooling and star-formation processes. These effects will vary widely from galaxy to galaxy on global scales, as well as within a galaxy between the nucleus, the bar, spiral arms, interarm regions, and outer disk regions. We explore various ISM and star formation properties of the well-studied nearby barred spiral galaxy, M 83, using ISOCAM high-resolution mid-infrared (MIR) spectrophotometric and broad-band observations and a high-resolution 6 cm radio continuum map combined from VLA and Effelsberg observations. We compare our data with results from H, optical, CO, HI and X-ray observations.
M 83 is the most prominent spiral galaxy in the nearby Hydra–Centaurus group of galaxies and is one of the largest barred systems in the sky. Due to its proximity (4.5 Mpc, Thim et al. thim+03 (2003)), its near face-on orientation, and relatively low Galactic foreground absorption (, Dickey & Lockman dickey+lockman90 (1990); E(B-V) = 0.066; Schlegel et al. schlegel+98 (1998)), it is ideally suited for the study of morphological and physical variations of the ISM. M 83 has been observed extensively at different energies, ranging from the long-wavelength radio to the X-ray bands. A rather large data set has been accumulated including atomic gas (Huchtmeier & Bohnenstengel hucht+bohnen81 (1981); Tilanus & Allen tilanus+allen93 (1993)), H (Ryder et al. ryder+95 (1995); Lundgren et al. lundgren+05 (2005)), the molecular gas (Handa et al. handa+90 (1990); Petitpas & Wilson petit+wilson98 (1998); Crosthwaite et al. crost+02 (2002); Lundgren et al. 2004a ; Lundgren et al. 2004b ; Sakamoto et al. sakamoto+04 (2004)) and X-rays (Trinchieri et al. trinchieri+85 (1985); Ohashi et al. ohashi+90 (1990); Okada et al. okada+97 (1997); Ehle et al. ehle+98 (1998); Immler et al. immler+99 (1999); Soria & Wu soria+wu02 (2002); soria+wu03 (2003)). M 83 is also bright in radio continuum due to its high star-formation rate and strong magnetic field. Highly polarized emission found in M 83 suggests a regular magnetic field with a spiral pattern (Neininger et al. neininger+91 (1991); neininger+93 (1993)).
This study was motivated by the rich assortment of MIR ISO data on M 83. By now, almost 10 years after the launch of ISO, we are beginning to understand the utility of the various tracers in the MIR wavelength domain.
This paper is organized as follows: Section 2 presents the observational details, Section 3 the decomposition and description of the MIR spectral signatures in various selected regions within M83. The spectral information is then used to decipher the broad-band observations. This is an important demonstration of what is actually being traced by the ISOCAM broad-bands; simple interpretations of the broad-bands do not apply everywhere in a galaxy. We also explore the ratios of the mid-infrared PAH bands throughout the galaxy. Section 4 presents the radio continuum interpretation of M 83. Section 5 presents the MIR observations in light of H, X-ray emission and molecular gas. In Section 6 we discuss the spatial distributions of the various tracers and zoom into the bar, the nuclear region and the south-eastern spiral arm. In Section 7, we quantify the correlations between the intensities of the MIR bands and the other ISM components presented here and discuss the utility of the MIR characteristics as a tracer of star formation.
2 Observations and data analysis
Observation logs and relevant instrument features for the mid-infrared (MIR) and radio continuum observations are presented in Table 1 and Sect. 2.3, respectively. For some of the published images, we present overlays of our data on the published images (Figures 7–10, 12 ,13). References of the published data used for analysis purposes in this paper, along with instrumental features, are given in Table 2.
| Filter | Band | Date | Mean exposure | Raster | Field size | TDT |
|---|---|---|---|---|---|---|
| (m) | (sec) | mode | (kpc) | number | ||
| LW1 | 4.00–5.00 | 16 Aug 1997 | 243 | 7 | 63900451 | |
| LW2 | 5.00–8.50 | 23 Aug 1997 | 224 | 17 | 64700246 | |
| LW3 | 12.0–18.0 | 23 Aug 1997 | 224 | 17 | 64700350 | |
| LW4 | 5.50-6.50 | 16 Aug 1997 | 243 | 7 | 63900451 | |
| LW5 | 6.50–7.00 | 16 Aug 1997 | 243 | 7 | 63900451 | |
| LW6 | 7.00–8.50 | 08 Aug 1997 | 234 | 7 | 63200147 | |
| LW7 | 8.50–10.7 | 08 Aug 1997 | 234 | 7 | 63200147 | |
| LW8 | 10.7–12.0 | 08 Aug 1997 | 234 | 7 | 63200147 | |
| LW9 | 14.0–16.0 | 08 Aug 1997 | 234 | 7 | 63200147 | |
| CVF | 5.00–16.5 | 24 Aug 1997 | single obs. | 4 | 64800263 |
| Field size | FWHM | Reference | |
| or field of view (FOV) | () | ||
| Calibrated H | 1.1 | Lundgren et al. lundgren+05 (2005) | |
| H i | 12 | Tilanus & Allen tilanus+allen93 (1993) | |
| CO (=1–0) | South-eastern spiral arm | Rand et al. rand+99 (1999) | |
| CO (=1–0) | Nuclear region and bar | 16 | Handa et al. handa+90 (1990) |
| CO (=1–0) | 22 | Lundgren et al. 2004a | |
| CO (=2–1) | 14 | Lundgren et al. 2004a | |
| CO (=3–2) | Nuclear region | 14 | Petitpas & Wilson petit+wilson98 (1998) |
| X-rays, ROSAT PSPC | 25–52 | Ehle et al. ehle+98 (1998) | |
| Radio continuum ( cm) | This paper |
1 And additional points with stepping close to the nucleus
2.1 ISOCAM images
The MIR data were obtained with the Infrared Space Observatory (ISO; Kessler et al. kessler+96 (1996)) using the ISOCAM instrument (Cesarsky et al. cesarsky+96a (1996)). This instrument provided imaging modes with a variety of broad-band filters from 4 m to 18 m (LW1–LW9) and a spectral imaging mode, using a circular variable filter (CVF) from 5 m to 16.5 m. Table 1 displays more details of the various filters used for the data presented here. The ISOCAM detector has a pixel field of view, and here one pixel corresponds to () on the sky. The full-width-at-half-maximum (FWHM) of the diameters of the point spread functions (PSF) with a pixel size range from at 7m to for 15 m.
The LW2 and LW3 broad-band filters, centered at 6.7 m and 15 m, respectively, were used to observe raster maps, which contain the full galaxy plus sky background. The images overlapped by half of an array size, shifted by 1/2 of a pixel, and were combined to obtain a total image covering a field of (). Other filter bands were observed in a raster mode, covering () fields centered on the nucleus of M 83 (see Table 1). Given the optical extent of the galaxy of (), determination of the field background is somewhat limited for the raster maps, while it is more straight forward for the raster maps. Thus, we determined the background from regions of our map outside the optical extent of M 83, located between and 9′ from the center. Subtracting these backgrounds, M 83 is detected with a total MIR flux of 20 Jy and 21 Jy in the LW2 (6.75 m) and LW3 (15.0 m) band, respectively. Typical errors are of the order of , and our fluxes compare well to those of Roussel et al. (2001b ), as well as with the IRAS m flux of 26 Jy with an error of the same order as our MIR values.
The filters used for the strip maps include a variety of narrow-bands within the broader wavelength domain of the LW2 and LW3 bands (cf. Table 1 and the sketched bandwidths in Figs. 3 and 4). The narrow-band filters allow us to interpret the MIR contributions with better accuracy. While not covering the complete optical diameter of the galaxy, the strip maps of M 83 with scan direction from the north-east to the south-west (), offer the advantage of determining the field background more precisely. The background values for the strip maps were extracted from 2 regions of (long axis perpendicular to major axis of the strip) beyond the optical extent of the galaxy. We verified the LW2 and LW3 background determination from the raster maps, using the variety of strip maps.
The data analysis was performed within the CEA/CIR (Chanial & Gastaud chanial+gastaud00 (2000)) and ESO/MIDAS software environments.
Most cosmic ray impacts, resulting in short duration glitches, were removed using a multi-resolution median filtering technique in CIR, while, for the non-classical longer duration glitches, more sophisticated secondary techniques described in Roussel et al. (2001a ) were employed. Transient effects, due to long term memory effects of the detectors before stabilization is achieved, were corrected using the Fouks-Schubert method (Coulais & Abergel coulais+00 (2000)). The flat-field correction was computed by masking the source and computing the median of the remaining field. See Roussel et al. (2001a ) for more specific details.
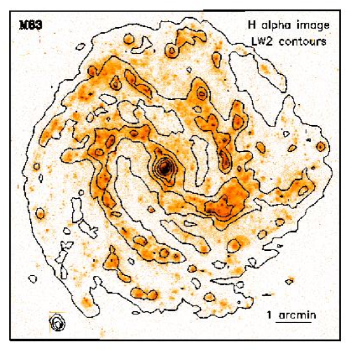
Figures 1a and b show the entire galaxy in the MIR light centered at 6.75 m (LW2; resolution ) and 15.0 m (LW3; resolution ).
Since the broad-band images can contain emission from various dust components, molecules, ionic species, etc.(see Sect. 3.1), spectro-imaging data were also obtained with a single array setting of the central () region of M 83 to facilitate the interpretation of the broad band observations. The spectral resolution of the CVF was 40. Transient correction, deglitching and flat fielding were performed, basically, as for the broad-band observations described above. Since the array was never off the galaxy completely, background subtraction was not done in the usual manner as described above for photometric mapping observations. Rather, the maximum and minimum zodiacal light spectra were estimated and subtracted from the galaxy spectrum, providing limits to the resulting spectrum. This procedure is described in detail in Roussel et al. (2001a ).
2.2 Astrometry corrections of the ISOCAM observations
To test the position accuracy of the MIR data, we searched for optical counterparts of the MIR sources outside the optical extent of M 83 in the Digitized Sky Survey-2 (DSS-2) image of the M 83 field (from the ESO online archive). For the LW2 image, we found counterparts for five MIR sources (three foreground stars, two background galaxies). A transformation matrix from the proposed MIR astrometry to the astrometry implied by the optical image was calculated. A translation of to the west and to the south, and, in addition, a clockwise rotation of was proposed. We corrected the LW2 image for these values achieving a position accuracy of , and then used the LW2 image when overlaying MIR data on images at other wavelengths.
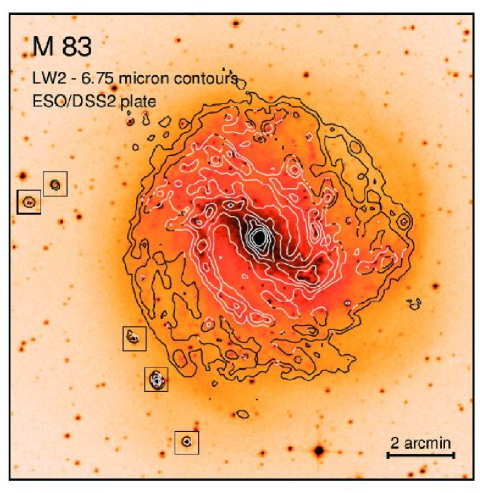
An overlay of the rotated and shifted LW2 data on the DSS image of M83 is presented in Fig. 2.
2.3 Radio continuum
M 83 was observed at 4.885 GHz ( cm) with the VLA synthesis radio telescopes by NRAO111The National Radio Astronomy Observatory is a facility of the National Science Foundation operated under cooperative agreement by Associated Universities, Inc. in its DnC configuration on 1992 June 27 and 28 by S. Sukumar. To cover most of the galaxy, two fields were observed, centered at (north-west) and (south-east). Maps of the two fields were generated with a synthesized beam of half-power beam width, corrected for primary-beam attenuation and combined into one map. The rms noise is Jy per beam over the region of the main spiral arms, but increases towards the edges of the map. As the VLA map does not include any structures of more than about extent, most of the diffuse radio emission is not detected.
A field of encompassing M 83 was observed in 1996 with the Effelsberg 100-m telescope222The 100-m Effelsberg telescope is operated by the Max-Planck-Institut für Radioastronomie on behalf of the Max-Planck-Gesellschaft (MPG). using the 4.85 GHz receiver system providing an angular resolution of . The final map has an rms noise of mJy per beam. Emission from M 83 is detected out to about ( 8 kpc) radius.
The VLA and Effelsberg data were merged in the Fourier plane using IMERG based on NRAO’s SDE software (see Beck & Hoernes beck+hoernes96 (1996)). The final map has the same angular resolution and rms noise as the original VLA map, but includes all diffuse extended emission (about 35 of the total flux) detected with the Effelsberg single-dish. The map is shown in Fig. 1c. The polarization map was presented by Beck (beck02 (2002)) and will be discussed in a future paper (Beck et al. beck+05 (2005)).
3 Results
3.1 The ISOCAM MIR View of M 83
The ISOCAM CVF wavelengths ranges from 5 m to 17 m and traces a variety of dust components as well as ionic and molecular gas lines, depending on local environmental conditions within galaxies. The MIR dust components primarily consist of 2 types in galaxies: (1) small particles or large molecules (e.g., polycyclic aromatic hydrocarbon molecules; PAHs 333Although the precise nature of these particles is uncertain, we will refer to these as PAH bands throughout the paper.), stochastically heated, undergoing large temperature fluctuations of the order of hundreds of K on short timescales as a result of single photon heating processes (e.g. Puget & Leger puget+84 (1984); Sellgren et al. sellgren+90 (1990); Allamandola et al. allamandola+89 (1989); Verstraete et al. verstraete+01 (2001); Krügel krugel03 (2003)), with major emission bands primarily at 3.3 m, 6.2 m, 7.7 m, 8.6 m, 11.3 m and 12.7 m; (2) very small grains (VSGs) which typically have sizes in our Galaxy in the range of 1 nm–150 nm (Désert et al. desert+90 (1990)) and which are the origin of the MIR continuum in our ISOCAM spectra, longward of 11 m. These VSGs, representing a range of temperatures, could be either stochastically heated or in thermal equilibrium, depending on the radiation field properties and grain sizes. Both PAHs and VSGs are excited mostly via UV photons in the vicinity of active star formation regions. The PAHs are observed to peak in the photodissociation regions (PDRs), which are the interface regions between molecular cores and H ii regions. The VSGs emit prominently in the nebular regions (e.g. Cesarsky et al. cesarsky+96b (1996); Verstraete et al. verstraete+96 (1996)). On the other hand, PAHs can also be excited by less energetic means, such as optical photons, as evidenced by their presence in the diffuse interstellar medium (ISM) (Chan et al. chan+01 (2001)) and elliptical galaxies (e.g. Athey et al. athey+02 (2002); Xilouris et al. xilouris+04 (2004)).
In the case of more active regions, such as the nuclei of normal galaxies, starbursts or active galactic nuclei, various nebular lines can also be observed in the ISO MIR wavelength range (e.g. Genzel et al. genzel+98 (1998); Rigopoulou et al. rigopoulou+02 (2002); Sturm et al. sturm+02 (2002); Lutz et al. lutz+03 (2003); Förster Schreiber et al. forster+03 (2003); Verma et al. verma+03 (2003); Madden et al. madden+05 (2005)). In spiral galaxies (i.e. Roussel et al. 2001a ; 2001b ) the nuclear region can show a 12.8 m [NeII] line, and in harder radiation fields the 15.6 m [NeIII] line can be present, too. A more detailed discussion of the general MIR characteristics of spiral galaxies and starbursts is given, e.g., in Vigroux et al. (vigroux+99 (1999)), Dale et al. (dale+00 (2000)), Genzel & Cesarsky (genzel+cesar00 (2000)) and Krügel (krugel03 (2003)).
3.2 Spectral properties of the nucleus, spiral arms, bulge and interarm regions
| Region | PAHs | Cont. | PAHs: | PAHs: | PAHs: | PAHs: | LW2/LW3 | LW9/LW6 | PAHs | PAHs |
| (see | total | Cont. | Cont. | Cont. | from CVF | from CVF | 6.2 : 7.7 : 8.6 : 11.3 | 11.3/12.8 | ||
| Fig.3) | erg/s | erg/s | 4–18 | 4–18 | LW2 | LW31 | 6.7/15m | 15/7.7m | m | m |
| /cm2 | /cm2 | m | m | |||||||
| (1) | 10.7 | 6.6 | 0.62 | 1.6 | 13 | 0.26 | 0.57 | 1.1 | 0.32 : 1 : 0.16 : 0.22 | 1.25 |
| (2) | 71.3 | 31.5 | 0.69 | 2.3 | 17 | 0.34 | 0.69 | 0.8 | 0.31 : 1 : 0.22 : 0.29 | 1.49 |
| (3) | 42.0 | 17.7 | 0.70 | 2.4 | 13 | 0.6 | 0.91 | 0.6 | 0.37 : 1 : 0.19 : 0.33 | 1.37 |
| (4) | 3.4 | 1.1 | 0.76 | 3.0 | 20 | 0.7 | 1.22 | 0.4 | 0.29 : 1 : 0.26 : 0.29 | 1.41 |
| (5) | 2.7 | 0.3 | 0.90 | 9.1 | 3.3 | 1.75 | 0.2 | 0.42 : 1 : 0.11 : 0.59 | 2.48 |
1 A possible blend of the PAH band with the [Neii] line at 12.8 m cannot be resolved by the CVF. Typical contributions to the [Neii] line are expected to be small (e.g. Roussel et al. 2001a ; Sturm et al. sturm+00 (2000)), and are assumed to be below 30, with the remainder attributed to the PAH feature.
In order to determine the MIR properties of various environments within a typical spiral galaxy, such as M 83, the galaxy is subdivided into the following regions (outlined in Fig. 3) from which we extracted spectra for comparison:
-
1.
The central and brightest () pixel around the nucleus of M 83. This includes much of the starburst arc of the central region of the galaxy (Sakamoto et al. sakamoto+04 (2004))
-
2.
A () region centered on the nucleus, excluding the innermost pixel and containing the extended circumnuclear environment
-
3.
A () region highlighting the bulge and centered on the nucleus, excluding the nuclear regions (1) and (2)
-
4.
A () region centered on the SW spiral arm and excluding the bulge region
-
5.
An interarm region containing two () regions between the bulge and inner spiral arms.
Figure 3 (middle panel) displays the variety of spectra for the different regions. For the spectrum of region (5), the interarm region, the 2 regions on either side of the bulge are averaged to enhance the signal to noise ratio. The most striking features identified in the spectra of Fig. 3 toward all regions are the PAH bands at 6.2 m, 7.7 m, 8.6 m and 11.3 m, and a blended [NeII] and PAH feature at 12.8 m. There is a general tendency for the continuum emission from hot grains beyond 13 m to peak toward the nucleus, and to decrease toward the outer, more quiescent regions, as demonstrated in Fig. 3 (bottom panel, where the spectra are normalized at 7.7 m). This was also illustrated for other spiral galaxies in Roussel et al. (2001a ) and starburst galaxies (i.e. Förster-Schreiber et al. forster+03 (2003)). The shape and the intensity of the spectra from 5 m to 11 m, dominated by the cluster of PAH bands, varies less so throughout the galaxy.
For quantitative analysis we decomposed the spectra, fitting them with 3 components (Laurent et al. laurent+00 (2000)): 1) PAH bands (the major PAH bands: 3.3 m, 6.2 m, 7.7 m, 8.6 m, 11.3 m and 12.7 m and the less prominent bands: 5.3 m, 5.7 m, 12.0 m, 13.6 m and 14.3 m) were fitted with Lorentzian profiles (i.e. Boulanger et al. boulanger+98 (1998)); 2) the ionic lines ([Arii] 7.0 m, [Ariii] 9.6 m, [Siv] 10.5 m, [Neii] 12.8 m and [Neiii] 15.6 m) were modeled with Gaussian profile characteristics and 3) the continua were assumed to have power-law shapes. The central wavelengths were fixed and the program computed the width and intensity. The index of the continuum power law was a free parameter. The different spectral components of the CVF spectra are illustrated in Fig. 4 for the case of region (1). The figure shows the observed CVF spectrum (above panel), the model lines and bands plus continuum for comparison (middle panel). The very low residual emission (Fig. 4 bottom panel) after the subtraction of the model spectrum from the observation, speaks well for the assumptions in the modeling of the CVF spectra. The model fits are used for quantitative comparisons in the following discussion.
Typical flux densities for the brightest PAH features are mJy, while atomic line contributions are smaller, the largest being the [Neii] 12.8 m line (0.2 mJy) towards the nucleus. We detect minor contributions from the [Arii] 7.0 m line. The [Neiii] 15.6 m line appears to be present in the nucleus (regions 1 and 2) and the bulge (region 3) and not evident in regions 4 (on arm) and 5 (interarm). Throughout the galaxy, PAHs seem to be ubiquitous and account for the majority of the MIR 4 to 18 m luminosity (Table 3). The continuum emission is at most 40% of the total MIR emission toward the central starburst core (region 1), and decreases away from the central region. Toward the interarm region (region 5), the PAHs account for almost all of the MIR energy. Both the LW2 and LW3 images (Sect. 3.5), as well as the CVF spectra, show MIR emission in the form of PAH bands but no significant continuum towards the interarm or outer regions. Toward diffuse regions of the Galaxy, the PAH bands are the fundamental component of the MIR emission (e.g. Mattila et al. mattila+96 (1996); Lemke et al. lemke+98 (1998); Chan et al. chan+01 (2001)).
3.3 Using the CVF to determine the broad-band composition
The ISOCAM LW2 (5.0–8.5 m) and LW3 (12.0–18.0 m) bands were popular broad-bands observed with ISO and often were the only observations used to characterize the MIR ISM of galaxies. Depending on the type of galaxy, these bands encompass various components to varying degrees. Often it was simply assumed that the LW2 band is dominated by PAH bands, while the LW3 traces the dust continuum. Here we take advantage of the fact that a variety of broad-bands as well as CVF spectra were obtained for M 83 to quantify the contribution of the various MIR components to each of these broad-bands, using the CVF spectra. We can then interpret the ISOCAM MIR broad-band LW2/LW3 ratio in galaxies more accurately.
In Table 3 we present the results for the modeled CVF for the different regions in M 83 (refer to Fig. 3 for definitions of the region numbers) extracting continua and PAH band contributions. The cluster of PAH bands at 8 m (6.2, 7.7, 8.6 m) is always dominant in the LW2 broad-band filter throughout M 83, with the continua being on the order of about 5% of the total LW2 broad-band flux. We do not detect any substantial contribution from the very hot grain continua or stellar emission from evolved populations, emitting below 9 m in the CVF spectra. Hot grain continuum emission at these shorter MIR wavelengths has been detected in active galactic nuclei and prominent starbursts (Hunt et al. hunt+02 (2002); Madden et al. madden+05 (2005)). In early-type galaxies, this spectral range is dominated by stellar emission (e.g. Xilouris et al. xilouris+04 (2004)). A substantial fraction of the flux in the LW3 band arises from the continuum emission: 75% to 80% in the central region, 60% in the bulge and spiral arms. In the more quiescent interarm regions, however, the 12.7 m PAH band dominates the LW3 band emission (75%).
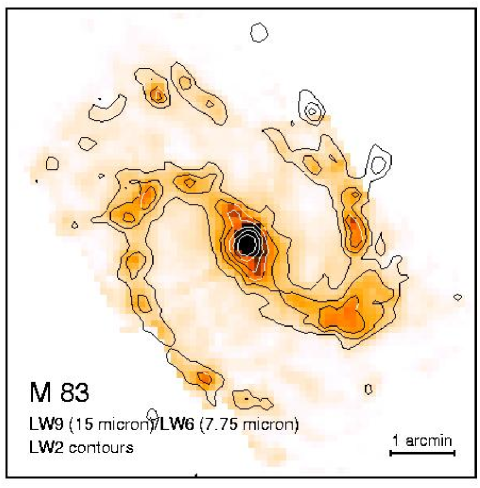
While it is tempting to use the LW2/LW3 ratio to study the MIR emission in galaxies, given the different emission features contributing to the broad-band filters, it would be preferable to choose a filter isolating a PAH band only, and another which selects only the continuum of m. The LW6 broad-band filter (7.0 m to 8.5 m), for example, only traces the 7.7 m PAH band and part of the 8.6 m PAH band while the LW9 (14.0 m to 16.0 m) filter traces the 15 m continuum (when the [Ne III] line is not present, as is the case here), removing possible ambiguities (Fig. 4). The CVF predicts a ratio of LW9/LW6 (15 m continuum) / (7.7 m PAH) of 1.1 for the nuclear region and decreases to 0.2 for the diffuse interarm region. In M 83 the dynamical range of the LW9/LW6 intensity ratio (factor of 5, see Fig. 5) is larger than that of the LW2/LW3 ratio (factor of 2, see Sect. 3.5), making it a more sensitive tool to distinguish different physical regions of a galaxy.
3.4 PAH band ratios in M 83
The ratios of the PAH band intensities are a means of testing the validity of the PAH model assumption for the 6.2 m, 7.7 m, 8.6 m and 11.3 m and 12.7 m bands (e.g. Jourdain de Muizon et al. jourdain+90 (1990); Schutte et al. schutte+93 (1993); Allamandola et al. allamandola+99 (1999)). We normalize each spectrum to the prominent 7.7 m PAH band (Fig. 3) and inspect the PAH band ratios in the different regions in M 83. The ratios of the PAH bands 6.2 m : 7.7 m : 8.6 m: 11.3 m vary, at most, by a factor of 1.5 for regions 1, 2, 3 and 4 (Table 3), which sample very different ISM conditions from the starburst core, to a spiral arm and bulge. The PAH ratios, however, deviate more significantly in the diffuse, interarm region (region 5), with a particularly large value of 0.59 for the 11.3/7.7 ratio, 2.5 times larger than toward the nuclear region. Large variations of the 11.3/7.7 ratio have been seen in a wide variety of Galactic and extragalactic sources (Vermeij et al. vermeij+02 (2002); Galliano galliano04 (2004)) with no obvious systematic variation with radiation field intensity or hardness (Chan et al. chan+01 (2001)). PAH band ratios vary over only 40% in reflection nebulae with 3 orders of magnitude variation in radiation field intensity (Uchida et al. uchida+00 (2000)). A precise conclusion as to what is controlling these observed variations is not yet clear. Differences in chemical structure, such as compact versus open structures, may be one explanation for the observed variations (Vermeij et al. vermeij+02 (2002)). Laboratory experiments may eventually shed light on the nature of the observed PAH band ratios.
3.5 LW2 and LW3 broad-band images of M 83
Fig. 2 shows highly structured MIR emission from the entire optical extent of M 83. The brightest MIR region is coincident with the nucleus of M 83. The emission from the bulge region is extended, at the ISOCAM resolution, along the leading edge of the bar of the galaxy. The south-western and north-eastern ends of the bar are associated with prominent MIR emission regions, which are also present in the radio and in H maps (Sec. 4). The MIR morphology argues for the existence of gas and dust in these bar/interstellar medium interfaces.
The inner spiral arm pattern of the galaxy is prominent in the LW2 and LW3 bands (Fig. 1a and b) while MIR diffuse emission of lower intensity is detected from the interarm regions. Both LW2 and LW3 images show a lane of enhanced emission in the interarm region between the bulge and the south-eastern inner spiral arm. The “interarm lane” is also visible on the radio image (Fig. 1c) as well as on the optical image (Fig. 2). It is a narrow spiral arm (highly polarized in radio continuum, see Fig. 3 in Beck beck02 (2002)) with a relatively low star-formation rate.
The morphology of the galaxy is very similar in LW2 and LW3, hence, we have chosen the LW2 map for overlays on images of other wavelengths, since the signal-to-noise ratio of the LW2 map is superior to that of the LW3 map.
The ratio of LW2/LW3 is known to vary little across the disk of a spiral galaxy and observed to be of the order of 1 in most galaxies (Helou et al. helou+96 (1996); Vigroux et al vigroux+99 (1999); Roussel et al. 2001a ; Roussel et al. 2001b ). These MIR bands have often been used as a diagnostic along with FIR colors in an ISO-IRAS color-color diagram (Vigroux et al. vigroux+99 (1999); Dale et al. dale+00 (2000)). LW2/LW3 1 when the LW2 band is composed completely of PAH bands and the LW3 band has both continuum and PAH band emission, in mostly equal parts. This occurs when the ISM is dominated by neutral regions and photodissociation regions (PDRs), as is the case for much of the disk material in galaxies. Toward H ii regions, the rapidly-rising hot dust continuum emission accounts for most of the LW3 band, thus, the LW2/LW3 ratio decreases to 0.5. This ratio does not vary significantly from normal, quiescent galaxies to mildly-active galaxies as the IRAS f(60m)/f(100m) increases. However, starburst galaxies and AGNs show a dramatic decrease in the LW2/LW3 ratio due to two effects operating simultaneously, the suppression of the PAH band emission in LW2, presumably through the destruction of its carriers, and the dominance of hot 15m dust continuum emission in LW3 (e.g. Dale et al. dale+00 (2000); Roussel et al. 2001b ). Toward the starburst core and surrounding nuclear region of M 83 (regions 1 and 2) the LW2/LW3 ratios are between 0.57 and 0.69 (Table 3), where the continuum emission accounts for 75 to 80% of the total MIR emission. The ratio for the bulge (region 3) is about 90%, while in regions 4 and 5 the PAH bands contribute 50% or more to the total MIR emission.
M 83 is a good illustration of the diagnostic capability of the MIR colors. Using the CVF spectra to quantify the components of the LW2 and LW3 broad-bands, we see that the LW2/LW3 ratio does provide an accurate tool to probe the PAH band versus hot dust contributions in the more active regions, such as the nucleus (see also Roussel et al. 2001a ; 2001b ). However, this broad-band ratio becomes more ambiguous outside of the nuclear region, as the PAH band to continuum ratio increases. In these regions, it is necessary to have other accurate indicators of the MIR components contained within these broad-bands.
| Central | |||||||
|---|---|---|---|---|---|---|---|
| m | Jy | Jy | Jy | ||||
| LW1 | 4.5 | 0.8 | 0.6 | ||||
| LW2 | 6.7 | 2.5 | 2.0 | 20 | 16 | ||
| LW3 | 14.3 | 2.9 | 0.9 | 21 | 6.6 | ||
| LW4 | 6.0 | 1.8 | 0.8 | ||||
| LW5 | 6.8 | 2.4 | 0.4 | ||||
| LW6 | 7.7 | 4.4 | 1.5 | ||||
| LW7 | 9.6 | 2.1 | 0.7 | ||||
| LW8 | 11.3 | 4.2 | 0.6 | ||||
| LW9 | 14.9 | 2.2 | 0.2 |
3.6 The ISOCAM strip maps: 4.5, 7.7 & 15 m
In general, the strip images reveal similar morphological features as seen in the LW2 and LW3 images. The measured fluxes and luminosities for the individual ISOCAM filters are given in Table 4.
In the following, we will focus on the LW1 (4.0–5.0 m), the LW6 (7.0-8.5 m) and the LW9 (14.0–16.0 m) strip maps.
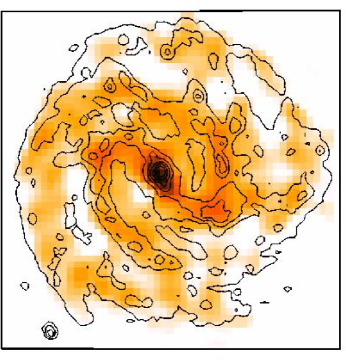
We show a LW9/LW6 ratio map in Fig. 5. The ratio map, overlaid with the LW2 (central wavelength: 6.75 m) contours, shows enhanced LW9/LW6 ratios toward regions of high star-formation activity, for example, in the nuclear region and spiral arms. Regions of peaked LW2 emission, which traces the cluster of PAH bands show, in general, enhanced LW9/LW6 ratios. The enhanced ratios might be interpreted in terms of (a) increasing densities of the very small grains (VSGs) traced by the continuum of LW9 and (b) possibly increasing temperatures of these grains, if they are in thermal equilibrium. In reality, the VSGs represent grains with a size distribution, and temperature distribution (Désert et al. desert+90 (1990)). On Galactic scales, the hot dust grain emission peaks towards the H ii regions, where the PAHs (traced by the LW6 band) show a minimum (e.g. Cesarsky et al. cesarsky+96b (1996); Verstraete et al. verstraete+96 (1996); Henning et al. henning+98 (1998)). PAHs are seen to peak in the photodissociation regions around molecular clouds in the vicinity of star-formation regions.
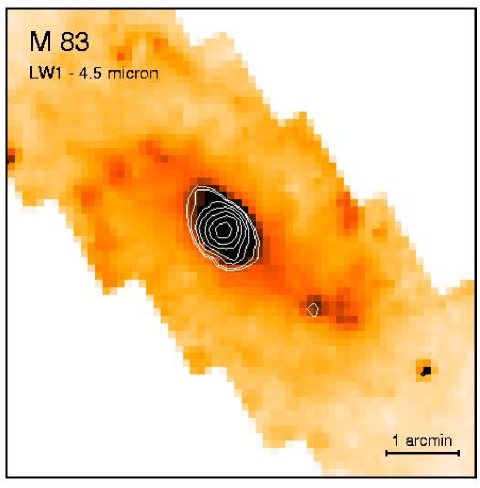
We also show the LW1 strip map which traces the evolved stellar contribution at 4 m–5 m (Fig. 6). While the bar is also obvious in the 4.5 m image, the contrast is not as sharp as in the LW2 or LW3 image, demonstrating the evolved stellar component of the bulge being more dominant over the narrow star-forming bar component (compare Fig. 6 with Figs. 1a and b). The differences between the LW2 and LW1 images speak against a strong contribution of stars ( 20% for such a late type galaxy such as Sc) to the LW2 image, as has been argued before (e.g. Boselli et al. bos+03 (2003)).
4 The radio view of M 83
The cm radio continuum map (total intensity) derived from VLA and Effelsberg data is presented in Fig. 1c. The radio emission is dominated by the non-thermal synchrotron process. Neininger et al. (neininger+93 (1993)) found that the ratio between large-scale non-thermal and thermal emission at cm varies from in the inner region of M 83 to in the outer parts. However, the thermal fraction may increase locally in star-forming regions of spiral arms. Our new separation of thermal and non-thermal emission at resolution (see Sect. 7.1) reveals a thermal fraction at cm which is 25% on average, but up to 70% locally in spiral arms. Very similar results were obtained for the spiral galaxy NGC 6946 (Walsh et al. walsh+02 (2002)).
The synchrotron intensity, , is proportional to where is the energy density of cosmic-ray electrons in the relevant energy range, is the strength of the total field component in the sky plane, and is the non-thermal spectral index (defined as ). In case of (often assumed) energy density equipartition between cosmic rays and magnetic fields, . Thus synchrotron intensity is a sensitive measure of field strength and its variations.
Emission from the bar is concentrated toward the outer edge (i.e. leading with respect to the galaxy’s rotation). This can be regarded as a signature of a shear shock due to gas infall on the inner side of the bar (see numerical models e.g. by Athanassoula athana92 (1992)). If the magnetic field is compressed together with the gas, a compression ratio of 4 in a strong adiabatic shock should result in an increase in synchrotron intensity of a factor of 16 if the density of cosmic-ray electrons is constant (assuming , see Sect. 7.1). This factor could be larger if the cosmic-ray density also increases in the shock (energy equipartition). However, the intensity contrast between the radio bar and its surroundings is only , similar to NGC 1097, a galaxy with a larger bar (Beck et al. beck+99 (1999)). Either the shock generates magnetic turbulence, or the magnetic field is not frozen into the gas flow, or the shock has a complex 3-D structure. Better numerical models, which take magnetic fields into account, are required.
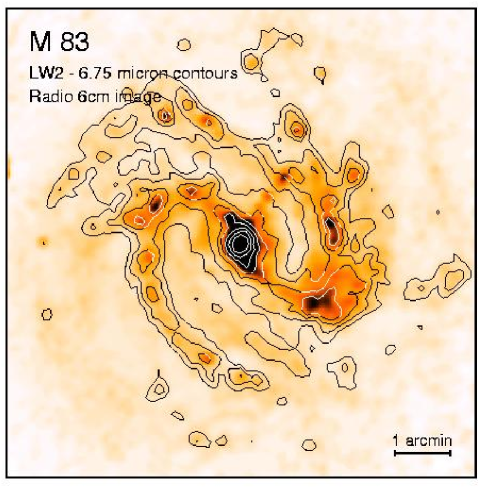
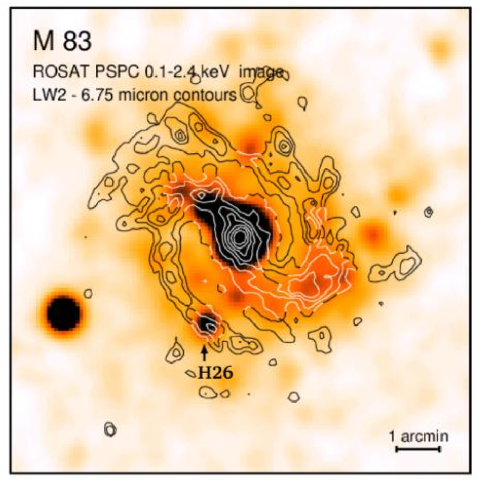
Fig. 7 demonstrates the close association between the radio emission and the MIR dust emission. This is most obvious in the spiral arm 2 to 3 north of the center, where both the radio continuum and dust distribution reveal a sharp edge while the optical spiral arm extends much further to the north.
Three sources, which are not obvious in the MIR images but appear in the radio map at – north-west of the center (Fig. 7), are supernova remnants and/or background quasars. Their positions do not coincide with any of the observed 20th century supernova events. In principle, supernova remnants and dusty quasars have been detected at MIR wavelengths with ISOCAM (e.g. Lagage et al. lagage+96 (1996); Arendt et al. arendt+99 (1999); Leech et al. leech+01 (2001)). While it is conceivable that a hint of MIR emission is detected toward these radio sources, they are not detectable at the sensitivity and angular resolution of these images.
The close correlation between radio continuum and mid-infrared dust emission is indeed striking in M 83 (Fig. 7 and Figs. 1a, b, c) and in NGC 6946 (Frick et al. frick+01 (2001); Walsh et al. walsh+02 (2002)). The explanation is far from being trivial (see Sect. 7.3).
5 Comparison of the MIR morphology with further tracers of the interstellar medium
5.1 H emission
The H image of M 83 was initially presented in Lundgren et al. (lundgren+05 (2005)). The FWHM of the PSF is (30 pc). The calibrated H image (Fig. 1d) is used here for quantitative comparison with the radio and MIR emission, both of which have spatial resolutions poorer than that of H.
Fig. 8 presents the LW2 contours overlaid on the H image of Lundgen et al. (lundgren+05 (2005)). In general, the MIR emission and H emission highlight the same region, but differences exist, e.g. in the north-east (Sect. 4). The spiral arms are traced well at both wavelengths, and many of the bright H emission regions correspond to local maxima of the MIR emission. Diffuse H emission is also present throughout the interarm region. The correlation between MIR and H is discussed in Sec. 7.4.
5.2 Diffuse X-ray emission
M 83 was observed with the Einstein (Trinchieri et al. trinchieri+85 (1985)), GINGA (Ohashi et al. ohashi+90 (1990)), ASCA (Okada et al. okada+97 (1997)) ROSAT (Ehle et al. ehle+98 (1998); see Fig. 9; Immler et al. immler+99 (1999)) and Chandra (Soria & Wu soria+wu02 (2002); Soria & Wu soria+wu03 (2003)) observatories. Diffuse X-ray emission was detected by ROSAT as well as by Chandra. From spectral investigations, roughly 65% of the diffuse X-ray emission was attributed to a million degree component of the ISM, while the remaining part was attributed to unresolved point sources. While Chandra was well suited to clearly resolve the starburst nucleus region (see Sect.6.2) for the first time and to detect the discrete source population in M 83, the diffuse extended emission could be traced (after spatial smoothing) only from the optically bright spiral arms.
ROSAT PSPC, in contrast, showed extended X-ray radiation from almost the whole optically visible part of that galaxy. Ehle et al. (ehle+98 (1998)) interpreted the diffuse X-ray emission as a multi-temperature thermal plasma: a soft X-ray emitting spherical halo component and a hotter disk component, dominating the emission in the harder 0.5–2.0 keV ROSAT band.
5.3 Molecular gas
Comparison of the distribution of the CO(=1–0) emission at 22″ angular resolution (Lundgren et al. 2004a ) with that of the MIR dust emission shows very good spatial agreement in the disk (see Fig. 10). However, there are also displacements: local peaks (or in some cases crests) of CO(=1–0) emission appear to be shifted about 10–20″, but there is no apparent systematic trend such that the CO(=1–0) emission lies outside the MIR emission or vice verse. The local maxima of the MIR emission are better aligned with those of the CO(=2–1) emission with 14″ resolution (Lundgren et al. 2004a ). This is perhaps not so surprising since molecular gas clouds in regions with active star formation are likely to have an increased kinetic temperature (and perhaps also higher density), resulting in stronger emission from higher- emission lines.
The central peak in the MIR data agrees well with the IR center position (Gallais et al. gallais+91 (1991)). The nucleus appears as a single peak in the MIR data and does not have the double-peaked nature seen in the CO(=1–0) (Handa et al. handa+94 (1994)), CO(=2–1) (Lundgren et al. 2004a ) and CO(=3–2 and =4–3) data (Petitpas & Wilson petit+wilson98 (1998)). See Sect 6.2 for further discussion of the nuclear region.
Additionally, the nuclear and bar region, as well as the south-eastern spiral arm, were observed in CO line emission with high resolution (Handa et al. handa+90 (1990); Lord & Kenney lord+kenney91 (1991); Rand et al. rand+99 (1999); Dumke et al. dumke+05 (2005)). These observations will be discussed in Sections 6.2 and 6.3, respectively.
6 Discussion
6.1 Radial brightness profiles of different tracers of the interstellar medium
The radial extent of different tracers of the neutral, molecular and ionized ISM was compared. Figure 11 shows the profiles for seven tracers: R band (Larsen & Richtler larsen+99 (1999)), MIR (LW2 and LW3), H (Lundgren et al. lundgren+05 (2005)), CO(=1–0) (Lundgren et al. 2004a ), radio continuum (6 cm), and H i (Tilanus & Allen tilanus+allen93 (1993)). The profiles have been calculated from resolution maps, which were corrected for distortion due to the inclination of the galaxy (24∘), by adjusting the distance scale along the minor axis by 1/cos(24).
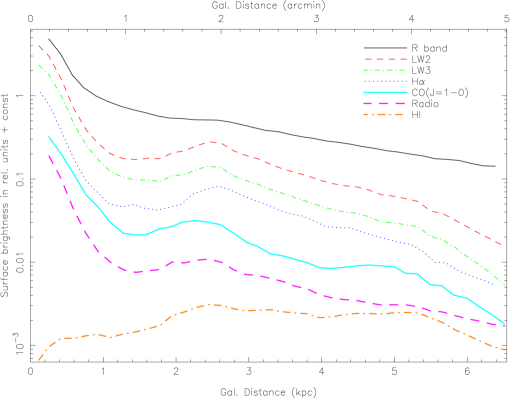
For all profiles, except that of H i, the intensity declines from the central region out to , where most profiles have a local minimum and a corresponding local maximum at . In the radial range – all tracers, except H i, show an exponential decline. The MIR and H profiles seem to be similar, except that the MIR profiles near have more pronounced peaks, and beyond (5 kpc), the MIR profile shows a steeper decline. We find a scale length of ( kpc) for the H and the MIR. The same value was found for the thermal radio continuum emission at 2.8 cm (Ehle et al. ehle+98 (1998)). These authors also found the same scale length () for the hard X-ray emission from the disk for ( kpc).
In the optical wavelength region (here represented by the R band), CO(=1–0) and total radio continuum, the scale lengths are considerably larger: , and , respectively. The fact that H has a smaller scale length than that of the stellar light has previously been noted in M 83 by Larsen & Richtler (larsen+99 (1999)). According to Ryder & Dopita (ryder+94 (1994)), however, the H scale length in galaxies is usually larger that that of the stellar broad-band emission. The explanation for M 83 probably lies in the fact that the central region and the inner spiral arms are undergoing bursts of star formation.
For ( kpc) the decline of the MIR and H emission steepens while that of the R band and radio continuum continues without a break. The scale lengths in the radial region – are , and for LW2, LW3 and H, respectively, while the R band and radio continuum have scale lengths of and , similar to those in the inner disk. The scale length of the CO(=1–0) cannot be determined reliably since this radial range lies partially outside the area which was covered in Lundgren et al. (2004a ). The large scale length in radio continuum is known to exist in many spiral galaxies, e.g. in NGC 6946 (Walsh et al. walsh+02 (2002)), and is an effect of the diffusion of cosmic-ray electrons away from the star-forming regions and the large extent of magnetic fields.
For H i, the decline begins only beyond 5.4 kpc and is in good agreement with the existence of a giant () H i halo for M 83 (Huchtmeier & Bohnenstengel hucht+bohnen81 (1981)).
In the nuclear region all of the tracers except H i reach brightness maxima which are most pronounced in H and the radio. Active star formation can convert H i into molecular and ionized gas. From a comparison of the MIR and radio data, we conclude that we have a higher radio/MIR intensity ratio for the nucleus than for the disk. While a part of this effect may be due to ISOCAM saturation effects, we may also argue for a compression of the magnetic field by the bar shock, enhancing the radio (synchrotron) emission. Alternatively, the coupling between magnetic fields and gas clouds may be more effective in the nuclear region, e.g. due to higher gas temperatures. Such a higher temperature is indicated by increasing CO(=4–3)/CO(=3–2) line ratios in the nuclear region (Petitpas & Wilson petit+wilson98 (1998)).
The steeper decline of the MIR intensity versus the optical or H i brightness in our data is in good agreement with results of Roussel et al. (2001a ) who find the MIR disks in spiral galaxies are smaller than the optical or H i disks. We further confirmed this trend with the help of the MIR strip observations which cover , versus the field of the LW2/LW3 observations. Therefore, our findings cannot be explained in terms of difficulties of the background estimation in case of the LW2 and LW3 maps which almost completely cover the optical extent of M 83 ().
6.2 The nuclear and bar region
To further understand the nature of the nuclear MIR and radio emission, we zoom into the central 2’x2’ region () of M 83 and investigate their relationship with various ISM tracers, such as H, H i, CO(=1–0), CO(=2–1) and CO(=3–2) (Fig. 12). We have also sketched in Fig. 12f the NIR emission features (Adamson et al. adamson+87 (1987); Gallais et al. gallais+91 (1991) Sofue & Wakamatsu sofue+94 (1994); Elmegreen et al. elmegreen+98 (1998); Thatte et al. thatte+00 (2000)), namely the starburst shells, the double nucleus and the mini-bar.
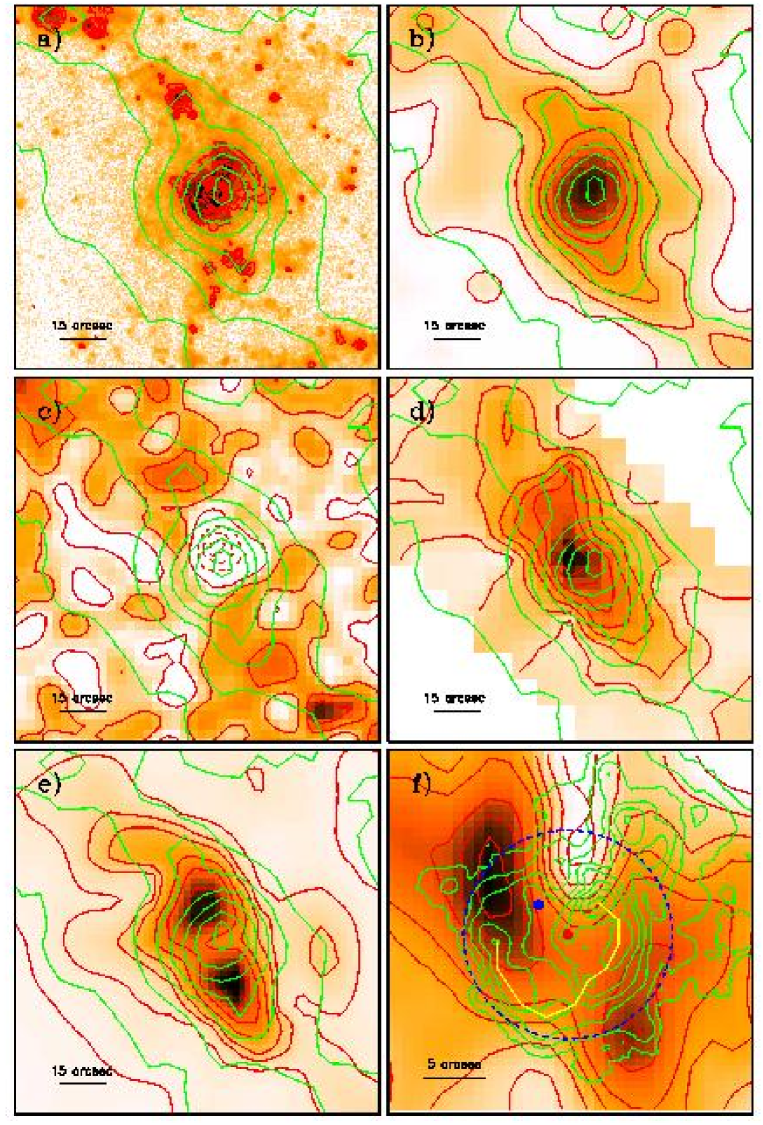
From the H morphology (Fig. 12a), it is clear that the bulge region is not a point source, but shows two “bubble-like” structures opening out to the north-west and south-east of the nucleus. While the MIR image cannot resolve the nuclear emission region due to its lower angular resolution, there is good coincidence of MIR and H emission on a larger scale toward the central region. Both tracers peak at the nucleus of the galaxy. Bright H maxima at the position angle of and at distances from the nucleus of (650 pc) and , respectively, show that the optical bar alignment and star formation activity along and at the ends of the bar are traced by “tongues” of the LW2 contours. The LW2 contours also outline the compact H regions at the position angle of and (distances of and , respectively).
Fig. 12b displays the 6 cm radio continuum image and red contours and the LW2 contours in green. The MIR observations and the radio observations do not provide sufficient angular resolution to detect a possible correlation with the NIR emission components (sketched in Fig. 12f). The nucleus itself is not resolved in either image, but“tongue-like” structures of the contours from the nucleus following the bar to the south and north are visible in both bands.
A correspondence of the H i void in the nuclear area (dashed red contours) and the MIR emission peak is shown in Fig. 12c. The tongue-like LW2 emission features (green contours) south-west and north-east of the nucleus coincide with local H i maxima.
Our Fig. 12d shows the CO(=1–0) image and red contours (Handa et al. handa+90 (1990)) in comparison with LW2 contours (green). Both tracers peak on the nucleus of the galaxy. The CO(=1–0) contours do not show the “bottleneck” structure at (650 pc) NE and SW of the nucleus. If real, and not an effect due to the large spacing () of the CO map, this might further indicate that we indeed trace different components: the molecular gas along the bar and the MIR PAH emission along the optical spiral arms and leading edge of the bar.
As shown in our overlay of the MIR contours (resolution ) on the CO(=2–1, resolution ) data (Fig. 12e), we can exclude the presence of a double-peaked MIR structure separated by (430 pc) as detected in the CO(=2–1) (Lundgren et al. 2004a ) and CO(=3–2) (Petitpas & Wilson petit+wilson98 (1998)) data. The MIR peak appears to lie in the middle of the CO peaks. Similar to the CO(=2–1), the contours of the LW2 emission are located at the leading edge of the bar, which argues for the presence of dust lanes along the leading edges of the bar. Recent CO(=3–2) data from the Heinrich Hertz Telescope (HHT) (Dumke et al. dumke+05 (2005)) also show this. These results confirm the conclusion of Elmegreen et al. (elmegreen+98 (1998)) who have demonstrated this point using J-K color images.
To obtain further insight on the nature of the nuclear emission beyond the resolution of the MIR and radio continuum data, we overlaid the H contours on the CO(=3–2) image (Fig. 12f), zooming in further. In this figure we sketched the two near-infrared nuclei (blue and red dots), the star forming arc (yellow) as well as the near infrared ring (blue-dashed ring) seen in the J-K images (Elmegreen et al. elmegreen+98 (1998)). The brightest H emission peak is close to the bright near-infrared peak of the galaxy (blue dot). Both H emission peaks lie on the ring seen in the J-K images, while the center of symmetry of the K-band emission lies at the center of the image (red dot; Thatte et al. thatte+00 (2000)), between the two H emission peaks. Optical spectroscopy of these metal-rich H ii regions is given in Bresolin & Kennicutt (bresolin+kennicutt02 (2002)). For the emission peak at the position of the north-eastern nucleus, a Wolf-Rayet bump is detected and the age of the H ii region is approximately 5 Myr.
Two bubble-like structures of ionized gas are visible to the NW and SE, both oriented nearly perpendicular to the major axis and bar of M 83. These structures are embedded in large-scale, diffuse H emission with an extent of (). While star-forming regions of different intensities or a double or multiple nucleus can, in principle, explain the morphology of the H emission peaks, one might be tempted to speculate about the detection of an inflow- or outflow/superwind-like H morphology in the central region of the galaxy as known to exist for other galaxies with nuclear starburst activities (e.g. Bland & Tully bland+tully88 (1988); Lehnert et al. lehnert+99 (1999) for M 82, or Schulz & Wegner schulz+wegner92 (1992) for NGC 253). Dense gas and dust present in spiral arms, compressed by spiral density waves can also affect the morphology of the H emission.
The nuclear region of M 83 could clearly be resolved with the advent of Chandra observations (Soria & Wu soria+wu02 (2002)). A highly structured composition of 15 discrete sources and unresolved clump-like features due to faint sources or hot gas clouds was discovered. The nuclear X-ray emission is strongest inside the outer dust ring (Elmegreen et al. elmegreen+98 (1998)) and contains both the IR photometric nucleus (consistent with the second brightest Chandra-detected nuclear X-ray source) and the star-forming arc (in the south). While the optical emission is more strongly concentrated around the IR nucleus and along the star-forming arc, the X-ray emission is more uniformly distributed and extends to larger galactocentric radii: to the south-west along the main galactic bar and also towards the north-west across a dust lane (part of the outer circumnuclear ring) and in the direction perpendicular to the bar. X-ray emission, uncorrelated with any bright (star-forming) optical regions, was also found to the east of the IR photometric nucleus and might originate from remnants of stellar evolution. The X-ray spectrum of the unresolved nuclear X-ray emission suggests that the ISM has been enriched by the ejecta of Type II supernovae and stellar winds (see also Soria & Wu soria+wu02 (2002)).
6.3 The south-eastern spiral arm
The south-eastern spiral arm of M 83 was studied in detail at several wavelengths. The atomic and ionized hydrogen in this arm region was observed by Tilanus & Allen (tilanus+allen93 (1993)). Deutsch & Allen (deutsch+allen93 (1993)) focused on the non-thermal radio emission and H emission. CO(=1–0) observations were carried out by Lord & Kenney (lord+kenney91 (1991)) and Rand et al. (rand+99 (1999)). Rand et al. (rand+99 (1999)) stress, as indicated already by the observations of Lord & Kenney (lord+kenney91 (1991)), that the CO emission of the arm was found to be aligned with a dust lane delineating the inner edge of the spiral arm, but beyond a certain point along the arm the emission shifts downstream from the dust lane. While the CO emission at least partially covers the dust lane, the H i emission along the arm is offset from the dust lane to the east by up to 700 pc. Tilanus & Allen (tilanus+allen93 (1993)) propose a diffuse shock or dissociation scenario to explain the H i findings. Rand et al. (rand+99 (1999)) discuss heating of the CO gas by UV radiation from young stars, heating by low energy cosmic rays or an interstellar medium of different density components,in order to explain the offset of the CO emission from the dust lane.
In our Figs. 13a–d, we present the contours of the CO map as shown by Rand et al. (rand+99 (1999)) in their Fig. 2 overlaid on the LW2, H i, radio continuum and VLT/FORS1 B band (ESO archive) images. The LW2, H i and radio data were rebinned to a pixel size of for the comparison with the CO(=1–0) contours. The CO emission lies along a sharp dust lane visible in blue images of M 83 in most of the region displayed, but near a certain point the emission falls below the detection limit, and this point is marked by an arrow in Fig. 13b. It is worth mentioning that the non-detection of CO emission coincides with a local maximum in the H i emission, corresponding to a column density of at the resolution of the H i map or an average density above for an integration radius of . We detect neither an enhancement in MIR nor in radio continuum emission at this location. Further to the south, the CO emission bifurcates, with a local maximum to the west. The emission is aligned with a dust lane and an elongated emission feature following the arm structure as highlighted by the highest MIR and radio intensities. This alignment might argue for enhanced star formation and cosmic ray densities (Rand et al. rand+99 (1999)) or strong magnetic fields along the CO filament extending from the local H i maximum marked in Fig. 13b to the south.
However, the OVRO CO(=1–0) data is not a reliable source to trace the bulk of molecular gas since it only reveals 2–5% of the total CO(=1–0) emission in this region (see Rand et al. rand+99 (1999)). It is likely that the emission that was detected has its origin in clouds that are heated or compressed by star formation and/or shocks, instead of tracing the cool molecular gas. As an example, the OVRO data traces the leading edge of the molecular bar, and not the bar itself (see Fig.5 in Lundgren et al. 2004a ). Furthermore, we should keep in mind that this may also affect the comparison with the H i data, where 55% of the total H i emission within the Holmberg radius was detected (Tilanus & Allen tilanus+allen93 (1993)).
7 Correlations between different tracers of the interstellar medium
7.1 The method
The correlations are determined using an algorithm that plots corresponding values with linear or logarithmic axes (Nieten nieten01 (2001)), using different gridding and weighting schemes. The results presented here were obtained with a weighting, where is the rms noise in each image. Only intensities with amplitudes above 5 were used in order to avoid any influence of instrumental noise. Only spatially independent points are selected. Selecting pixels separated by 2.0 beam widths, at which point the Gaussian telescope beam overlaps by only 2%, is a good compromise between independence and maximal data usage. Four different hexagonal grids were used for each correlation to assess the effect of gridding on the resulting correlations, and their mean value was adopted. The difference in the correlation coefficient for slightly offset hexagonal grids is typically a few percent.
We used the MIR, H i, CO, H and 6 cm radio continuum maps for this correlation study. The radio intensity was separated into its thermal and non-thermal components with help of a spectral index map between 20 cm (Sukumar & Allen sukumar+allen89 (1989)) and 6 cm, assuming constant spectral indices for the thermal (=0.1) and non-thermal (=1.0) components, as in Neininger et al. (neininger+93 (1993)). The optical images, broad-band R and narrow-band H, are from Larsen & Richtler (larsen+99 (1999)) and Lundgren et al. (lundgren+05 (2005)). All images were smoothed to a common resolution of (500 pc). The nuclear region was screened with a diameter of , since we expect the nuclear area to behave differently from the outer bulge, spiral arm and interarm regions. We assume a relationship between the intensities and at two wavelengths of the form:
| (1) |
The exponents, with the associated errors, as well as the Pearson’s correlation coefficients and Student-t values, are given in Table 5. Representative plots are presented in Fig. 14.
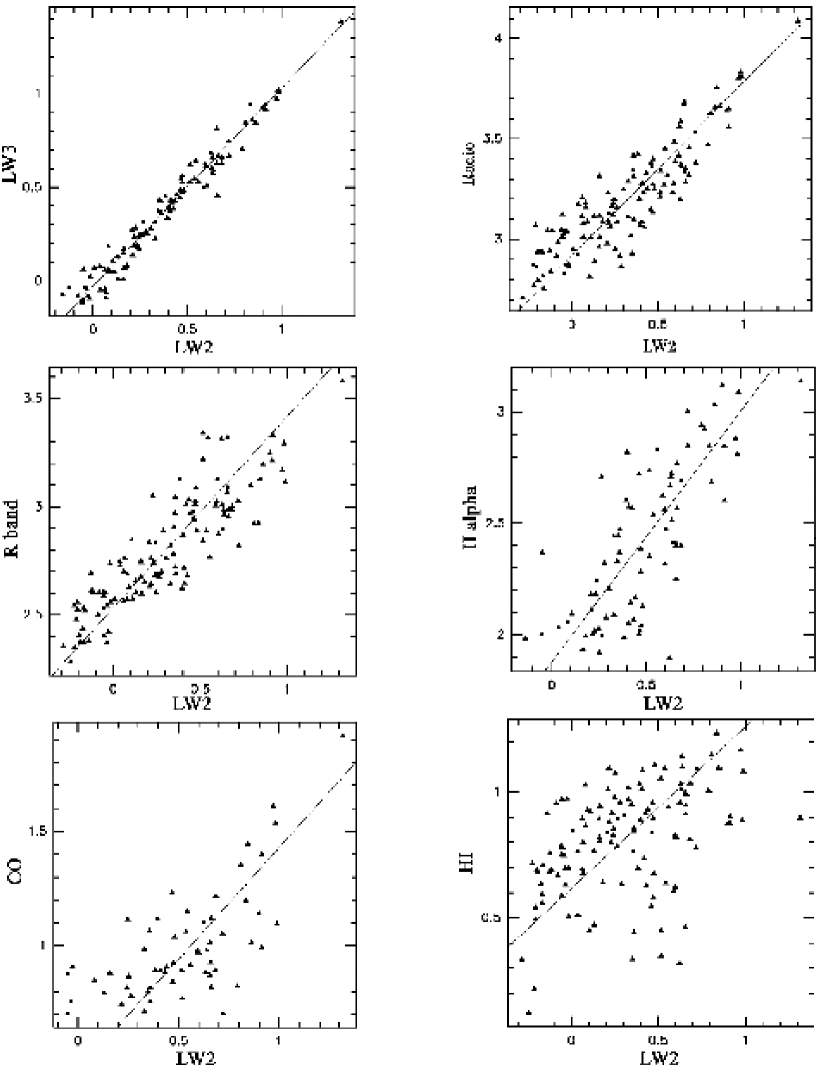
|
The correlation between LW2 and LW3 is extremely good; the ratio LW2/LW3 shows little variation within the disk (see Sect. 7.2 and the radial profiles in Fig 11). The correlations of LW2 and LW3 with the radio continuum and with the R band are likewise good, with a Pearson’s correlation coefficient of , closely followed by that of H, having correlation coefficients of 0.80 to 0.84. The total radio continuum emission is better correlated with the MIR emission than with each of the individual thermal and non-thermal radio components. The CO emission does not follow the MIR emission well (correlation coefficent of 0.7). The H and the radio thermal emission are not well correlated, probably an effect due to optical extinction. The H and the R band are also not well-correlated which is evident in Fig 11.
H i shows no significant correlation with any other tracer. All these results agree with those found in NGC 6946 (Frick et al. frick+01 (2001); Walsh et al. walsh+02 (2002)).
We also studied correlations between the images available at (260 pc) resolution which gave very similar results. For example, the correlation coefficient of the LW2–LW3 correlation was 0.95 and that of the LW3–radio continuum correlation was 0.84.
7.2 The mid-infrared LW2 (6.75 m) – LW3 (15.0 m) correlation
Figures 1 and 14 (top left panel) show an excellent correlation between the two MIR broad-band filters. The correlation coefficient is close to one () and the exponent , arguing for a nearly linear relationship. In NGC 6946 (Walsh et al. walsh+02 (2002)), the correlation coefficient and the exponent are almost identical to those in M 83. The LW2/LW3 ratios (Table 3) vary within M 83 from 0.6 to 1.75. Since we screened the nuclear and inner bulge region and required a signal-to-noise ratio , thus excluding a part of the interarm regions, we apparently pick up ratios of 1.1 for the outer bulge and 0.8 for a region on the spiral arm (with errors of ).
The overall LW2/LW3 ratio is regarded to be typical for spiral galaxies without active nuclei (Roussel et al. 2001a , 2001b ; see Sect. 3.5). Applying our findings to the case of spatially unresolved galaxies, LW2/LW3 ratios for the total galaxy do not exclude the existence of bursts of star formation in particular regions like the nucleus or the inner spiral arms, where LW2/LW3 (see also Roussel et al. 2001c ).
7.3 The mid-infrared – radio correlation
The correlation between the integrated radio continuum and far-infrared (FIR) fluxes of galaxies is one of the closest in astrophysics and has been discussed over many years (e.g. Helou & Bicay helou+bicay93 (1993); Niklas & Beck niklas+beck97 (1997); Hoernes et al. hoernes+98 (1998)). The mid-infrared – radio correlation within M 83 is also very tight (Figs. 1, 7, 14). The correlation coefficients between the LW2 and LW3 MIR bands and the radio intensity are and , respectively (Table 5). The slopes of and are similar to that of the far-infrared – radio correlation (Niklas & Beck niklas+beck97 (1997); Hoernes et al. hoernes+98 (1998)) and indicate that the same physical process is involved. The warm dust consists of PAHs and grains of different sizes, emitting in the mid- and far-infrared. Neither the individual thermal nor non-thermal radio components are better correlated with MIR than the total radio emission. The MIR emission, similar to the FIR emission, probably consists of two components, a diffuse one (like that of the non-thermal radio emission) and a clumpy one concentrated around star-forming regions (like that of the thermal radio emission).
The explanation of the correlation may be threefold:
a) thermal emission,
b) cosmic-ray production in star-formation regions,
c) magnetic fields.
a) If the radio continuum intensity in M 83 is dominated by free-free thermal emission, the correlation could be caused by the action of star formation which heats the dust and ionizes the gas. However, thermal radio emission originates in the ionized gas phase, a phase which primarily provides the dust continuum component of the LW3 emission and is also responsible for the excitation of the surrounding PAHs dominating the LW2 emission. Furthermore, our separation of thermal and non-thermal radio emission of M 83, with the help of the spectral index, reveals a dominance of non-thermal emission at all radii. Thermal emission may dominate locally in star-forming regions, but non-thermal processes are essential in order to understand the correlation.
b) Star-forming regions are locations of type II, Ib and Ic supernovae, and the shock fronts of their remnants are probably cosmic-ray accelerators. If the magnetic field strength were constant, the radio continuum image would reflect the distribution of cosmic-ray electrons originating in star-forming regions. The diffusion speed of cosmic rays is limited to the Alfvén velocity ( km/s in the hot interstellar medium) so that the particles propagate within their lifetime of y. Under the given assumptions the radio continuum map should look like a smoothed image of the star-forming regions (H), which indeed is the case. Similarly, the MIR image traces the dust in and around the star-forming regions. A detailed analysis of this correlation “scale by scale” with help of wavelets is underway (Beck et al. beck+05 (2005)).
c) However, a constant magnetic field strength in the disk of M 83 is physically unreasonable. Even small variations in field strength lead to strong fluctuations in synchrotron intensity (see Sect. 4). In this case any correlation with radio continuum emission needs to consider magnetic fields.
The lack of large-scale correlations of radio continuum with neutral H i gas or with hot X-ray emitting gas from the disk (Ehle et al. ehle+98 (1998)) indicates that the warm neutral gas as well as the hot ionized gas components are of little importance for the distribution of magnetic fields.
We propose that the interstellar magnetic fields are connected to the gas clouds in which the dust is embedded and they are probably anchored in their photoionized shells. This provides a relation between the number density of gas clouds and field strength of . A similar relation is obtained through equipartition between the energy densities of turbulent cloud motion and magnetic fields, as e.g. observed in NGC 6946 (Beck beck04 (2004)). The physical mechanism and time scale of this coupling has to be investigated.
Our result also bears important consequences for the generation and dynamics of magnetic fields. If the fields are anchored in gas clouds, turbulent motions of gas clouds may cause the “–effect” necessary for dynamo action (Beck et al. beck+96 (1996)).
Elbaz et al. (elbaz+02 (2002)) have demonstrated the existence of the global MIR-radio correlation for galaxies up to z=1, while Appleton et al. (appleton+04 (2004)) have found this correlation to remain out to z=2. Thus, globally for galaxies in the local universe and within individual galaxies, as we see here, as well as for cosmologically significant galaxies, this correlation remains a fundamentally important physical process.
7.4 Comparison between mid-infrared and H
In our Galaxy, the PAH emission seems to be closely associated with photodissociation shells and the surfaces of molecular clouds in the vicinity of H ii regions or exciting hot stars, while the VSG continuum peaks inside H ii regions (Siebenmorgen & Krügel sieben+krugel92 (1992); Cesarsky et al. cesarsky+96b (1996); Verstraete et al. verstraete+96 (1996)). Both regions are linked to star formation, which is also traced by H emission. From this, we would expect a correlation between the MIR and H emission (smoothed to the same resolution). For M 83 we find a correlation coefficient of and (Table 5). According to Fig. 8, the MIR emission is more diffuse than H which is clumpy and concentrated toward the youngest star-forming regions. This also explains the tight correlation between the MIR and optical R band emissions.
While the radial profiles of H and the LW2 and LW3 appear to follow a similar pattern, there are significant relative spatial differences near 2, where the peak is more pronounced in H than in the MIR. Differences are also apparent in the outer disk region, r 4’ (Fig. 11). These effects result in a slope of the regression exponent being 1.3 (Fig. 14). This exponent predicts, in principle, the detection of decreasing MIR emission with respect to the H emission in the case of increasing radiation fields. Given the large scatter of the individual values, this result should be taken with care.
Roussel et al. (2001b ) report on the relationship between star-formation rates and mid-infrared emission in galactic disks for a sample of 69 galaxies. Excluding the nuclear regions, they find, within their errors, a linear relationship between the total MIR and H emission in disks. The question arises whether, on a much larger scale than the investigated one (), the MIR and H emission correlate linearly. To check this, we made pixel by pixel comparisons, requiring the same signal to noise ratio, with artificially-reduced resolution. Reducing the resolution by a factor of 2, 4 or 8 still leads to a large scatter. With a resolution of we find good correlations between any tracers except H i (correlation coefficients of , but Student-t values of only ). This reflects the obvious fact that an extended disk exists in most spectral ranges (see Fig. 1). Thus correlation analysis of low-resolution data can be misleading. A scale separation is required, as demonstrated for NGC 6946 by Frick et al. (frick+01 (2001)).
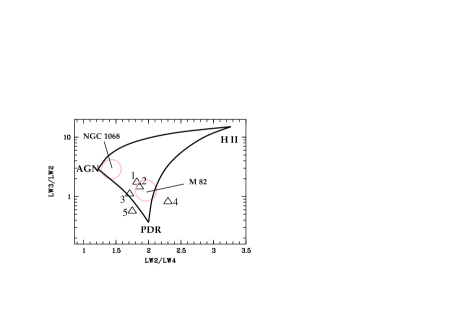
7.5 Classification of M 83 as a starburst galaxy with the help of its MIR colours
We calculated the LW3/LW2 and LW2/LW4 ratios for the five regions presented in Sect. 3.2 and Fig. 3. The ratios are plotted in Fig. 15. The ratios can be used to build a classification diagram (Laurent et al. laurent+00 (2000)), in which the MIR emission from AGNs, photo-dissociation regions (PDR) and H ii regions are separated. The expectations for pure AGN, PDR and H ii regions and the results of Laurent et al. (laurent+00 (2000)) for the AGN-dominated galaxy NGC 1068 and the starburst dominated galaxy M 82 are indicated. Our measurements for the nucleus, bulge and inner disk of M 83 are in the vicinity of the M 82 measurements arguing for a high rate of star formation in these regions. The regions 4 and 5 are slightly offset, which suggests a different physical state. One should, however, keep in mind that the ratios for the faint regions 4 and 5 are affected by larger errors ().
8 Summary
M 83 was observed with the ISOCAM in the 4 m to 18 m band.
-
•
The LW2 and LW3 broad-band filter observations covered the entire optical extent ( at Mpc assumed distance) of the galaxy. Both filters show bright emission from the nuclear and bulge regions, star-formation regions at the tips of the bar and the inner spiral arms. Emission from the outer spiral arms and interarm regions is discernible with low intensity only. For LW2 (5 m to 8.50 m) and LW3 (12 m to 18 m), we measure an integral flux for M 83 of 20 Jy () and 21 Jy (), respectively. The central () region contributes and to the total mid-infrared emission in the case of LW2 and LW3, respectively.
-
•
Strip maps, centered on the nucleus of M 83, were taken in seven narrow-band filters with scan directions from the north-east to the south-west. The (14.0 m–16.0 m)/(7.0 m–8.5 m) ratio is found to be a good tracer of star-formation regions in the galaxy.
-
•
The central () region of M 83 was also observed in the spectral imaging mode. This allowed us to extract 4 m to 18 m spectra for 5 different regions: the center, the inner and outer bulge, a mid-infrared emitting on-arm region close to the south-western tip of the bar, as well as an averaged interarm region spectrum. PAH bands are identified in all regions at 6.2 m, 7.7 m, 8.6 m and 11.3 m, as well as a blended [Neii] and PAH feature at 12.8 m.
-
•
Summed over the total ISOCAM MIR wavelength range of 4 to 18 m, the PAHs dominate in energy over the small grain continuum emission. While dust continuum contributions make up 40% of the total flux in the central region, they become almost negligible in the interarm regions (). The contribution of atomic lines are small in general, the brightest line being the [Neii] line towards the center. The ratio LW2/LW3 varies from 0.6 (nucleus) to 1.8 (interarm regions).
-
•
From our spectral imaging mode, we tested the PAH versus continuum distribution for the broad-band filters LW2 and LW3. A great number of galaxies have only been observed in these filter bands which were thought to trace mainly the PAHs (LW2) and dust continuum (LW3). For LW2 we find that PAH features indeed dominate the emission in the case of all regions. For the LW3 band, the continuum emission dominates in the case of the nucleus, bulge and spiral arms. For interarm or more diffuse regions, however, PAH features are found to be the main source of the LW3 emission.
New radio continuum (a combined 6 cm VLA/Effelsberg map) and H data, which were used herein for a detailed quantitative analysis, are presented. Both wavelengths show similar morphological features as the mid-infrared emission does. Further tracers of the interstellar medium, CO(=1–0), H i, diffuse X-rays, as well as R band were compared to the mid-infrared images.
-
•
The radial profiles of the MIR, H, hard X-ray and thermal radio continuum intensities in the range – have the same scale length of ( kpc) and steepen beyond 5 kpc radius. The radial declines of the total radio continuum, CO and broad-band optical emission are significantly flatter (scale lengths –).
-
•
The morphology of the radio continuum and, to a large degree, H resembles that of the mid-infrared. Correlation studies between both two mid-infrared broad-bands and the radio continuum intensities at resolution show a nearly linear dependence () with a correlation coefficient of . In the case of H we obtain with a correlation coefficient of .
-
•
The close relationship between mid-infrared and 6 cm radio continuum is discussed in the framework of different scenarios. A possible implication of our findings is that the interstellar magnetic fields are anchored in the photoionized shells of gas clouds. This result would have important consequences for the generation and dynamics of magnetic fields, e.g., the “–effect” necessary for dynamo action may be driven by turbulent motions of gas clouds.
Acknowledgements.
We wish to thank N. Neininger for help with the radio observations, Ch. Nieten for providing and explaining his correlation software, and T. Handa, G. Petitpas, R. Rand and R. Tilanus for kindly providing their CO(=1–0), CO(=4–3), CO(=1–0, S arm) and H i images. We thank H. Roussel who provided the preanalyzed ISOCAM CVF data cube. We thank E. Krügel for his insightful reading of the paper. We appreciate the careful reading of the manuscript by our referee and comments that helped improve the clarity of the presentation. Part of the MIR analysis was carried out with non-standard CIA software written by P. Chanial, H. Roussel and D. Reynaud. O. Laurent provided the source codes for the spectral analysis of the CVF data. Our work made use of the archival data base at the European Southern Observatory (ESO) and the NASA Extragalactic Database (NED).References
- (1) Adamson, A. J., Adams, D. J., & Warwick, R. S. 1987, MNRAS, 224, 367
- (2) Allamandola, L. J., Tielens, A. G. G. M., & Barker, J. R. 1989, ApJS, 71, 733
- (3) Allamandola, L. J., Hudgins, D. M., & Sandford, S. A. 1999, ApJ, 511, L115
- (4) Appleton, P. N., Fadda, D., Marleau, F.R. et al. 2004, ApJ, 154, 147
- (5) Arendt, R. G., Dwek, E., & Mosley, S. H. 1999, ApJ, 521, 234
- (6) Athanassoula, E. 1992, MNRAS, 259, 345
- (7) Athey, A., Bregman, J., Bregman, J., Temi, P., & Sauvage, M. 2002, ApJ, 571, 272
- (8) Beck, R. 2002, in: Disks of Galaxies: Kinematics, Dynamics and Pertubations, ed. E. Athanassoula et al., ASP Conf. Ser. 275, 331
- (9) Beck, R. 2004, in: How Does the Galaxy Work?, eds. E. J. Alfaro et al., (Dordrecht: Kluwer), 277
- (10) Beck, R., & Hoernes, P. 1996, Nat, 379, 47
- (11) Beck, R., Brandenburg, A., Moss, D., Shukurov, A., & Sokoloff, D. 1996, ARAA, 34, 155
- (12) Beck, R., Ehle, M., Shoutenkov, V., Shukurov, A., & Sokoloff, D. 1999, Nat, 397, 324
- (13) Beck, R., Ehle, M., Frick, P., et al. 2005, in prep.
- (14) Bland, J., & Tully, B. 1988, Nat, 334, 43
- (15) Boselli, A., Gavazzi, G., & Sanvito, G. 2003, A&A, 402, 37
- (16) Boulanger, F., Boissel, P., Cesarsky, D., & Ryter, C. 1998, A&A, 339, 194
- (17) Bresolin, F., & Kennicutt, R. C. 2002, ApJ, 572, 838
- (18) Cesarsky, C. J., Abergel, A., Agnese, P., Altieri, B., & Augueres, J.L. 1996a, A&A, 315, 32
- (19) Cesarsky, D., Lequeux, J., Abergel, A., Perault, M., Palazzi, E., Madden, S., & Tran, D. 1996b, A&A, 315, L309
- (20) Chan, K.-W., Roellig, T. L., Onaka, T., et al. 2001, ApJ, 546, 273
- (21) Chanial, P., & Gastaud, R. 2000 (software available on email request via cir@discovery.saclay.cea.fr)
- (22) Coulais, A., & Abergel, A. 2000, A&AS, 141, 533
- (23) Crosthwaite, L. P., Turner, J. L., Buchholz, L., et al. 2002, AJ, 123, 1892
- (24) Dale, D. A., Silbermann, N. A., Helou, G., et al. 2000, AJ, 120, 583
- (25) Désert, F.-X., Boulanger, F., & Puget, J. L. 1990, A&A, 237, 215
- (26) Deutsch, E. W., & Allen, R. J. 1993, AJ, 106, 1812
- (27) Dickey J. M., & Lockman F. J., 1990, ARA&A, 28, 215
- (28) Dumke, M., Thuma, G., Walsh, W., et al. 2005, A&A, in prep.
- (29) Ehle, M., Pietsch, W., Beck, R., & Klein, U. 1998, A&A, 329, 39
- (30) Elbaz, D., Cesarsky, C. J., Chanial, P., et al. 2002, A&A, 384, 848
- (31) Elmegreen, D. M., Chromey, F. R., & Warren, A. R. 1998, AJ, 116, 2834
- (32) Förster-Schreiber, N. M., Sauvage, M., Charmandaris, V., et al. 2003, A&A, 399, 833
- (33) Frick, P., Beck, R., Berkhuijsen, E. M., & Patrickeyev, I. 2001, MNRAS, 327, 1145
- (34) Gallais, P., Rouan, D., Lacombe, F., Tiphéne, D., & Vauglin, I. 1991, A&A, 243, 309
- (35) Galliano, F. 2004, PhD dissertation, University of Paris
- (36) Genzel, R., Lutz, D., Sturm, E., et al. 1998, ApJ, 498, 579
- (37) Genzel, R., & Cesarsky, C. J. 2000, ARA&A, 38, 761
- (38) Handa, T., Nakai, N., Sofue, Y., Hayashi, M., & Fujimoto, M. 1990, PASJ, 42, 1
- (39) Handa, T., Ishizuki, S., & Kawabe, R. 1994, in: Astronomy with Millimeter and Submillimeter Wave Interferometry, ASP Conf. Ser., 59, 341
- (40) Helou, G., & Bicay, M. D. 1993, ApJ, 415, 93
- (41) Helou, G., Malhotra, S., Beichman, C., et al. 1996, A&A, 315, L157
- (42) Henning, T., Klein, R., Launhardt, R., Lemke, D. & Pfau, W. 1998, A&A, 332, 1035
- (43) Hoernes, P., Berkhuijsen, E. M., & Xu, C. 1998, A&A, 334, 57
- (44) Huchtmeier, W. K., & Bohnenstengel, H.-D. 1981, A&A, 100, 72
- (45) Hunt, L.K., Giovanardi, C. & Helou G. 2002, A&A, 394, 873
- (46) Immler, S., Vogler, A., Ehle, M., & Pietsch, W. 1999, A&A, 352, 415
- (47) Jourdain de Muizon, M., d’Hendecourt, L.B. & Geballe, T. R. 1990, A&A, 227, 526
- (48) Kessler, M., Steintz, J., Anderegg, M., et al. 1996, A&A, 315, L27
- (49) Krügel, E. 2003. The Physics of Interstellar Dust, (Bristol: Institute of Physics Publishing), 271
- (50) Lagage P. O., Claret, A., Ballet, J., et al. 1996, A&A, 315, L273
- (51) Larsen, S. S., & Richtler, T. 1999, A&A, 345, 59
- (52) Laurent, O., Mirabel, I. F., Charmandaris, V., et al. 2000, A&A, 359, 887
- (53) Leech, K. J., Metcalfe, L., & Altiere, B. 2001, MNRAS, 328, 1125
- (54) Lehnert, M. D., Heckman, T. M., & Weaver, K. A. 1999, ApJ, 523, 575
- (55) Lemke, D., Mattila, K., & Lehtinen, K. 1998, A&A, 331, 742
- (56) Lord, S. D., & Kenney, J. D. P. 1991, ApJ, 381, 130
- (57) Lundgren, A. A., Wiklind, T., Olofsson, H., & Rydbeck, G. 2004a, A&A, 413, 505
- (58) Lundgren, A. A., Wiklind, T., Olofsson, H., & Rydbeck, G. 2004b, A&A, 422, 865
- (59) Lundgren, A. A., Olofsson, H. & Wiklind, T., 2005, submitted to A&A,
- (60) Lutz, D., Sturm, E., Genzel, R., Spoon, H. W. W., Moorwood, A. F. M., Netzer, H., & Sternberg, A. 2003, A&A, 409, 867
- (61) Madden, S. C., Galliano, F., Jones. A. & Sauvage, M. 2005, submitted to A&A
- (62) Mattila, K., Lemke, D., Haikala, L.K., et al. 1996, A&A, 315, L353
- (63) Neininger, N., Klein, U., Beck, R., & Wielebinski, R. 1991, Nat, 352, 781
- (64) Neininger, N., Beck, R., Sukumar, S., & Allen, R. J. 1993, A&A, 274, 687
- (65) Nieten, C. 2001, PhD Thesis, University of Bonn
- (66) Niklas, S., & Beck, R. 1997, A&A, 320, 54
- (67) Ohashi, T., Makishima, K., Tsuru, T., et al. 1990, ApJ, 365, 180
- (68) Okada, K., Mitsuda, K., & Dotani, T. 1997, PASJ, 49, 653
- (69) Petitpas, G. R., & Wilson, C. D. 1998, ApJ, 503, 219
- (70) Puget, J. L., & Leger, A. 1984, A&A, 137, L5
- (71) Rand, R. J., Lord, S. D., & Higdon, J. L. 1999, ApJ, 513, 720
- (72) Rigopoulou, D., Kunze, D., Lutz, D., Genzel, R., & Moorwood, A. F. M. 2002, A&A, 389, 374
- (73) Roussel, H., Sauvage, M., Bosma A., et al. 2001a, A&A, 369, 473
- (74) Roussel, H., Sauvage, M., Vigroux, L., et al. 2001b, A&A, 372, 406
- (75) Roussel, H., Sauvage, M., Vigroux, L., et al. 2001c, A&A, 372, 427
- (76) Ryder, S. D., Hungerford, A., Dopita, M. A., et al. 1995, in: The Opacity of Spiral Disks, ed. J. I. Davies & D. Burstein (Dordrecht: Kluwer), 359
- (77) Ryder, S.D., Dopita, M. A. 1994, ApJ, 430, 142
- (78) Sakamoto, K., Matsushita, S., Peck, A.B., Wiedner, M. C., Iono, D. 2004, ApJ, 616, L59
- (79) Schlegel, D. J., Finkbeiner, D. P., & Davis, M. 1998, ApJ, 500, 525
- (80) Schulz, H., & Wegner, G. 1992, A&A, 266, 167
- (81) Schutte, W. A., Tielens, A. G. G. M., & Allamandola, L. J. 1993, ApJ, 415, 397
- (82) Sellgren, K., Luan, L., & Werner, M. W. 1990, ApJ, 359, 384
- (83) Siebenmorgen, R., & Krügel, E. 1992, A&A, 259, 614
- (84) Sofue Y., & Wakamatsu T. 1994, AJ, 107, 1018
- (85) Soria, R., & Wu, K. 2002, A&A, 384, 99
- (86) Soria, R., & Wu, K. 2003, A&A, 410, 53
- (87) Sturm, E., Lutz, D., Tran, D., et al. 2000, A&A, 358, 481
- (88) Sturm, E., Lutz, D., Verma, A., et al. 2002, A&A, 393, 821
- (89) Sukumar, S., & Allen, R. J. 1989, Nat, 340, 537
- (90) Thatte, N., Tecza, M., & Genzel, R. 2000, A&A, 364, L47
- (91) Thim, F., Tammann, G. A., Saha, A., et al. 2003, ApJ, 590, 256
- (92) Tilanus, R. P. J., & Allen, R. J. 1993, A&A, 274, 707
- (93) Trinchieri, G., Fabbiano, G., & Palumbo, G. G. C. 1985, ApJ, 290, 96
- (94) Uchida, K. I., Sellgren, K., Werner, M. W., & Houdashelt, M. L. 2000, ApJ, 530, 817
- (95) Verma, A., Lutz, D., Sturm, E., et al. 2003, A&A, 403, 829
- (96) Vermeij, R., Peeters, E., Tielens, A. G. G. M., & van der Hulst, J.M. 2002, A&A, 382, 1042
- (97) Verstraete, L., Puget, J. L., Falgarone, E., et al. 1996, A&A, 315, L337
- (98) Verstraete, L., Pech, C., Moutou, C., et al. 2001, A&A, 372, 981
- (99) Vigroux, L., Charmandaris, V., Gallais, P., et al. 1999, in: The Universe as Seen by ISO, ed. P. Cox & M. F. Kessler, ESA-SP 427, 805
- (100) Walsh, W., Beck, R., Thuma, G., et al. 2002, A&A, 388, 7
- (101) Xilouris, E. M., Madden, S. C., Galliano, F., Vigroux, L., & Sauvage, M. 2004, A&A, 416, 41