Spitzer Observations Of The Supergiant Shell Region In IC 2574
Abstract
We present spatially resolved Spitzer imaging of the supergiant shell region of the M81 group dwarf galaxy IC 2574 obtained as part of the Spitzer Infrared Nearby Galaxies Survey. This region harbors one of the best nearby examples of a kinematically distinct H i shell, with an associated remnant stellar cluster; the shell is initiating sequential star formation as it interacts with the surrounding interstellar medium. This region dominates the infrared luminosity of IC 2574 and is spatially resolved in all Spitzer imaging bands. We study the differences in dust temperature as a function of local environment and compare local star formation rates as inferred from H and total infrared luminosities. We find that the strong H sources are associated with regions of warm dust; however, the most luminous infrared and H sources are not necessarily co-spatial. The coolest dust is found in the regions farthest from the rim of the shell; these regions show the best agreement between star formation rates derived from H and from total infrared luminosities (although discrepancies at the factor of 3–4 level still exist). There is considerable variation in the radio-far infrared correlation in different regions surrounding the shell. The low dust content of the region may influence the scatter seen in these relations; these data demonstrate that the expanding shell is dramatically affecting its surroundings by triggering star formation and altering the dust temperature.
Subject headings:
galaxies: dwarf — galaxies: irregular — galaxies: ISM — galaxies: individual (IC 2574) — infrared: galaxies1. Introduction
One of the most dramatic effects of vigorous star formation (SF) is the creation of holes and shells in the interstellar medium (ISM). It is commonly proposed that these structures are caused by feedback from massive stars (stellar winds and Type II SNe; e.g., Tenorio-Tagle & Bodenheimer 1988), though alternative scenarios do exist (high velocity cloud impacts, disk instabilities, turbulence, ram pressure stripping; e.g., Sánchez-Salcedo 2002). Starburst regions and sites of massive cluster formation provide spatially and temporally concentrated feedback that can create the largest of these structures. Holes and shells are therefore a direct, observable signature of the deposit of energy from stars into the ISM.
These structures are found in a great variety of environments, from the Milky Way disk (e.g., McClure-Griffiths et al., 2002) to the ISM of dwarf galaxies (e.g., Walter, 1999). After being formed by the combined effects of SNe and stellar winds, the evolution of holes and shells will have a strong environmental dependence; in normal spiral disks, these structures are erased by turbulent motions and rotational shear on time scales of 107 yr. On the other hand, in dwarf galaxies (typically displaying solid-body rotation), rotational shear will not play a major role, and holes and shells may remain coherent until pressure equilibrium is re-established with the local ISM (e.g., Elmegreen & Hunter, 2000). Indeed, studies of active, nearby dwarf galaxies show that these systems are permeated with holes and shells to the H i resolution limit [e.g., the Large Magellanic Cloud (Kim et al. 1999); the Small Magellanic Cloud (Stanimirovic et al. 1999); and IC 10 (Wilcots & Miller 1998), to name just a few].
IC 2574 is a comparatively large (optical disk 18 kpc diameter), relatively low-metallicity [12log(O/H) 8.15, or 30% Z⊙; Miller & Hodge 1996] dwarf galaxy in the M81 group that is undergoing active current SF (H-derived SFR 0.09 M⊙ yr-1; Miller & Hodge 1994, Kennicutt 1998). The galaxy hosts a multitude of H i holes and shells (Walter & Brinks, 1999), which at the distance of 4.0 Mpc (Karachentsev et al., 2002) provide a unique opportunity to study the process of SF and to observe its effects on the surrounding ISM. The most dramatic “supergiant shell” (SGS; Walter et al., 1998; Walter & Brinks, 1999) is expanding at 25 km s-1, has a diameter of 790 pc, a kinematic age of 15.8 Myr, an H i mass of 8.2105 M⊙, and requires an energy input of 5.81052 erg. As shown in Stewart & Walter (2000), the progenitor stellar cluster is interior to the shell, and the expanding structure is igniting sequential SF on the shell rim.
2. Observations and Data Reduction
For an overview of the Spitzer Infrared Nearby Galaxies Survey (SINGS) observational strategies, see Kennicutt et al. (2003). IC 2574 was observed for 71 minutes in IRAC mosaicing mode on 28 and 29 October, 2004; MIPS scan mapping mode observations were obtained on 1, 3 November, 2004, for a total of 127.6 minutes. All data were processed by the SINGS pipelines. The IRAC pipeline processes basic calibrated data images; flux levels are uncertain at the 10% level. The MIPS Instrument Team Data Analysis Tool (Gordon et al., 2005) was used to process the MIPS data. Systematic uncertainties (e.g., detector nonlinearities, time-dependent responsivity variations, background removal, etc.) limit the absolute flux calibration to 10% at 24 m and to 20% at 70 and 160 m. Fluxes were measured after convolution to the (38″ FWHM) 160m MIPS beam, using kernels derived from observations of a bright star (IRAC) or from STinyTim models, smoothed to match the observed PSFs (assuming a 25 K black body, suitable for the dust temperatures derived; MIPS).
3. Multiwavelength Emission from the SGS
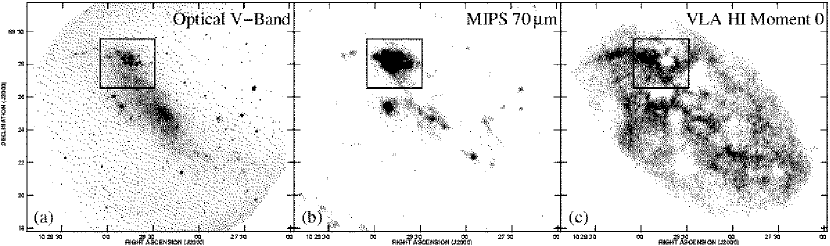
The SGS region provides the bulk ( 50% at 24 and 70 m) of the total IR (TIR) luminosity of IC 2574 at wavelengths longer than 5 m. In Figure 1 we present a comparison of the total galaxy emission in the optical V band, the MIPS 70 m band, and the H i spectral line. Note in Figure 1(c) that IC 2574 contains numerous H i shells (Walter & Brinks 1999 identify 48 holes and shells in the ISM; the SGS studied here corresponds to # 35 from that study).
In Figure 2 we present images of the SGS region at nine different wavelengths. Note from the optical (V-band; Figure 2a) and near-IR (IRAC 3.6 m; Figure 2b) images that the progenitor stellar cluster lies directly interior to the H i shell (see also Stewart & Walter, 2000); this is one of the clearest examples of a kinematically distinct gaseous shell with the parent cluster still visible. By 8 m (see Figure 2c) the spectral energy distribution of the cluster has fallen below the detection limit, and emission from hot dust and gas dominates; variations in emission in the MIPS bands (Figures 2d, e, f) indicate a wide variety of dust temperatures and spectral energy distributions. Note that the shell morphology is still evident at 70 and 160 m; the diffuse emission in the shell is most likely caused by the MIPS PSF profiles, which spread flux from high surface brightness regions onto arcminute scales (i.e., a few times the MIPS 160 m PSF FWHM). Comparison of the MIPS, H and radio continuum images [Figures 2(g, h)] shows a wide variation in the relative ratios. Finally, the H i distribution [Figure 2(i)] shows the H i shell very clearly; it is expanding into a non-uniform medium that may partially explain the variety of dust properties around the shell rim.
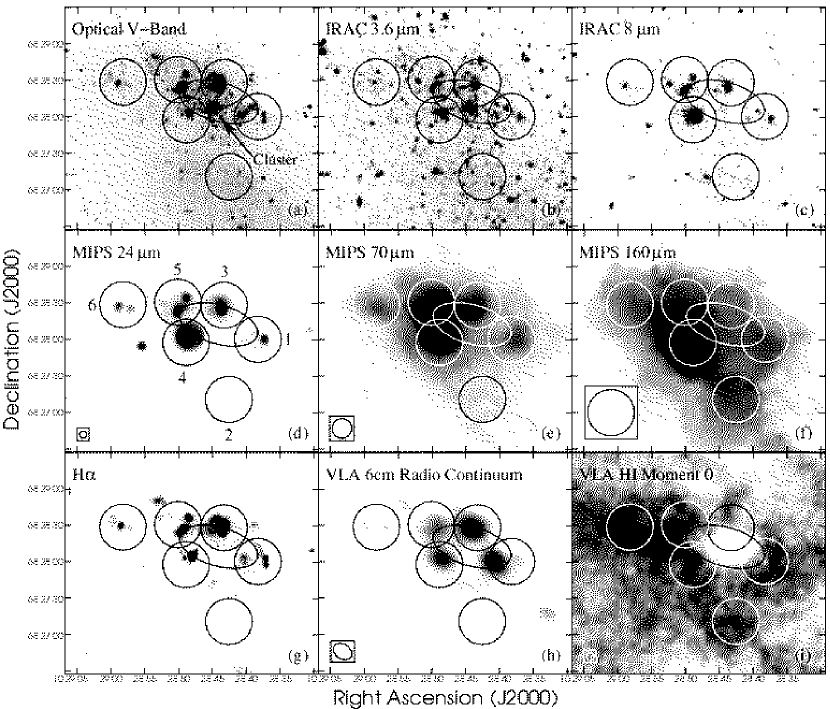
Flux densities were extracted in the apertures shown in Figure 2 (see Table 4); these regions were selected to encompass the mid-IR, far-IR, H, and H i emission peaks with the minimum number of apertures and amount of overlap (note that some apertures contain distinct emission properties at different wavelengths; e.g., SGS 1 shows a pronounced difference in H and radio continuum morphologies). The size of these apertures corresponds to the FWHM (38″ 740 pc) of the MIPS 160 m beam. Aperture correction factors have not been applied to the values shown in Table 4; the extent of the apertures for all wavelengths up to the MIPS 70 m band (sampling more than 2, 6, 16, and 36 times the FWHM at MIPS 70 m, MIPS 24 m, IRAC 8 m, and IRAC 3.6 m, respectively) should imply relatively small aperture correction effects at these wavelengths. There will be some aperture effects at MIPS 160 m and potentially at 70 m as well, though the quantification of these factors depends on many parameters (including the distribution of light within the aperture, location and brightness of neighboring sources, and many others).
4. Varying Dust Conditions in the SGS Region
The characteristics of the dust change dramatically between apertures. There are appreciable variations in the dust temperature; fν(70 m)/fν(160 m) varies by a factor of 3, with the warmest dust in regions SGS 3 and SGS 5. Fitting blackbody functions modified by a emissivity to the 70 and 160 m MIPS images (see, e.g., Bianchi et al., 1999), these fluctuations correspond to a temperature range of 23-29 K (averaged over each aperture; see Table 4). Note that the warmest dust is found in regions that have the highest H flux; the coolest dust is found in region SGS 2, which is at the largest distance from the SGS itself, and also shows the lowest H flux. Interestingly, region SGS 4, which shows the highest flux density in all Spitzer bands, does not show the highest H flux.
Comparing the far-IR, H, and H i morphologies, it is evident that all regions except SGS 3 occupy areas with high H i surface brightness (H i column densities 21021 cm-2). SGS 3 is the region with the largest H and 6 cm radio continuum fluxes, arguing for strong active SF, and also the highest fν(70 m)/fν(160 m) dust temperature ratio. Given the age of the shell ( 15 Myr) and the expected lifetimes of H ii regions and associated thermal radio continuum emission ( 30 Myr), this shell may be initiating rapid SF that quickly disperses the local gas supply.
| Parameter | SGS 1 | SGS 2 | SGS 3 | SGS 4 | SGS 5 | SGS 6 | SGS Total |
|---|---|---|---|---|---|---|---|
| (J2000) | 10:28:38.275 | 10:28:42.559 | 10:28:43.301 | 10:28:48.912 | 10:28:50.102 | 10:28:58.260 | 10:28:44.1 |
| (J2000) | 68:28:00.44 | 68:27:10.98 | 68:28:28.32 | 68:27:57.83 5 | 68:28:30.76 | 68:28:28.66 | 68:28:12.6 |
| H FluxbbDerived from the work of Miller & Hodge (1994); units of 10-14erg sec-1 cm-2. | 37 6 | 7.5 1.3 | 102 20 | 49 7 | 57 9 | 17 3 | 380 60 |
| H Convolved FluxccUsing the H image convolved to the MIPS 160 m FWHM 38″. | 28 6 | 8.5 1.3 | 66 20 | 37 7 | 48 9 | 12 3 | 380 60 |
| IRAC 3.6 m Flux Density | 1.4 0.2 | 1.6 0.2 | 1.9 0.3 | 2.0 0.3 | 1.8 0.3 | 1.1 0.2 | 28 4 |
| IRAC 4.5 m Flux Density | 1.3 0.2 | 1.4 0.2 | 1.7 0.3 | 1.9 0.3 | 1.7 0.3 | 1.2 0.2 | 29 4 |
| IRAC 8.0 m Flux Density | 1.1 0.2 | 1.1 0.2 | 1.5 0.2 | 2.9 0.4 | 1.9 0.3 | 0.9 0.1 | 22 3 |
| MIPS 24 m Flux Density | 5.3 0.8 | 2.6 0.4 | 12 2 | 24 4 | 15 2 | 4.6 0.7 | 100 20 |
| MIPS 70 m Flux Density | 110 20 | 70 20 | 160 30 | 250 50 | 240 50 | 97 20 | 1900 400 |
| MIPS 160 m Flux Density | 150 40 | 160 40 | 140 40 | 290 70 | 250 60 | 160 40 | 2600 650 |
| 6 cm Flux Density | 0.63 0.07 | 0.046 0.01 | 0.88 0.09 | 0.53 0.06 | 0.50 0.06 | 0.13 0.02 | 3.03 0.4 |
| F(H)/F(TIR) | 0.044 | 0.011 | 0.090 | 0.024 | 0.033 | 0.021 | 0.026 |
| F(H)/F(TIR)ccUsing the H image convolved to the MIPS 160 m FWHM 38″. | 0.034 | 0.012 | 0.058 | 0.019 | 0.028 | 0.014 | 0.026 |
| TDUST (K) | 26 3 | 23 3 | 29 3 | 26 3 | 28 3 | 25 3 | N/A |
| q (TIR/Radio)ddThe value of q in the radio-far IR relation, derived using the total IR flux and the radio continuum flux at 6 cm. These calculations assume a mix of thermal and nonthermal emission (i.e., 0.7, where Sν ) for the extrapolation from 20 to 6 cm flux densities. | 2.55 | 3.61 | 2.53 | 3.01 | 2.96 | 3.23 | 3.11 |
4.1. Variations in the IR vs. H Ratio
In principle, all UV photons within dusty environments will be absorbed and re-radiated in the IR; thus, there should exist a correlation between the IR luminosity and other SFR indicators, such as H emission. However, this simple scenario can become complicated in different environments, with dependencies on stellar populations, dust content, etc. (see Kennicutt 1998 for a more detailed discussion). In the case of (typically low-metallicity) dwarf star-forming galaxies such as IC 2574, the correlation between various SFR indicators may be especially complicated, given their low dust contents and IR luminosities. Dust extinction effects (in both an absolute and differential sense) on the H fluxes in the SGS are minimal, based on two independent lines of evidence: first, the UV imaging study of this region by Stewart & Walter (2000) shows typical line-of-sight reddening values in the wavelength range around H of A 0.15 mag, with a maximum of 0.3 mag; second, new HST/ACS imaging and color-magnitude diagram analysis of this region (E.D. Skillman, private communication) easily separates the blue helium-burning and main sequence stars, which at this metallicity are separated by 0.2 magnitudes in (VI) color.
We find that the L(H)/L(TIR) ratio is systematically higher (by factors of 10; see Table 4) in regions that are bright in H compared to more quiescent regions. If one were to naively convert the H and IR fluxes to SFRs [using the relations of Kennicutt (1998) and Dale & Helou (2002)], the SFR(H) values would be systematically higher (by factors of 10) than those derived from the total IR luminosity in the active regions. Since the Kennicutt (1998) FIR calibration assumes complete absorption of the starlight, this factor-of-ten difference implies a typical H extinction in these regions of about 10% (A(H) 0.1 mag). This is roughly consistent with the range of values cited above, and suggests caution in the application of SFR relations based on total IR luminosities in low-metallicity environments. Note that the variations in the L(H)/L(TIR) ratio are not due only to varying spatial resolutions between H and 160 m; we tested the severity of this effect by convolving the H image to the 160 m resolution, and find that the L(H)/L(TIR) ratio still varies by factors of 5 within the SGS region (see Table 4).
4.2. Variations in the Radio-Far IR Correlation
Assuming that the total IR fluxes (derived by applying equation 4 from Dale & Helou 2002) and the radio continuum emission are related via a constant value [q log(STIR/SRC); see, e.g., Bell (2003) for details], we derive strong variations in the value of q(TIR/Radio) throughout the SGS region (see Table 4). The mean value of “q” derived within the SGS region ( 3.0) is consistent with, though slightly larger than, the average global values found in a sample of larger spiral galaxies in the SINGS sample (Murphy et al., 2005); we find variations of 1 dex in the value of “q” throughout the SGS region. These strong variations may be a result of the low dust content in IC 2574 (an effect of the low metal content, or of dust destruction in the extreme SGS environment).
5. Conclusions
We have presented a multiwavelength study of the SGS region in IC 2574, highlighting new Spitzer imaging obtained as part of SINGS. The unique multiwavelength properties demonstrate that the expanding shell is dramatically affecting its surroundings by triggering SF and by altering the dust temperature and characteristics.
References
- Bell (2003) Bell, E. F. 2003, ApJ, 586, 794
- Bianchi et al. (1999) Bianchi, S., Davies, J. I., & Alton, P. B. 1999, A&A, 344, L1
- Dale & Helou (2002) Dale, D. A., & Helou, G. 2002, ApJ, 576, 159
- Elmegreen & Hunter (2000) Elmegreen, B. G., & Hunter, D. A. 2000, ApJ, 540, 814
- Gordon et al. (2005) Gordon, K.D., et al. 2005, PASP, 177, 503
- Helou et al. (2004) Helou, G., et al. 2004, ApJS, 154, 253
- Karachentsev et al. (2002) Karachentsev, I. D., et al. 2002, A&A, 383, 125
- Kennicutt (1998) Kennicutt, R. C. 1998, ARA&A, 36, 189
- Kennicutt et al. (2003) Kennicutt, R. C., et al. 2003, PASP, 115, 928
- Kim et al. (1999) Kim, S., Dopita, M. A., Staveley-Smith, L., & Bessell, M. S. 1999, AJ, 118, 2797
- McClure-Griffiths et al. (2002) McClure-Griffiths, N. M., Dickey, J. M., Gaensler, B. M., & Green, A. J. 2002, ApJ, 578, 176
- Miller & Hodge (1994) Miller, B. W., & Hodge, P. 1994, ApJ, 427, 656
- Miller & Hodge (1996) Miller, B. W., & Hodge, P. 1996, ApJ, 458, 467
- Murphy et al. (2005) Murphy, E. J., et al. 2005, ApJ, submitted
- Sánchez-Salcedo (2002) Sánchez-Salcedo, F. J. 2002, Revista Mexicana de Astronomia y Astrofisica, 38, 39
- Stanimirovic et al. (1999) Stanimirovic, S., Staveley-Smith, L., Dickey, J. M., Sault, R. J., & Snowden, S. L. 1999, MNRAS, 302, 417
- Stewart & Walter (2000) Stewart, S. G., & Walter, F. 2000, AJ, 120, 1794
- Tenorio-Tagle & Bodenheimer (1988) Tenorio-Tagle, G., & Bodenheimer, P. 1988, ARA&A, 26, 145
- Walter (1999) Walter, F. 1999, Publications of the Astronomical Society of Australia, 16, 106
- Walter & Brinks (1999) Walter, F., & Brinks, E. 1999, AJ, 118, 273
- Walter et al. (1998) Walter, F., Kerp, J., Duric, N., Brinks, E., & Klein, U. 1998, ApJ, 502, L143
- Wilcots & Miller (1998) Wilcots, E. M., & Miller, B. W. 1998, AJ, 116, 2363