Globular Clusters in Virgo Ellipticals: Unexpected Results for Giants, Dwarfs, and Nuclei from ACS Imaging
Abstract
We have analyzed archival Hubble Space Telescope/Advanced Camera for Surveys images in and of the globular cluster (GC) systems of 53 ellipticals in the Virgo Cluster, spanning massive galaxies to dwarf ellipticals (dEs). Several new results emerged: (i) In the giant ellipticals (gEs) M87 and NGC 4649, there is a correlation between luminosity and color for individual metal-poor GCs, such that more massive GCs are more metal-rich. A plausible interpretation of this result is self-enrichment, and may suggest that these GCs once possessed dark matter halos. (ii) In some gEs (most notably M87), there is an “interloping” subpopulation of GCs with intermediate colors (1.0 1.25) and a narrow magnitude range (0.5 mag) near the turnover of the GC luminosity function. These GCs look otherwise identical to the classic metal-poor and metal-rich GC subpopulations. (iii) The dispersion in color is nearly twice as large for the metal-rich GCs than the metal-poor GCs. However, there is evidence for a nonlinear relation between and metallicity, and the dispersion in metallicity may be the same for both subpopulations. (iv) Very luminous, intermediate-color GCs are common in gEs. These objects may be remnants of many stripped dwarfs, analogues of Cen in the Galaxy. (v) There is a continuity of GC system colors from gEs to some dEs: in particular, many dEs have metal-rich GC subpopulations. We also confirm the GC color–galaxy luminosity relations found previously for both metal-poor and metal-rich GC subpopulations. (vi) There are large differences in GC specific frequency among dEs, independent of the presence of a nucleus and the fraction of metal-rich GCs. Over , there is little correlation between specific frequency and (in contrast to previous studies). But we do find evidence for two separate classes of dEs: those with -band , and dEs with populous GC systems that have ranging from with median . Together, these points suggest multiple formation channels for dEs in the Virgo Cluster. (vii) The peak of the GC luminosity function (GCLF) is the same for both gEs and dEs. This is contrary to expectations of dynamical friction on massive GCs, unless the primordial GCLF varies between gEs and dEs. Among gEs the GCLF turnover varies by a surprising small 0.05 mag, an encouraging result for its use as an accurate standard candle. (viii) dE,Ns appear bimodal in their nuclear properties: there are small bright red nuclei consistent with formation by dynamical friction of GCs, and larger faint blue nuclei which appear to have formed by a dissipative process with little contribution from GCs. The role of dynamical evolution in shaping the present-day properties of dE GC systems and their nuclei remains ambiguous.
1 Introduction
It is increasingly apparent that globular clusters (GCs) offer important constraints on the star formation and assembly histories of galaxies. Recent spectroscopic studies of GCs in massive early-type galaxies (e.g., Strader et al. 2005) indicate that the bulk of star formation occurred at relatively high redshift () in high density environments (as environmental density and galaxy mass decrease, the fraction of younger GCs may increase; see Puzia et al. 2005). These findings allow the age-metallicity degeneracy to be broken and lead to the conclusion that the bimodal color distributions seen in most nearby luminous galaxies are due primarily to two old GC subpopulations: metal-poor (blue) and metal-rich (red). The metallicities of these peaks correlate with host galaxy luminosity (Larsen et al. 2001, Strader, Brodie, & Forbes 2004; see also Lotz, Miller, & Ferguson 2004 for dwarfs).
Most recent photometric studies of GC systems in ellipticals have used the Wide Field and Planetary Camera 2 (WFPC2) on the Hubble Space Telescope (HST). Compared to ground-based imaging, this strategy gains photometric accuracy and minimizes contamination at the expense of small spatial coverage. Among the larger HST studies of early-type galaxies utilizing deep imaging are Larsen et al. (2001) and Kundu & Whitmore (2001). These studies found bimodality in many of their sample galaxies (extending down to low-luminosity ellipticals) and a nearly uniform log-normal GC luminosity function (GCLF) with a peak at . However, the GC systems of dwarf ellipticals (dEs) are more poorly understood. The large HST surveys to date (primarily of Virgo and Fornax) have been limited to relatively shallow snapshot imaging; this precluded the study of color and luminosity distributions in detail. Among the suggestions of this initial work are a correlation of increasing specific frequency () with decreasing galaxy luminosity, a dichotomy in the GC systems of nucleated and non-nucleated dEs (dE,N and dE,noN, respectively), and the difficulty of making dE nuclei as observed through dynamical friction of GCs (Miller et al. 1998, Lotz et al. 2001).
Data from the Advanced Camera for Surveys (ACS) Virgo Cluster Survey (HST GO 9401, P. I. Côté) offers an important step forward in understanding the detailed properties of the GC systems of ellipticals over a wide range in galaxy mass. The use of F475W and F850LP filters (henceforth called and for convenience, though the filters do not precisely match the Sloan ones) allows a much wider spectral baseline for metallicity separation than and . Though only a single orbit is used per galaxy, the increased sensitivity of ACS (compared to WFPC2) allows one to reach mag beyond the turnover of the GCLF, encompassing most of the GCs in a given galaxy. More accurate photometry for the brighter GCs is also possible. Finally, the field of view of ACS is twice that of WFPC2. Together, these attributes allow a study of the color and luminosity distribution of GCs in a large sample of galaxies in much more detail than previously possible.
In what follows, elliptical (unabbreviated) refers to all galaxies in our sample and denotes no specific luminosity. The three brightest galaxies are described as giant ellipticals (gEs); these have . Galaxies of intermediate or high luminosity are called Es. Faint galaxies with exponential surface brightness profiles are dEs; the transition from E to dE occurs traditionally at (Kormendy 1985). We include two galaxies with (VCC 1422 and VCC 1261) under this heading, since these galaxies have nuclei similar to those commonly found among dEs. The E/dE classifications have been taken from the literature and we do not perform independent surface photometry in this paper (though we note the increasing debate in the literature about whether this dichotomy is real, e.g., Graham & Guzmán 2003). We have updated the nucleation status of a dE if appropriate; the vast majority of the dEs in our study have nuclei.
2 Data Reduction and Analysis
All data were taken as part of the ACS Virgo Cluster Survey (Côté et al. 2004); this survey includes both ellipticals and S0s. We used all galaxies classified as ellipticals, excepting a few dwarfs quite close to luminous Es whose GC systems could not be isolated. This left a final sample of 53 galaxies. Images were first processed through the standard ACS pipeline. Multidrizzle was utilized for image combining and cosmic ray rejection. GC candidates were selected as matched-filter detections on 20 20 pixel median-subtracted images. Using DAOPHOT II (Stetson 1993), aperture photometry was performed in a 5-pixel aperture and adjusted to a 10-pixel aperture using corrections of in and in . These are median corrections derived from bright objects in the five most luminous galaxies in the Virgo Cluster Survey: VCC 1226, VCC 1316, VCC 1978, VCC 881, and VCC 798. These 10-pixel magnitudes were then corrected to a nominal infinite aperture using values of in and in (Sirianni et al. 2005; this paper describes the photometric calibration of ACS). Finally, the magnitudes were transformed to the AB system using zeropoints from Sirianni et al. (26.068 and 24.862 for and , respectively), and corrected for Galactic reddening using the maps of Schlegel Finkbeiner, & Davis (1998).
Most GCs at the distance of Virgo are well-resolved in ACS imaging. Half-light radii () for GC candidates were measured on images (since the PSF is more centrally concentrated) using the ishape routine (Larsen 1999). For each object, King models with fixed (for ) and varying were convolved with a distant-dependent empirical PSF derived from bright isolated stars in the images to find the best-fit . This is typical of non core-collapsed GCs in the Milky Way (Trager, King, & Djorgovski 1995). We experimented with allowing to vary, but it was poorly constrained for most GCs. However, the adopted in ishape has little effect on the derived (Larsen 1999). To convert these measured sizes into physical units, galaxy distance estimates are required. We used those derived from surface brightness fluctuation measurements in the literature when possible: these were available from Tonry et al. (2001) for the bright galaxies and from Jerjen et al. (2004) for several dEs. For the remainder of the galaxies we used a fixed distance of 17 Mpc, which is the mean of the ellipticals in Tonry et al.
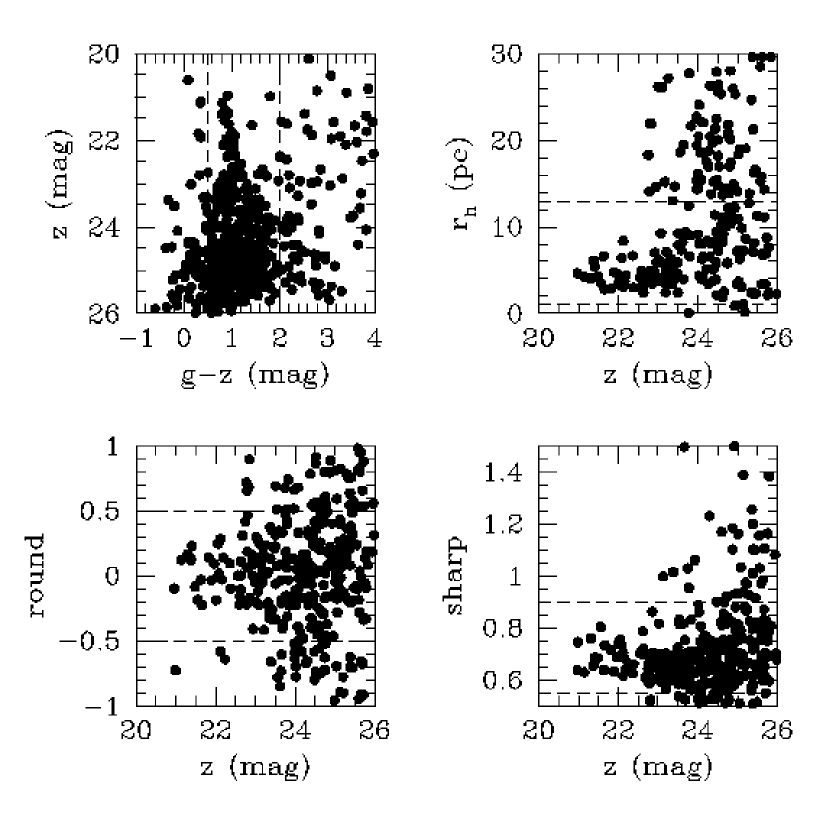
Due to the depth of the images (), some of the fields suffer significant contamination from foreground stars and especially background galaxies. Using the gEs and several of the more populous dEs as fiducials, we chose the following structural cuts to reduce interlopers: 0.55 sharp 0.9, round , and (pc) , where the sharp and round parameters are from DAOPHOT. A large upper limit for is used since the size measurements skew systematically larger for fainter GCs. We further applied a color cut of ( mag to each blue and red of the limiting metallicities expected for old GCs; Jordán et al. 2004) and an error limit 0.15 mag. In practice, this magnitude limit excluded most GCs within the innermost few arcsec of the brightest galaxies (whose GC systems are quite populous). Finally, we visually inspected all GC candidates, and excluded those which were obviously background galaxies. Our criteria are illustrated visually in Figure 1 for the bright dE VCC 1087, which displays a good mix of actual GCs and contaminants.
These cuts remove nearly all foreground stars. However, compact galaxies (or compact star-forming regions within larger galaxies) with the appropriate colors can masquerade as GCs. In some images, clusters of galaxies are clearly visible. The increasing numbers of background sources at , combined with the difficulty of accurate size measurements below this magnitude, makes efficient rejection of contaminants challenging. For gEs this is a minimal problem, due to the large number of GCs within the ACS field of view (hundreds to for M87). But with dEs and even low-luminosity Es, contaminants can represent a large fraction of the GC candidates. Due to these concerns, we chose only to use GCs brighter than to study the colors and total numbers of GCs for the remainder of the paper. However, we used minimal cuts to study GC luminosity functions; this is described in more detail in §4.
Basic data about the 53 galaxies in our sample are given in Table 1, along with GC system information as discussed below.
3 Color Distributions
3.1 Massive Ellipticals
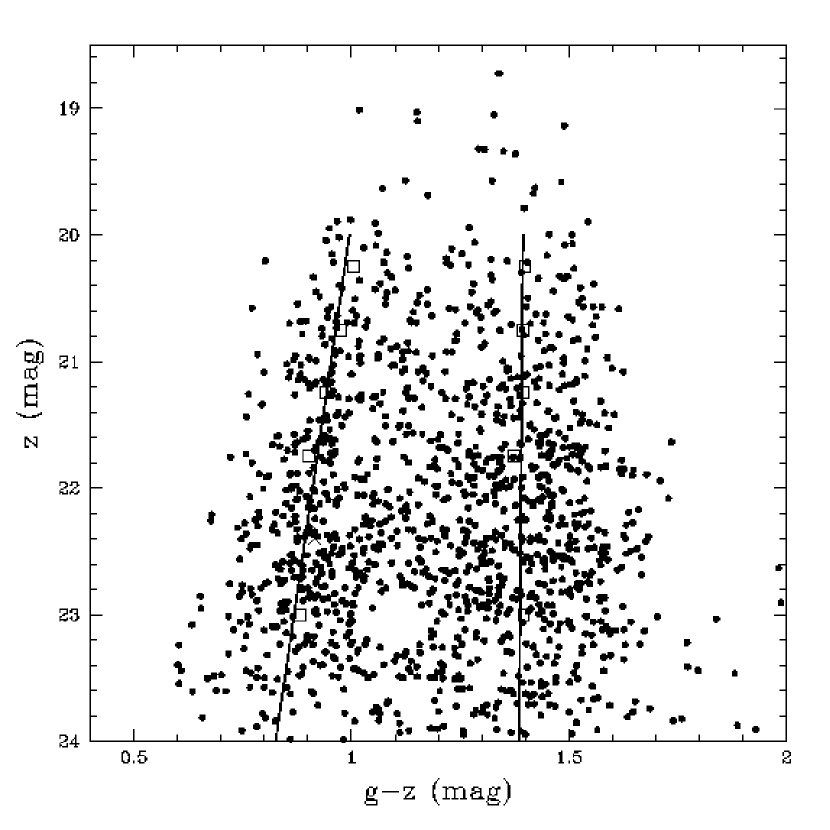
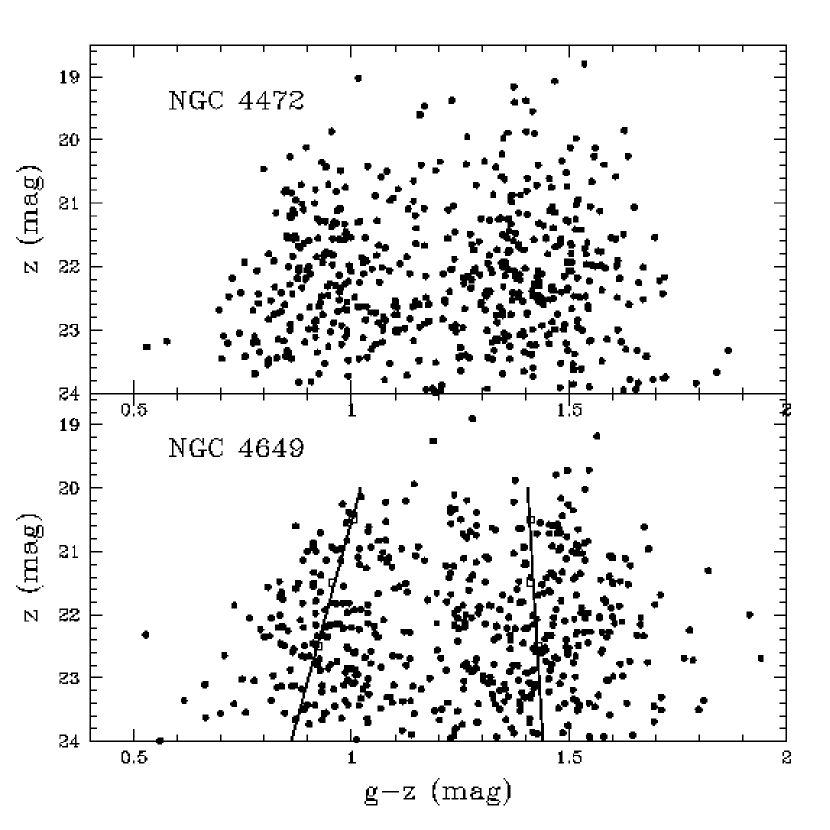
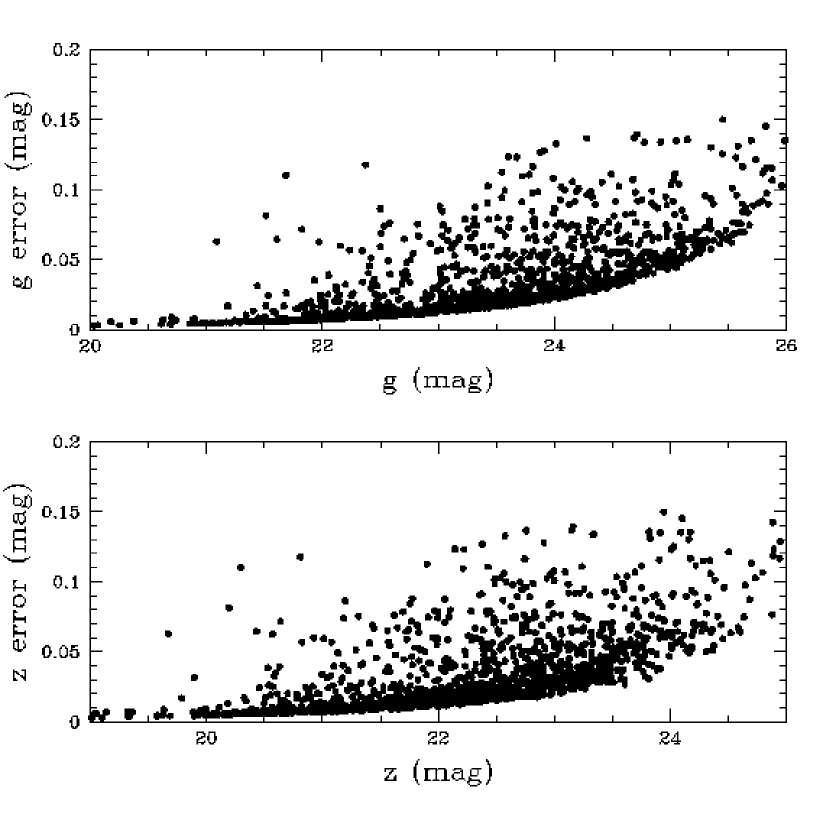
In Figures 2 and 3 we show the color-magnitude diagrams (CMDs) for the three most luminous galaxies in our sample: NGC 4472 (), M87 (), and NGC 4649 (). Figure 4 is a plot of magnitude vs. photometric error in and for M87. The CMDs in Figures 2 and 3 contain considerable structure only apparent because of the large number of GCs; we have chosen to discuss them in some detail.
All three gEs clearly show the bimodality typical of massive galaxies, with blue and red peaks of and , respectively. This separation is twice as large as is typical of studies of GC systems in (e.g., Larsen et al. 2001; Kundu & Whitmore 2001), due to the larger metallicity sensitivity of the baseline. However, a new result is that the red peak is clearly broader than the blue peak; at bright magnitudes () there is little photometric error so this must be due to real color differences. To gauge the size of this effect, we fit a heteroscedastic normal mixture model to the M87 colors in the range . Subtracting a median photometric error of 0.02 mag in quadrature, we find and . These values may be overestimates because of the presence of contaminants in the tails of the color distributions, but provide first-order estimates for investigation. Given the lack of evidence for significant age differences among bright GCs in massive early-type galaxies (Strader et al. 2005), it is reasonable to attribute the dispersion in entirely to metallicity.
To convert these dispersions into metallicity, we must find a relation between [M/H] and . Jordán et al. (2004) used Bruzual & Charlot (2003) models to find a linear relationship in the range [M/H] , however, the relation may be nonlinear for low metallicities. We fit a quadratic relation for [M/H] and using Maraston (2005) model predictions for for four metallicities () and Bruzual & Charlot (2003) predictions at five metallicities (). Both sets of models assume a 13 Gyr stellar population and a Salpeter initial mass function. The resulting fit is: [M/H] . Using this relation, the blue and red GC dispersions correspond to metallicity ranges of (, ) and (, ), respectively. Thus, despite the wider color range of the red GCs, their logarithmic metallicity range appears no wider than that of the blue GCs due to the nonlinear relationship between and metallicity. A caveat is that this conclusion depends critically upon our assumed relation, which is likely to be most uncertain in the metal-poor regime where the stellar libraries of the models have few stars.
In M87, there is a clear enhancement of GCs at with intermediate colors, giving the CMD the appearance of a “cosmic H”. This is illustrated more clearly in Figure 5, which shows color histograms of GCs in the regions and , just below. Such a subpopulation of “H” clusters is also present, albeit less clearly and slightly fainter, in NGC 4472. Since this is near the turnover of the GCLF (with the largest number of GCs per magnitude bin), it is difficult to acertain whether the enhancement is present at all colors or only in a narrow range. However, this subpopulation appears normal in all other respects. Defining a fiducial sample as lying in the range: and , the sizes and radial distribution of these GCs lie between those of the blue and red GCs, though perhaps more similar to the blue ones. Visually they are indistinguishable from GCs of similar luminosity. With current data we cannot say how common these “H” GCs are in massive ellipticals, though their presence in NGC 4472 suggests that in the Virgo Cluster the phenomenon is not limited to M87. Here only 34 GCs fall into the limits defined above (though this is unlikely to define a complete sample); if this subpopulation scales with GC system richness, 10 or fewer might be expected in other luminous galaxies, rendering their detection difficult. At spectroscopy of these GCs is feasible (though difficult), and could help establish whether their intermediate colors are due principally to metallicity or age, and whether they have kinematics distinct from the blue or red GCs. There may be a tail of these objects that extend to brighter magnitudes, but it is difficult to tell whether these are just outlying GCs in the normal blue or red subpopulations.
Also of interest is a group of anomalously bright GCs (), which have a wide range in color () and in some galaxies are separated from the bulk of the GC system by 0.1 mag or more. In M87, these GCs are on average larger (with mean pc) than GCs in the rest of the system, and have median galactocentric distances smaller ( kpc) than the GC system as a whole. The dispersions in these properties appear consistent with the GC system as a whole, but with few bright clusters this is difficult to constrain. Some of these luminous GCs are likely in the tail of the normal blue and red subpopulations, but given the wide range in colors (including many with intermediate colors), small galactocentric radii, and the larger-than-average sizes, a portion may also be the stripped nuclei of dwarf galaxies—analogues of Cen in the Galaxy (Majewski et al. 2000). The color distribution of dE nuclei in this sample (see below) peaks at , consistent with the blue end of the intermediate-color objects. The surface brightness profiles of these objects resemble those of other GCs and do not have the exponential profiles seen in some ultra-compact dwarf galaxies (de Propris et al. 2005), though we note our size selection criterion for GCs would exclude some Virgo UCDs (Hasegan et al. 2005). Similar bright, intermediate-color GCs have also been found in the NGC 1399 (Dirsch et al. 2003), NGC 4636 (Dirsch, Schuberth, & Richtler 2005), and NGC 1407 (Cenarro et al. 2005); they appear to be a common feature of gEs.
3.1.1 The Blue Tilt
A feature present in the CMDs of M87 and NGC 4649 is a tilt of the color distribution of blue GCs, in the sense that the mean color of the blue GCs becomes redder with increasing luminosity. No such trend is apparent for the red GCs. A precise measure of this observation is challenging; due to the multiple subpopulations and “H” GCs, a direct linear fit is not viable. Instead, we divided the M87 GC candidates into four 0.5 mag bins in the range and one 0.4 mag bin (, avoiding the “H” GCs). To each of these bins we fit a heteroscedastic normal mixture model, and then fit a weighted linear model to the resulting blue peaks. This model is ; the slope is significant. A fit to the corresponding red peaks is consistent with a slope of zero. These fits, as well as the binned values, are overplotted on the M87 CMD in Figure 2. Including a bin with the “H” GCs () gives a slope which is (unsurprisingly) slightly more shallow () but still significant. NGC 4649 has fewer GCs than M87 and appears to have no “H” GCs, so for this galaxy we fit three 1.0 mag bins in the range . The resulting blue GC model is , which agrees very well with that of M87, and there is again no significant evidence for a nonzero red GC slope.
The smoothness of the change argues against stochastic stellar population changes (e.g., horizontal branch stars, blue stragglers) as the cause of the trend. If due to age, its size— mag in over mag in —would require an unlikely age spread of Gyr at low metallicity using Maraston (2005) models. If due to metallicity, the color–metallicity relation derived above indicates the trend corresponds to a mean slope of dex/mag. For blue GCs in these galaxies, metallicity correlates with mass. Interpretations of this surprising finding are discussed below; first we consider whether a bias in observation or analysis might be the cause.
Given that the correlation extends over a large range in GC luminosity, and is not seen for red GCs, selection bias (choosing redder GCs at bright magnitudes and bluer GCs at faint magnitudes) seems unlikely to be a factor. There is no significant correlation between GC luminosity and galactocentric radius, ruling out a radial variation in any quantity as a cause (e.g., dust). Together these facts also suggest that a systematic photometric error cannot be blamed.
To physically produce the observed correlation, either more massive GCs must have formed from more enriched gas, or individual GCs must have self-enriched. In the former picture, we could imagine blue GCs forming in proto-dwarf galaxies with varying metal enrichment. The essential problem is that there is no evidence that the GCLF varies strongly among dEs, as we would need the most metal-rich dEs to have few or no low-mass GCs to preserve the relation.
GC self-enrichment might explain the correlation, as more massive GCs could retain a larger fraction of supernovae (SNe) ejecta. The self-enrichment of GCs has been studied in some detail as a possible origin to the chemical inhomogeneities observed among stars in Galactic GCs (e.g., Smith 1987). Early works (e.g., Dopita & Smith 1986) argued that only the most massive GCs could retain enough gas to self-enrich, but this depends critically on the assumed initial metal abundance of the proto-GC cloud and on the details of the cooling curve. Morgan & Lake (1989) found that a more accurate cooling curve reduced the critical mass to in a “supershell” model, as suggested by Cayrel (1986). In the model of Parmentier et al. (1999), proto-GC clouds are confined by a hot protogalactic medium, and this model in fact predicts an inverse GC mass-metallicity relation, in which the most massive GCs are the most metal-poor (Parmentier & Gilmore 2001). Clearly a wide range of models exist, and it is possible that with the appropriate initial conditions and physical mechanism a self-enrichment model of this sort can be made to work.
Another possibility is that the blue GCs formed inside individual dark matter (DM) halos. This scenario was first proposed by Peebles (1984), but fell into disfavor (Moore 1996) after studies of Galactic GCs found low mass-to-light ratios (Pryor et al. 1989) and tidal tails were observed around several GCs (e.g., Pal 5; Odenkirchen et al. 2003). Recently, Bromm & Clarke (2002) and Mashchenko & Sills (2005a,b) have used numerical simulations to argue that GCs with primordial DM halos could lose the bulk of the DM through either violent relaxation at early times or subsequent tidal stripping. If true, then a present-day lack of DM does not necessarily imply that GCs never had DM halos. It seems qualitatively plausible to produce the correlation in this context, but whether it could be sustained in detail requires additional simulation. Any such model need also be compared to the rather stringent set of other observations of blue GCs (some of which are not usually considered), including the lack of GC mass–radius and metallicity–galactocentric radius relations and the presence of a global correlation between the mean metallicity of blue GCs and parent galaxy mass. In addition, since the Galaxy itself (and perhaps NGC 4472) show no obvious blue GC mass–metallicity relationship, variations among galaxies are needed.
It is also important to explain why the red GCs do not show such a relation. If the mass–metallicity relation was in terms of absolute metallicity, then a small increase in metallicity () could be visible among the blue GCs but not among the red GCs. Even if no weak relation exits, one cannot rule out a metallicity-dependent process that results in a relation only for the blue GCs even if both subpopulations formed the same way. Many other physical properties of the blue and red GCs are similar enough (e.g., GC mass functions, sizes) that it may be challenging to invoke completely different formation mechanisms. Some of the similarities could be due to post-formation dynamical destruction of low-mass or diffuse GCs, which might act to erase initial variations in some GC system properties. No consensus exists in the literature on the effectiveness of GC destruction in shaping the present-day GC mass function (e.g., Vesperini 2001; Fall & Zhang 2001).
3.2 Subpopulation Colors and Numbers
The GC color distributions were modeled using the Bayesian program Nmix (Richardson & Green 1997), which fits normal heteroscedastic mixture models. The number of subpopulations is a free parameter (ranging to 10). For nearly all of the bright galaxies, two subpopulations were preferred; in no such galaxy was there a strong preference for a uni- or trimodal color distribution. Thus we report bimodal fits for these galaxies. While many of the dE color distributions visually appear bimodal, they generally had too few GCs to constrain the number of subpopulations with this algorithm. We adopted the following solution: we fit one peak to galaxies which only had GCs with ; to the remaining galaxies we fit two peaks. A histogram of the dE GC colors (Figure 6) shows bimodality, which suggests that this approach is reasonable. Of course, some of the dEs have few GCs, so the peak locations may be quite uncertain.
Linear relationships have previously been reported between parent galaxy luminosity and the mean colors (peak/mode of a Gaussian fit) of the red (Larsen et al. 2001; Forbes & Forte 2001) and blue (Strader, Forbes, & Brodie 2004; Larsen et al. 2001; Lotz, Miller & Ferguson 2004) subpopulations. Except for the massive Es, the individual subpopulations in this study have few GCs. Thus, errors on peak measurements are significant for most galaxies. Nevertheless, Figure 7 shows that clear linear relationships are present for both the blue and red GCs over the full mag range in parent galaxy luminosity. These weighted relations are and for the blue and red GCs, respectively. The plotted error bars are standard errors of the mean. The fits exclude the gE NGC 4365, whose anomalous GC system has been discussed in detail elsewhere (Larsen, Brodie, & Strader 2005, Brodie et al. 2005, Larsen et al. 2003, Puzia et al. 2002). For the red GCs there is a hint that the slope may flatten out for the faintest galaxies, but a runs test on the red residuals gave (and for the blue GCs), suggesting reasonable model fits. Many possible systematic errors could affect the faintest galaxies, e.g., the larger effects of contamination, and the uncertainty in the distances to individual galaxies, which could change their by mag. Thus, one cannot conclude that the GC color-galaxy luminosity relations are well-constrained at the faint end of our sample. However, they are consistent with extrapolations from brighter galaxies. Our results are also consistent with previous slope measurements: Larsen et al. (2001) and Strader et al. (2004) found that the red:blue ratio of slopes is , while we find in . This is consistent with , a rough initial estimate of color conversion (Brodie et al. 2005). There is at least one ongoing program to study Galactic GCs in the Sloan filter set which should improve this (and similar) conversions considerably.
It does appear that the residuals of the blue and red peak values are correlated; this is probably unavoidable when fitting heteroscedastic mixture models to populations which are not well-separated. Since the red and blue GC subpopulations clearly have different dispersions where this can be tested in detail, fitting homoscedastic models does not make sense. We experimented with fitting two-component models with the variances fixed to the mean value for the brightest galaxies, for which the large number of GCs (at least partially) breaks the degeneracy between peak location and dispersion. The slopes of the resulting blue and red relations are similar to those found using the above approach: and , respectively. However, the blue peak values for many of the galaxies appear to be artificially high—this may be because galaxies less massive than gEs have smaller intra-subpopulation metallicity spreads. Thus we have chosen to leave the original fits as our final values.
The very existence of red GCs in faint galaxies with to is an interesting and somewhat unexpected result. In massive early-type galaxies and many spiral bulges, the number of red GCs normalized to spheroid luminosity is approximately constant (Forbes, Brodie, & Larsen 2001). This suggests that red GCs formed along with the spheroidal field stars at constant efficiency. However, many properties of dEs (e.g., surface brightness profiles, M/L ratios, spatial/velocity distribution, stellar populations) suggest that their formation mechanism was different from massive Es (e.g., Kormendy 1985, though see Graham & Guzmán 2003 for a different view). A continuity of red GC properties between Es and at least some of the dEs in our sample could imply either that their formation mechanisms were more similar than expected or that red GCs are formed by a self-regulating, local process that can occur in a variety of contexts.
The mixture modeling also returns the number of GCs in each subpopulation. In Figure 8 we plot the fraction of blue GCs vs. galaxy luminosity. There is a general trend (with a large scatter) for an increasing proportion of blue GCs with decreasing galaxy luminosity. The average fraction of blue GCs for the dEs is , with many galaxies having no red GCs. The fraction asymptotes to for the gEs, but since these data cover only the central, more red-dominated part of their GC systems, the global fraction is likely higher (e.g., in a wide-field study of three gEs by Rhode & Zepf 2004, the blue GC fraction ranged from 0.6–0.7.). The GC systems of the dEs fall entirely within the ACS field of view (see discussion below), so their measured blue GC fractions are global.
These results show clearly that the classic correlation between GC metallicity/color and galaxy luminosity (Brodie & Huchra 1991) is a combination of two effects: the decreasing ratio of blue to red GCs with increasing galaxy luminosity, and, more importantly, the GC color-galaxy luminosity relations which exist for both subpopulations. There does not seem to be a single “primordial” GC color–galaxy luminosity relation, as assumed in the accretion scenario for GC bimodality (e.g., Côté, Marzke, & West 2002)
4 Luminosity Functions and Nuclei
Many previous works have found (e.g., Harris 1991, Secker 1992, Kundu & Whitmore 2001, Larsen et al. 2001) that the GCLF in massive galaxies is well-fit by a Gaussian or distribution with similar properties among well-studied galaxies: , . However, the shape among dwarf galaxies is poorly known. Individual galaxies have too few GCs for a robust fit, and thus a composite GCLF of many dwarfs is necessary. Using ground-based imaging, Durrell et al. (1996) found that the turnover of the summed GCLF of 11 dEs in Virgo was mag fainter the M87 turnover. Lotz et al. (2001) presented HST/WFPC2 snapshot imaging of 51 dEs in Virgo and Fornax; the summed GCLF in Lotz et al. is not discussed, but a conference proceeding using the same data (Miller 2002) suggests and for Virgo and Fornax, respectively.
We study the dE GCLF through comparison to gEs (VCC 1316–M87, VCC 1226–NGC 4472, and VCC 1978–NGC 4649) previously found to have “normal” GCLFs (Larsen et al. 2001). For dwarfs we constructed a summed GCLF of all 37 dEs ( in our sample). Since the individual distance moduli of the dEs are unknown, this GCLF could have additional scatter because of the range of galaxy distances; we find below that this appears to be quite a small effect. The individual GC systems of dEs are quite concentrated: most GCs are within , beyond which the background contamination rises sharply (size measurements are unreliable at these faint magnitudes). Thus for the dEs we selected only those GCs within of the center of the galaxy.
In the previous sections we used photometric and structural cuts to reduce the number of background galaxies and foreground stars interloping in our GC samples. However, these same cuts cannot be directly used to fit GCLFs, since these measurements become increasingly inaccurate for faint GCs (which may then be incorrectly removed). For example, applying only the color cut () vs. the full selection criteria to M87 changes the number of GCs with by 16% (1444 vs. 1210) and shifts the peak of the GCLF by mag, which is quite significant.
We directly fit distributions to the three gE GCLFs using using the code of Secker & Harris (1993), which uses maximum-likelihood fitting and incorporates photometric errors and incompleteness (Gaussian fits gave similar results within the errors; note that ). These GCLFs only have a color cut applied: for M87 and NGC 4472 and for NGC 4649 (since star-forming regions in the nearby spiral NGC 4647 strongly contaminate the blue part of the CMD). The results are given in Table 2. We fit both total populations and blue and red GCs separately, using the color cuts given in the table. Similar to what is commonly seen in -band GCLFs (e.g., Larsen et al. 2001), the turnovers are mag brighter for the blue GCs than the red GCs. This is predicted for equal-mass/age turnovers separated by dex in metallicity (Ashman, Conti & Zepf 1995). However, in the blue GCs are only slightly brighter than the red GCs (the mean difference is negligible, but the blue GCs are brighter in M87 and NGC 4472 and fainter in NGC 4649, which may be biased slightly faint because of contamination). This difference between and is qualitatively consistent with stellar population models: Maraston (2005) models predict that equal-mass 13 Gyr GCs with [M/H] = and will have and ; the difference is one-third of the difference. This effect is probably due to the greater sensitivity of to the turnoff region and the larger number of metal lines in the blue. The errors for the blue GCLF parameters may be slightly larger than formally stated because of the presence of the “H” GCs discussed previously. Variations in this feature and in the blue tilt among galaxies could represent a fundamental limitation to the accuracy to using only the blue GCLF turnover as a standard candle (see, e.g., Kissler-Patig 2000). However, the total peak locations themselves are quite constant, with a range of only 0.03 mag in and 0.05 mag in . At least for the well-populated old GC systems of gEs, the GCLF turnover appears to be an accurate distance indicator whose primary limitation is accurate photometry.
Unfortunately, we cannot directly fit the composite dE GCLF as for the gEs—it is far too contaminated. Instead, we must first correct for background objects. As noted above, the GC systems of the dEs are very centrally concentrated. Thus we can use the outer regions of the dE images as a fiducial background. We defined a background sample in the radial range (corresponding to 5.4–6.2 kpc at a distance of 17 Mpc), then subtracted the resulting GCLF in 0.1 mag bins from the central sample with the appropriate areal correction factor. We confined the fit to candidates with because of the small color range of the dEs. The resulting fit (performed as above) gave a turnover of , compared to the weighted mean of for the gEs. These are consistent. Since the GCLFs are being used, the overall color differences between the GC systems should have little effect on the peak locations. The dispersion of the dEs () is less than that of the gEs (); this is probably partially due to the smaller color range of the dEs. It also indicates that the range of galaxy distances is probably not significant, consistent with the projected appearance of many of the dEs near the Virgo cluster core (Binggeli et al. 1987).
That the peak of the GCLF appears to be the same for both gEs and dEs is perhaps puzzling. Even if both galaxy types had similar primordial GCLFs, analytic calculations and numerical simulations of GC evolution in the tidal field of the dEs suggest that dynamical friction should destroy high-mass GCs within several Gyr (Oh & Lin 2000, Lotz et al. 2001). Tidal shocks (which tend to destroy low-mass GCs) are more significant in massive galaxies, so it is unlikely that the loss of high-mass GCs in dEs could be balanced by a corresponding amount of low-mass GC destruction to preserve a constant turnover. ab initio variations in the GCLF between dEs and gEs are another possibility, but cannot be constrained at present.
If we see no evidence in the dE GCLF turnover for dynamical friction, does this provide significant evidence against this popular scenario for forming dE nuclei? In order study the relationship between the nuclei and GCs of our sample galaxies, we performed photometry and size measurements on all of the dE nuclei. The procedures were identical to those described above for the GCs, except that aperture corrections were derived through analytic integration of the derived King profile, since many of the nuclei were large compared to typical GC sizes. The properties of the nuclei are listed in Table 3.
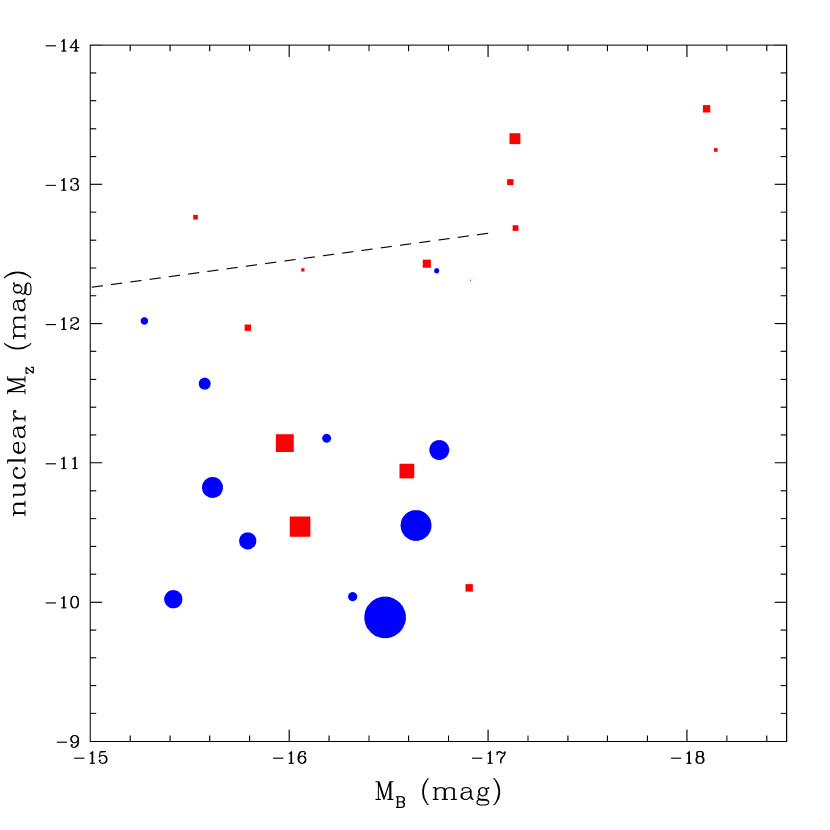
In Figure 9 we plot parent galaxy vs. of the nucleus. Symbol size is proportional to nuclear size. The overplotted dashed line represents Monte Carlo simulations of nuclear formation through dynamical friction of GCs from Lotz et al.(2001). These assume 5 Gyr of orbital decay (implicitly assuming the GCs are Gyr old); we have converted their to using stellar populations models of Maraston (2005). Lotz et al. found that the expected dynamical friction was inconsistent with observations, since the observed nuclei were fainter than predicted by their simulations. They argued that some additional process was needed to oppose dynamical friction (e.g., tidal torques).
At first glance, this is supported by Figure 9—for galaxies in the luminosity range , there is a mag range in nuclear luminosity. But most of the bright nuclei are quite small, while those much fainter than predicted from the simulations are generally larger (by factors of 2–4). In addition, the small nuclei tend to be redder than the large ones; some of the large faint nuclei are blue enough that they require some recent star formation. While not a one-to-one relation, it seems plausible that these luminosity and size distributions reflect two different channels of nuclear formation: small bright red nuclei are formed by dynamical friction, while large faint blue nuclei are formed by a dissipative process with little or no contribution from GCs. The red nuclei have typical colors of , consistent with those of the red GCs in dEs. This implies that red GCs (rather than blue GCs) would need to be the primary “fuel” for nuclei built by dynamical friction, at least among the brigher dEs. The formation of blue nuclei could happen as the dE progenitor entered the cluster, or during tidal interactions that drive gas to the center of the galaxy (i.e., harassment, Mayer et al. 2001). Present simulations do not resolve the central parts of the galaxy with adequate resolution to estimate the size of a central high-density component, but presumably this will be possible in the future.
It is unclear how to square the hypothesis that some nuclei are built by dynamical friction with the GCLF results from above. Perhaps the small of the composite dE (compared to the gEs) is additional evidence of GC destruction. Our background correction for the dE GCLF is potential source of systematic error in the turnover determination. Deeper ACS photometry for several of the brighter Virgo dEs could be quite helpful, since it could give both better rejection of background sources and more accurate SBF distances to the individual dEs.
5 Specific Frequencies
For the Es in our sample, the ACS FOV covers only a fraction of their GC system, and no robust conclusions about their total number of GCs can be drawn without uncertain extrapolation. The GC systems of fainter Es and dEs are less extended and fall mostly or entirely within ACS pointings. As previously discussed, is often used as a measure of the richness of a GC system. In fact, Harris & van den Bergh (1981) originally defined in terms of the bright GCs in a galaxy: the total number was taken as the number brighter than the turnover doubled. The justification for this procedure was that the faint end of the GCLF was often ill-defined, with falling completeness and rising contamination. In addition, for a typical log-normal GCLF centered at , 90% or more of the total GC system mass is in the bright half of the LF.
Many of the dEs in this study have tens or fewer detected GCs, making accurate measurements of the shape of the LF impossible. Thus counting only those GCs brighter than the turnover is unwise; small variations in the peak of the GCLF among galaxies (either due to intrinsic differences or the unknown galaxy distances) could cause a large fraction of GC candidates to be included or excluded. As discussed in §2, we chose as the magnitude limit for our study. This is mag beyond the turnover of the composite dE GCLF discussed in the previous section (, ) at a nominal Virgo Cluster distance of 17 Mpc. For such galaxies our magnitude cutoff corresponds to % completeness. Thus, to get total GC populations for the dEs, we divided the number of GCs brighter than by this factor (for the few dEs with individual distance moduli, we integrated the LF to find the appropriate correction factor). Finally, as discussed in §4, the photometric and structural cuts used to reduce contaminants also remove real GCs. Using M87 as a standard, 16.2% of real GCs with were falsely removed; we add back this statistical correction to produce our final estimate of the total GC population. Due to the small radial extent of the dE GC systems (primarily within a projected galactocentric radius of ) no correction for spatial coverage is applied.
We calculated -band using the absolute magnitudes in Table 1. Unless otherwise noted, all refer to -band values. These can be converted to the standard -band by dividing our values by a factor ; a typical dE has , which corresponds to a conversation factor . is plotted against in Figure 10. In this figure the dE,N galaxies are filled circles and the dE,noN galaxies are empty circles. The symbol size is proportional to the fraction of blue GCs.
Miller et al. (1998) found that dE,noNs had, on average, lower than dE,Ns, and that for both classes of dE there was an inverse correlation between and galaxy luminosity. We do not see any substantial difference between dE,noN and dE,N galaxies. There does appear to be a weak correlation between and in our data (with quite large for some of the faintest galaxies), but there is a large spread in for most luminosities. The does not appear to depend strongly on the fraction of blue GCs, so differing mixes of subpopulations cannot be responsible for the variations. Thus the observed values correspond to total blue GC subpopulations which vary by a factor of up to at a given luminosity. There appear to be two sets of galaxies: one group with , the other group ranging from and a slight enhancement at . We only have one galaxy in common with Miller et al. (VCC 9), but our for this single galaxy is consistent with theirs within the errors. We note again that background contamination remains as a systematic uncertainty for total GC populations.
It is tempting to argue that these groups represent different formation channels for dEs, e.g., the fading/quenching of dIrrs, harassment of low-mass spirals, or simply a continuation of the E sequence to fainter magnitudes. In some scenarios for blue GC formation (e.g., Strader et al. 2005; Rhode et al. 2005), galaxies with roughly similar masses in a given environment would be expected to have similar numbers of blue GCs per unit mass of their DM halos. Variations in at fixed luminosity would then be due to differences in the efficiency of converting baryons to stars—either early in the galaxy’s history (due to feedback) or later, due to galaxy transformation processes as described above. Two pieces of observational evidence should help to differentiate among the possibilities. First, GC kinematics can be used directly to constrain dE mass-to-light ratios (e.g., Beasley et al. 2005). It will be interesting to see whether GC kinematics are connected to the apparent dichotomy of rotating vs. non-rotating dEs (Pedraz et al. 2002, Geha et al. 2002, 2003, van Zee et al. 2004). Second, more detailed stellar population studies of dEs are needed, especially any method which (unlike integrated light spectroscopy) can break the burst strength–age degeneracy. A rather ad hoc alternative is that the efficiency of blue GC formation varies substantially among Virgo dEs, but this cannot be constrained at present. It is interesting that the fraction of blue GCs appears unrelated both to the nucleation of the dE and the variations; this suggests that whatever process leads to red GC formation in dEs is independent of these other factors.
6 Summary
We have presented a detailed analysis of the GC color and luminosity distributions of several gEs and of the colors, specific frequencies, luminosity functions, and nuclei of a large sample of dEs. The most interesting feature in the gEs M87 and NGC 4649 is a correlation between mass and metallicity for individual blue GCs. Self-enrichment is a plausible interpretation of this observation, and could suggest that these GCs once possessed dark matter halos (which may have been subsequently stripped). Among the other new features observed are very luminous () GCs with intermediate to red colors. These objects are slightly larger than typical GCs and may be remnants of stripped dwarf galaxies. Next, we see an intermediate-color group of GCs which lies near the GCLF turnover and in the gap between the blue and red GCs. Also, the color spread among the red GCs is nearly twice that of the blue GCs, but because the relation between and metallicity appears to be nonlinear, the dispersion in metallicity ( dex) may be the same for both subpopulations.
The peak of the GCLF is the same in the gEs and a composite dE, modulo uncertainties in background subtraction for the dEs. This observation may be difficult to square with theoretical expectations that dynamical friction should deplete massive GCs in less than a Hubble time, and with the properties of dE nuclei. There appear to be two classes of nuclei: small bright red nuclei consistent with formation by dynamical friction of GCs, and larger faint blue nuclei which appear to have formed by a dissipative process with little contribution from GCs.
Though dominated by blue GCs, many dEs appear to have bimodal color distributions, with significant red GC subpopulations. The colors of these GCs form a continuity with those of more massive galaxies; both the mean blue and red GC colors of dEs appear consistent with extrapolations of the GC color–galaxy luminosity relations for luminous ellipticals. We confirm these relations for both blue and red GC subpopulations. While previous works found an inverse correlation between dE and galaxy luminosity, we find little support for such a relation. There is a large scatter in among dEs and some evidence for two separate groups of galaxies: dEs with , and dEs with large GC systems that have ranging from with median . However, these variations do not appear to be connected to the presence of a nucleus or the fraction of red GCs. Our findings suggest multiple formation channels for Virgo dEs.
References
- Ashman et al. (1995) Ashman, K. M., Conti, A., & Zepf, S. E. 1995, AJ, 110, 1164
- Beasley et al. (2005) Beasley, M. A., Strader, J., Brodie, J. P., A. J. Cenarro, & Geha, M. 2005, AJ, submitted
- Binggeli et al. (1987) Binggeli, B., Tammann, G. A., & Sandage, A. 1987, AJ, 94, 251
- Brodie & Huchra (1991) Brodie, J. P., & Huchra, J. P. 1991, ApJ, 379, 157
- Brodie et al. (2005) Brodie, J. P., et al. 2005, AJ, in press
- Bromm & Clarke (2002) Bromm, V., & Clarke, C. J. 2002, ApJ, 566, L1
- Bruzual & Charlot (2003) Bruzual, G., & Charlot, S. 2003, MNRAS, 344, 1000
- Cayrel (1986) Cayrel, R. 1986, A&A, 168, 81
- Cenarro et al. (2005) Cenarro, A. J., et al. 2005, in preparation
- Côté et al. (2002) Côté, P., West, M. J., & Marzke, R. O. 2002, ApJ, 567, 853
- Côté et al. (2004) Côté, P., et al. 2004, ApJS, 153, 223
- De Propris et al. (2005) De Propris, R., Phillipps, S., Drinkwater, M. J., Gregg, M. D., Jones, J. B., Evstigneeva, E., & Bekki, K. 2005, ApJ, 623, L105
- Dirsch et al. (2003) Dirsch, B., Richtler, T., Geisler, D., Forte, J. C., Bassino, L. P., & Gieren, W. P. 2003, AJ, 125, 1908
- Dirsch et al. (2005) Dirsch, B., Schuberth, Y., & Richtler, T. 2005, A&A, 433, 43
- Dopita & Smith (1986) Dopita, M. A., & Smith, G. H. 1986, ApJ, 304, 283
- Durrell et al. (1996) Durrell, P. R., Harris, W. E., Geisler, D., & Pudritz, R. E. 1996, AJ, 112, 972
- Fall & Zhang (2001) Fall, S. M., & Zhang, Q. 2001, ApJ, 561, 751
- Forbes, Brodie, & Larsen (2001) Forbes, D. A., Brodie, J. P., & Larsen, S. S. 2001, ApJ, 556, L83
- Forbes & Forte (2001) Forbes, D. A. & Forte, J. C. 2001, MNRAS, 322, 257
- Geha et al. (2002) Geha, M., Guhathakurta, P., & van der Marel, R. P. 2002, AJ, 124, 3073
- Geha et al. (2003) Geha, M., Guhathakurta, P., & van der Marel, R. P. 2003, AJ, 126, 1794
- Graham & Guzmán (2003) Graham, A. W., & Guzmán, R. 2003, AJ, 125, 2936
- Harris & van den Bergh (1981) Harris, W. E., & van den Bergh, S. 1981, AJ, 86, 1627
- Harris (1991) Harris, W. E. 1991, ARA&A, 29, 543
- Hasegan et al. (2005) Hasegan, M., et al. 2005, ApJ, 627, 203
- Jerjen et al. (2004) Jerjen, H., Binggeli, B., & Barazza, F. D. 2004, AJ, 127, 771
- Jordán et al. (2004) Jordán, A., et al. 2004, ApJS, 154, 509
- Kissler-Patig (2000) Kissler-Patig, M. 2000, Reviews of Modern Astronomy, 13, 13
- Kormendy (1985) Kormendy, J. 1985, ApJ, 295, 73
- Kundu & Whitmore (2001) Kundu, A. & Whitmore, B. C. 2001, AJ, 121, 2950
- Larsen (1999) Larsen, S. S. 1999, A&AS, 139, 393
- Larsen et al. (2001) Larsen, S. S., Brodie, J. P., Huchra, J. P., Forbes, D. A., & Grillmair, C. J. 2001, AJ, 121, 2974
- Larsen et al. (2003) Larsen, S. S., Brodie, J. P., Beasley, M. A., Forbes, D. A., Kissler-Patig, M., Kuntschner, H., & Puzia, T. H. 2003, ApJ, 585, 767
- Larsen, Brodie, & Strader (2005) Larsen, S. S., Brodie, J. P., & Strader, J. 2005, A&A, submitted
- Lotz et al. (2001) Lotz, J. M., Telford, R., Ferguson, H. C., Miller, B. W., Stiavelli, M., & Mack, J. 2001, ApJ, 552, 572
- Lotz et al. (2004) Lotz, J. M., Miller, B. W., & Ferguson, H. C. 2004, ApJ, 613, 262
- Maraston (2005) Maraston, C. 2005, MNRAS, in press
- Mashchenko & Sills (2005a) Mashchenko, S., & Sills, A. 2005, ApJ, 619, 243
- Mashchenko & Sills (2005b) Mashchenko, S., & Sills, A. 2005, ApJ, 619, 258
- Majewski et al. (2000) Majewski, S. R., Patterson, R. J., Dinescu, D. I., Johnson, W. Y., Ostheimer, J. C., Kunkel, W. E., & Palma, C. 2000, Liege International Astrophysical Colloquia, 35, 619
- Mayer et al. (2001) Mayer, L., Governato, F., Colpi, M., Moore, B., Quinn, T., Wadsley, J., Stadel, J., & Lake, G. 2001, ApJ, 559, 754
- Miller et al. (1998) Miller, B. W., Lotz, J. M., Ferguson, H. C., Stiavelli, M., & Whitmore, B. C. 1998, ApJ, 508, L133
- Miller (2003) Miller, B. W. 2003, Extragalactic Globular Cluster Systems, 199
- Morgan & Lake (1989) Morgan, S., & Lake, G. 1989, ApJ, 339, 171
- Moore (1996) Moore, B. 1996, ApJ, 461, L13
- Odenkirchen et al. (2003) Odenkirchen, M., et al. 2003, AJ, 126, 2385
- Oh & Lin (2000) Oh, K. S., & Lin, D. N. C. 2000, ApJ, 543, 620
- Parmentier et al. (1999) Parmentier, G., Jehin, E., Magain, P., Neuforge, C., Noels, A., & Thoul, A. A. 1999, A&A, 352, 138
- Parmentier & Gilmore (2001) Parmentier, G., & Gilmore, G. 2001, A&A, 378, 97
- Pedraz et al. (2002) Pedraz, S., Gorgas, J., Cardiel, N., Sánchez-Blázquez, P., & Guzmán, R. 2002, MNRAS, 332, L59
- Peebles (1984) Peebles, P. J. E. 1984, ApJ, 277, 470
- Pryor et al. (1989) Pryor, C., McClure, R. D., Fletcher, J. M., & Hesser, J. E. 1989, AJ, 98, 596
- Puzia et al. (2002) Puzia, T. H., Zepf, S. E., Kissler-Patig, M., Hilker, M., Minniti, D., & Goudfrooij, P. 2002, A&A391, 453
- Puzia et al. (2005) Puzia, T. H., et al. 2005, A&A, in press
- Rhode, Santos, & Zepf (2005) Rhode, K. L., Santos, M., & Zepf, S. E. 2005, ApJ, submitted
- Rhode & Zepf (2004) Rhode, K. L., & Zepf, S. E. 2004, AJ, 127, 302
- Richardson & Green (1997) Richardson, S. & Green, P. G. 1997, JR Statist. Soc. B, 1997, 59, 731
- Richtler (2003) Richtler, T. 2003, LNP Vol. 635: Stellar Candles for the Extragalactic Distance Scale, 635, 281
- Schlegel, Finkbeiner, & Davis (1998) Schlegel, D. J., Finkbeiner, D. P., & Davis, M. 1998, ApJ, 500, 525
- Secker (1992) Secker, J. 1992, AJ, 104, 1472
- Secker & Harris (1993) Secker, J., & Harris, W. E. 1993, AJ, 105, 1358
- Sirianni et al. (2005) Sirianni, M., et al. 2005, ApJ, submitted
- Smith (1987) Smith, G. H. 1987, PASP, 99, 67
- Stetson (1993) Stetson, P. B. 1993, DAOPHOT II User’s Manual (Victoria: Dominion Astrophys. Obs.)
- Strader, Brodie, & Forbes (2004) Strader, J., Brodie, J. P., & Forbes, D. A. 2004, AJ, 127, 295
- Strader et al. (2005) Strader, J., Brodie, J. P., Cenarro, A. J., Beasley, M. A., & Forbes, D. A. 2005, AJ, in press
- Tonry et al. (2001) Tonry, J. L., Dressler, A., Blakeslee, J. P., Ajhar, E. A., Fletcher, A. B., Luppino, G. A., Metzger, M. R., & Moore, C. B. 2001, ApJ, 546, 681
- Trager et al. (1995) Trager, S. C., King, I. R., & Djorgovski, S. 1995, AJ, 109, 218
- van Zee et al. (2004) van Zee, L., Skillman, E. D., & Haynes, M. P. 2004, AJ, 128, 121
- Vesperini (2001) Vesperini, E. 2001, MNRAS, 322, 247


| Galaxy | Alt. Name | dE,N? | aaDistance modulus, if available from Tonry et al. (2001) or Jerjen et al. (2004). Otherwise the Tonry et al. mean value of 17 Mpc ( = 31.15) is used. | Blue peak | Red peak | No. GCs | Blue frac. | Red frac. | ||
|---|---|---|---|---|---|---|---|---|---|---|
| VCC | NGC/IC | (mag) | (mag) | (mag) | (mag) | () | ||||
| 1226 | N4472 | 21.85 | 31.06 | 0.951 | 1.411 | 482 | 0.44 | 0.56 | ||
| 1316 | N4486 | 21.54 | 31.03 | 0.953 | 1.390 | 1180 | 0.43 | 0.57 | ||
| 1978 | N4649 | 21.44 | 31.13 | 0.964 | 1.424 | 451 | 0.39 | 0.61 | ||
| 763 | N4374 | 21.24 | 31.32 | 0.927 | 1.322 | 259 | 0.51 | 0.49 | ||
| 731 | N4365 | 21.13 | 31.55 | 0.891 | 1.232 | 419 | 0.18 | 0.82 | ||
| 1903 | N4621 | 20.69 | 31.31 | 0.927 | 1.305 | 209 | 0.37 | 0.63 | ||
| 1632 | N4552 | 20.33 | 30.93 | 0.951 | 1.334 | 288 | 0.39 | 0.61 | ||
| 1231 | N4473 | 20.00 | 30.98 | 0.942 | 1.310 | 160 | 0.50 | 0.50 | ||
| 1279 | N4478 | 19.24 | 31.29 | 0.882 | 1.195 | 92 | 0.50 | 0.50 | ||
| 1025 | N4434 | 19.17 | 32.14 | 0.911 | 1.179 | 37 | 0.74 | 0.26 | ||
| 1664 | N4564 | 19.02 | 30.88 | 0.935 | 1.263 | 95 | 0.28 | 0.72 | ||
| 828 | N4387 | 18.95 | 31.65 | 0.859 | 1.112 | 37 | 0.65 | 0.35 | ||
| 2000 | N4660 | 18.74 | 30.54 | 0.923 | 1.320 | 76 | 0.69 | 0.31 | ||
| 1321 | N4489 | 18.54 | 31.26 | 0.900 | 1.260 | 23 | 0.91 | 0.09 | ||
| 1630 | N4551 | 18.45 | 31.19 | 0.890 | 1.219 | 24 | 0.58 | 0.42 | ||
| 1146 | N4458 | 18.35 | 31.19 | 0.892 | 1.223 | 33 | 0.21 | 0.79 | ||
| 1422 | I3468 | Y | 18.14 | 31.64 | 0.925 | 1.130 | 20 | 0.46 | 0.54 | 2.4 |
| 1261 | N4482 | Y | 18.10 | 31.54 | 0.884 | 1.065 | 29 | 0.42 | 0.58 | 3.3 |
| 9 | I3019 | N | 17.24 | 31.00 | 0.864 | 1.093 | 20 | 0.74 | 0.26 | 3.8 |
| 1087 | I3381 | Y | 17.14 | 31.33 | 0.897 | 1.168 | 46 | 0.81 | 0.19 | 11.0 |
| 856 | I3328 | Y | 17.13 | 31.28 | 0.905 | 1.114 | 8 | 0.50 | 0.50 | 1.9 |
| 575 | N4318 | N | 17.11 | 0.884 | 1.182 | 5 | 0.43 | 0.57 | 1.4 | |
| 1871 | I3653 | N | 17.11 | 30.84 | 0.851 | 7 | 1.00 | 0.00 | 1.2 | |
| 1910 | I809 | Y | 17.11 | 0.864 | 1.129 | 30 | 0.47 | 0.53 | 6.9 | |
| 1861 | I3652 | Y | 16.91 | 0.879 | 1.173 | 28 | 0.62 | 0.38 | 7.7 | |
| 543 | Y | 16.90 | 0.794 | 3 | 1.00 | 0.00 | 0.8 | |||
| 1431 | I3470 | N | 16.88 | 0.938 | 1.138 | 37 | 0.58 | 0.42 | 10.6 | |
| 1528 | I3501 | N | 16.76 | 0.872 | 1.177 | 35 | 0.87 | 0.13 | 11.2 | |
| 1355 | I3442 | Y | 16.75 | 30.92 | 0.837 | 1.089 | 6 | 0.83 | 0.17 | 1.7 |
| 437 | Y | 16.74 | 0.894 | 1.042 | 7 | 0.86 | 0.14 | 2.3 | ||
| 2019 | I3735 | Y | 16.69 | 0.848 | 1.198 | 10 | 0.53 | 0.47 | 3.4 | |
| 33 | I3032 | Y | 16.64 | 0.861 | 1.169 | 5 | 0.53 | 0.47 | 1.8 | |
| 200 | Y | 16.59 | 0.931 | 1.101 | 3 | 0.67 | 0.33 | 1.1 | ||
| 1488 | I3487 | Y | 16.48 | 0.824 | 1.086 | 6 | 0.67 | 0.33 | 2.5 | |
| 1545 | I3509 | N | 16.37 | 0.869 | 1.071 | 34 | 0.67 | 0.33 | 15.4 | |
| 1895 | Y | 16.32 | 0.818 | 1.071 | 7 | 0.51 | 0.49 | 3.3 | ||
| 1857 | I3647 | N | 16.20 | 0.845 | 4 | 1.00 | 0.00 | 2.2 | ||
| 1075 | I3383 | Y | 16.19 | 0.834 | 1.056 | 18 | 0.70 | 0.30 | 9.7 | |
| 1627 | N | 16.16 | 0.755 | 2 | 1.00 | 0.00 | 1.1 | |||
| 1948 | I798 | N | 16.15 | 0.779 | 1.177 | 4 | 0.50 | 0.50 | 2.2 | |
| 230 | I3101 | Y | 16.07 | 0.842 | 1.134 | 17 | 0.61 | 0.39 | 10.3 | |
| 1440 | N | 16.07 | 0.854 | 16 | 1.00 | 0.00 | 9.6 | |||
| 2050 | I3779 | Y | 16.05 | 0.880 | 1.060 | 7 | 0.82 | 0.14 | 4.2 | |
| 1828 | I3635 | Y | 15.98 | 0.898 | 16 | 1.00 | 0.00 | 10.5 | ||
| 1993 | N | 15.97 | 0.851 | 1 | 1.00 | 0.00 | 0.7 | |||
| 1407 | I3461 | Y | 15.79 | 0.919 | 1.142 | 33 | 0.60 | 0.40 | 25.5 | |
| 1886 | Y | 15.79 | 0.877 | 4 | 1.00 | 0.00 | 3.1 | |||
| 1743 | I3602 | N | 15.74 | 0.855 | 3 | 1.00 | 0.00 | 2.4 | ||
| 1539 | Y | 15.61 | 0.898 | 1.039 | 22 | 0.57 | 0.43 | 20.0 | ||
| 1185 | Y | 15.57 | 0.890 | 1.077 | 14 | 0.86 | 0.14 | 13.2 | ||
| 1826 | I3633 | Y | 15.53 | 0.884 | 7 | 1.00 | 0.00 | 6.9 | ||
| 1489 | I3490 | Y | 15.42 | 0.858 | 1.136 | 14 | 0.68 | 0.32 | 15.3 | |
| 1661 | Y | 15.27 | 0.838 | 1.130 | 4 | 0.50 | 0.50 | 4.9 |
| Galaxy | Band | Total | Total | Blue | Blue | Red | Red |
|---|---|---|---|---|---|---|---|
| (mag) | (mag) | (mag) | (mag) | (mag) | (mag) | ||
| M87 | |||||||
| NGC 4472 | |||||||
| NGC 4649 | |||||||
| gE mean | 0.81 | 0.78 | 0.86 | ||||
| 1.03 | 0.96 | 1.08 |
| Galaxy | bbThe photometric errors in these quantities are mag for most galaxies and mag for the remainder. | bbThe photometric errors in these quantities are mag for most galaxies and mag for the remainder. | ||
|---|---|---|---|---|
| VCC | (mag) | (mag) | (mag) | (pc) |
| 1261 | 12.49 | 13.54 | 1.05 | 4.9 |
| 856 | 12.24 | 13.33 | 1.07 | 7.1 |
| 1422 | 11.92 | 13.25 | 1.20 | 2.2 |
| 1910 | 11.74 | 13.02 | 1.14 | 3.9 |
| 437 | 11.52 | 12.38 | 0.87 | 2.4 |
| 1087 | 11.41 | 12.69 | 1.27 | 3.6 |
| 1826 | 11.41 | 12.77 | 1.13 | 2.9 |
| 1861 | 11.39 | 12.31 | 1.04 | 0.6 |
| 230 | 11.20 | 12.39 | 1.03 | 2.1 |
| 2019 | 11.15 | 12.43 | 1.10 | 5.2 |
| 1661 | 11.01 | 12.02 | 0.91 | 3.4 |
| 1407 | 10.93 | 11.97 | 1.04 | 4.1 |
| 1185 | 10.60 | 11.57 | 0.96 | 5.4 |
| 1075 | 10.35 | 11.18 | 0.81 | 4.0 |
| 1355 | 10.11 | 11.09 | 0.98 | 9.1 |
| 1539 | 10.06 | 10.82 | 0.80 | 9.6 |
| 1828 | 10.04 | 11.14 | 1.01 | 11.5 |
| 200 | 9.86 | 10.94 | 1.18 | 9.5 |
| 33 | 9.61 | 10.55 | 0.88 | 14.2 |
| 2050 | 9.45 | 10.54 | 1.05 | 13.3 |
| 1886 | 9.35 | 10.44 | 0.91 | 7.9 |
| 1489 | 9.06 | 10.02 | 0.82 | 8.4 |
| 1488 | 8.99 | 9.89 | 0.75 | 19.2 |
| 1895 | 8.99 | 10.04 | 0.95 | 4.1 |
| 543 | 8.91 | 10.10 | 1.13 | 4.8 |