The Chandra view of extended X-ray emission from Pictor A
Abstract
We discuss the extended X-ray emission seen in three archival Chandra observations, and one archival XMM-Newton observation, of the FRII radio galaxy Pictor A. The overall properties of the X-ray lobes are consistent with the conclusions of earlier workers that the extended X-ray emission is largely due to the inverse-Compton process, and the implied departure from equipartition is in the range seen by us in other sources. In detail, we show that the X-ray/radio flux ratio varies quite strongly as a function of position throughout the source, and we discuss possible implications of this observation for the spatial variation of electron energy spectra and magnetic field strength through the lobe. We show that the radio and X-ray properties of the lobe are not consistent with a simple model in which variations in the magnetic field strength alone are responsible for the observed differences between emission at different frequencies. We also discuss the origins of the extended emission seen around the eastern hotspot, arguing that it may be diffuse synchrotron radiation tracing a region of distributed particle acceleration, and the implications of a possible weak X-ray counterjet detection which, taken together with the other properties of the bright X-ray jet, leads us to suggest that the X-ray jet and possible counterjet are also produced by synchrotron emission.
keywords:
galaxies: active – X-rays: galaxies – galaxies: individual: Pictor A – galaxies: jets – radiation mechanisms: non-thermal1 Introduction
Lobe-related X-ray emission has now been seen in a large number of powerful (FRII: Fanaroff & Riley 1974) radio galaxies and quasars (Kataoka & Stawarz 2005; Croston et al. 2005). Although in a few cases the X-ray emission coincident with the lobes has been interpreted in terms of shocked thermal material (e.g. Nulsen et al. 2005) it seems most likely, from the good agreement between the observed flux levels and the predictions of an inverse-Compton model, that the vast majority of sources are dominated by inverse-Compton emission. This unexpected result has provided us with valuable insights into the energetics and particle content of FRII lobes; for example, it severely reduces the likelihood of an energetically dominant proton population (Croston et al. 2005) and where comparisons have been possible (e.g. Hardcastle et al. 2002, Croston et al. 2004) it suggests that the internal pressure of the lobes is comparable to the pressure in the external thermal medium.
The cosmic microwave background generally provides the energetically dominant photon population in the lobes of large radio sources, although infrared photons from the active nucleus may be important in some cases (e.g. Brunetti, Setti & Comastri 1997). In either case, since relatively high-energy photons are being scattered into the X-ray, the inverse-Compton emission tells us about the low-energy electron population, with Lorentz factors for scattering of the cosmic microwave background (CMB) and for nuclear infrared photons. The synchrotron emission from these electrons is generally unobservable with the current generation of radio telescopes, appearing at tens of MHz or below (e.g. Harris 2004). Thus, if we have identifiable inverse-Compton emission from a population of electrons whose energies can be inferred by other means, the X-ray data can give us spatially resolved information about the low-energy electron population that can currently be obtained in no other way.
To do this in practice requires good statistics in the X-ray, and this rules out many distant FRII sources, where the lobe X-ray detection may consist of only a few tens of counts, sufficient to estimate the overall lobe magnetic field strength (e.g. Croston et al. 2005) but not to look in detail at spatial variations of the X-ray surface brightness as a function of radio brightness. Some work has been done in this area with long observations (e.g. Isobe et al. 2002, 2005) but it has not been possible to draw very strong conclusions about the low-energy electron population because the number of photons collected is still small for most sources. For a fixed lobe magnetic field strength, inverse-Compton lobe emissivity scales linearly with synchrotron emissivity, and so the brightest radio sources are a good place to start searching for bright inverse-Compton emission. However, the X-ray emission from several of the brightest extragalactic radio sources in the sky (Cygnus A, Cen A, M87, Her A) is dominated by thermal bremsstrahlung from the cluster environment, while the lobes of Fornax A, which provided the original claimed detection of lobe inverse-Compton emission (Feigelson et al. 1995, Kaneda et al. 1995, Tashiro et al. 2001) and ‘Centaurus B’ (PKS B1343601: Tashiro et al. 1998) are too large for observations with the current generation of X-ray telescopes to be very useful. However, Pictor A, roughly the 8th brightest radio source in the sky in terms of flux density at low frequencies [the list of Robertson (1973) omits Cyg A and Cen B] has little thermal emission, is well matched in size (LAS 8 arcmin) to the Chandra field of view, and is an FRII source, which allows a comparison with the large number of more distant powerful FRIIs observed to have lobe X-ray emission (Kataoka & Stawarz 2005; Croston et al. 2005). The original Chandra observation of Pic A was discussed by Wilson, Young & Shopbell (2001: hereafter W01). In addition to X-ray detections of a bright jet and of the previously known X-ray hotspot, they noted some extended X-ray emission associated with the E lobe. Grandi et al. (2003) used XMM-Newton observations of the source to show that extended emission from both lobes was detected and to argue for an inverse-Compton origin for the extended X-ray emission, but were only able to discuss in detail the X-rays from a small region near the E hotspot. In this paper we revisit the Chandra data of W01 and the XMM-Newton data of Grandi et al. (2003), together with new data available in the Chandra archive, and use the spatial resolution of Chandra and the sensitivity provided by more than 110 ks of observations to discuss the relationship between the large-scale radio and X-ray emission in the source.
Pic A is a broad-line radio galaxy with (e.g. Simkin et al. 1999). In what follows we use a concordance cosmology with km s-1 Mpc-1, and ; at the redshift of Pic A, 1 arcsec corresponds to 700 pc. All spectral fits include Galactic absorption with a column density of cm. Spectral indices are the energy indices and are defined in the sense that flux . Where a spectral index is quoted with subscript and superscript frequency values, it represents the two-point radio spectral index between the specified frequencies.
2 Observations and analysis
2.1 Chandra
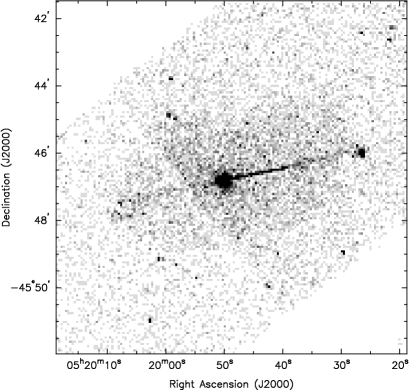
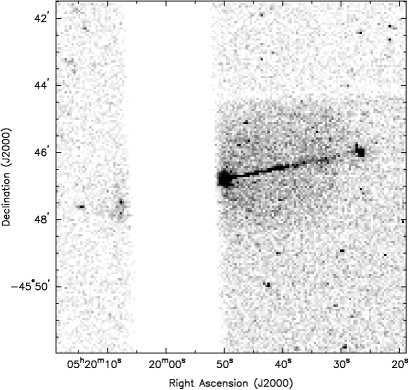
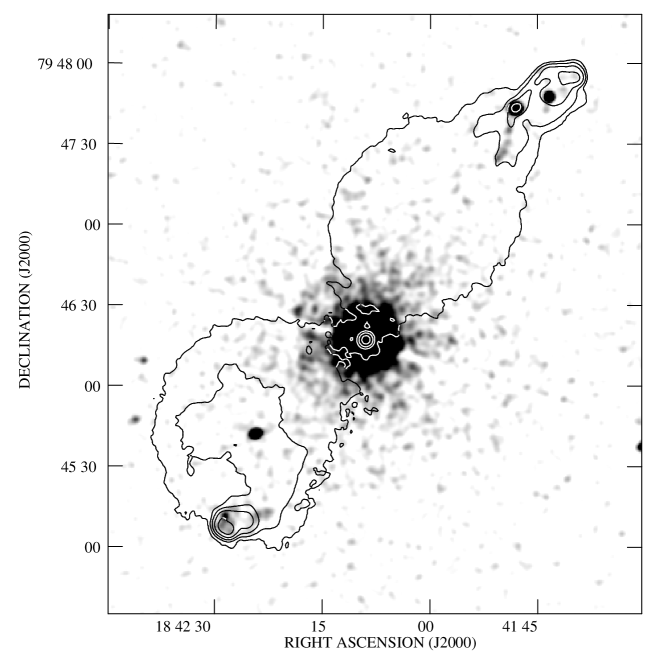
In addition to some short exploratory observations, Pic A has been observed three times with Chandra (see Table 1 for details). The first observation, reported by W01, was centred on the active nucleus, and the lobes span the ACIS-S2 and S3 chips; the pointing for the two later observations was close to the western hotspot, and much of the E lobe was undetectable, falling between the ACIS-S and I arrays, although a small part of the extreme eastern end falls on the ACIS-I3 chip (Fig. 1).
All three long observations were reprocessed from the level 1 events files using the latest version of ciao at the time of writing (3.2.1) and the corresponding caldb (3.0.1). The latest gain files were applied, the S4 chip destreaked, and the frame transfer streaks removed (without background replacement) using standard techniques detailed in the ciao on-line documentation111http://asc.harvard.edu/ciao/. For the first long observation there were some significant periods of high background, and so we filtered the data using the results of the analyze_ltcrv script, giving the effective live time listed in Table 1. For the other two observations we only applied the standard time filtering.
The spectral extractions described in the rest of the paper used the ciao script acisspec to extract spectra and suitably weighted response files for extended regions. For the 2002 observations we generated new response files using the mkacisrmf tools.
2.2 XMM-Newton
In order to confirm our Chandra results, and to extend the results of Grandi et al. (2003) to larger lobe regions comparable with our Chandra analysis, we extracted the archive XMM-Newton observation of Pictor A (obsID = 0090050701) described by Grandi et al. (2003). The observation, obtained on 2001 March 17, had a livetime of 20521 ks. The MOS cameras were in small-window mode, so that the lobe regions were not observed; we therefore used only the pn data. The data were reprocessed using the XMM-Newton SAS version 6.0.0, and the latest calibration files from the XMM-Newton website. The pn data were filtered to include only single and double events (PATTERN ), and the standard flag filter #XMMEA_EP (but excluding bad columns and rows). A histogram in the energy range 12.0 - 14.0 keV was used to look for background flaring. There was significant flaring activity throughout the observation, and so we excluded all periods with a count rate higher than 2 cts s-1, giving a filtered dataset of duration 10 062 s. This count level was chosen by eye so as to cut out the worst flares above the quiescent background ( cts s-1) while not excluding too large a fraction of the dataset. Grandi et al. did not gti-filter the data for their analysis, but we found that the filtering we applied did not significantly limit our scientific analysis.
2.3 Radio
For comparison between the radio and X-ray structures and analysis of the radio spectrum we use the radio data of Perley, Röser & Meisenheimer (1997: hereafter P97), kindly provided by Rick Perley. Maps at central frequencies of 327.5 MHz, 1.471 GHz and 4.847 GHz are used in the analysis – for simplicity in what follows we refer to these as the 330-MHz, 1.5-GHz and 4.8-GHz maps. The images we use are those in which P97 used a circular restoring beam.
| Date | OBSID | Pointing position | Livetime | Livetime after | |
|---|---|---|---|---|---|
| RA (h m s) | Dec (∘ ′ ′′) | (s) | filtering (s) | ||
| 2000 Jan 18 | 346 | 05:19:49.7 | 45:46:45.00 | 25737 | 25737 |
| 2002 Sep 17 | 3090 | 05:19:26.2 | 45:45:53.50 | 46959 | 36351 |
| 2002 Sep 22 | 4369 | 05:19:26.2 | 45:45:53.50 | 49126 | 49126 |
3 Results and interpretation
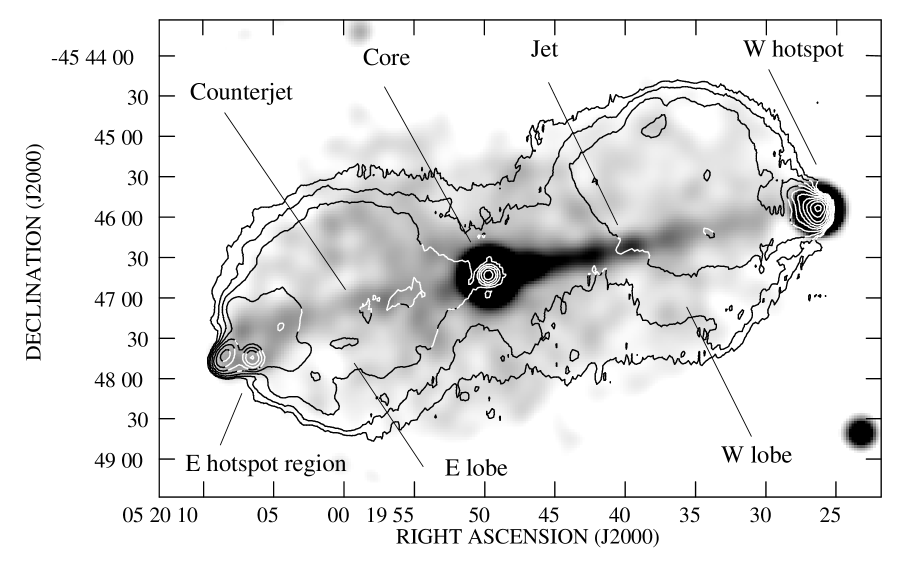
Fig. 2 shows the main features of the X-ray emission of Pic A that we wish to discuss in the remainder of the paper: to illustrate the quality of the spectra we obtain, net counts for the regions we discuss in the remainder of the section are tabulated in Table 2. The brightest compact feature apart from the core is the E hotspot: this has already been discussed by W01 and will be discussed in more detail elsewhere (Wilson et al., in prep.) and we do not consider it further here. The image in Fig. 2, as well as those of Fig. 1, clearly show the jet in the W lobe, which extends almost all the way to the hotspot, and also hint at a corresponding linear feature in the E lobe: we will briefly comment on the nature of the jet and discuss the possible counterjet in Section 3.5. On more extended scales, X-ray emission from the lobes and from a bright region around the E hotspot can clearly be seen. We discuss the nature of these in the following subsections.
| Source | Telescope | Epoch | Counts |
|---|---|---|---|
| Core | XMM | 2001 | |
| Jet | Chandra | 2000 | |
| 2002a | |||
| 2002b | |||
| Counterjet | Chandra | 2000 | |
| E hotspot | Chandra | 2000 | |
| E lobe | Chandra | 2000 | |
| XMM | 2001 | ||
| W lobe | Chandra | 2000 | |
| 2002a | |||
| 2002b | |||
| XMM | 2001 |
Net counts are tabulated in the range used for spectral fits, i.e. 0.4–7.0 keV for Chandra and 0.5–5.0 keV for XMM-Newton. Dates 2002a and b refer to obsids 3090 and 4369 respectively.
3.1 Integrated lobe properties
The first test of an inverse-Compton model for the lobes is the flux density and spectrum of their X-ray emission. Grandi et al. have already shown that the region around the E hotspot has a spectrum consistent with an IC model. We extracted spectra for the whole of the W lobe (visible in all three images) and the E lobe as seen in the 2000 images, where we used two extraction regions with two different backgrounds to take account of the different responses and background levels of the S2 and S3 chips. The extraction regions were ellipses defined to include the emission enclosed by the lowest contour of the 1.5-GHz radio map shown in Fig. 2; emission from the X-ray nucleus, jet, and hotspot, and several point sources in the lobes (but not the regions in the E lobe discussed in Sections 3.4 and 3.5) was excluded. Spectra and responses for off-source background regions were also generated. We then fitted spectra to the data in the energy range 0.4–7.0 keV. Spectral fits were carried out in two ways. Initially, we used simple background subtraction within xspec 11.3, grouping the spectra so that each bin contained net counts after background subtraction. Subsequently, we used the ability of sherpa to model source and background together222http://asc.harvard.edu/sherpa/threads/sourceandbg/index.html#indepinstresp, fitting the backgrounds with an ad hoc combination of mekal models, Gaussians, unabsorbed power laws and heavily absorbed power laws (the last component being intended to model the turnup in the background level at high energies). Neither of these two methods is perfect, as the instrumental background is a combination of internal/particle background (best dealt with by direct subtraction) and external, cosmic background (best dealt with by modelling the background taking into account the differing response). However, the results derived were almost indistinguishable within the errors, as shown in Table 3. In both cases we fitted three models: a pure power-law model, a pure thermal model (mekal with 0.5 solar abundance at the redshift of Pic A) and a combination of the two. In almost all cases the pure thermal model was the worst fit, and the combined model was the best, though in several cases the improvement over the pure power-law model was marginal: in the combined model the thermal component contributes only a small fraction of the total emission from the lobe, but the power-law index is made significantly flatter.
For the XMM-Newton data, we used extraction regions similar in size to those used for the Chandra analysis; however, due to the larger PSF, it was necessary to exclude larger regions for the core, jet and hotspot. Spectra were extracted for both lobes in the energy range 0.5–5.0 keV. Our lobe regions, corresponding to the extent of the low-frequency radio emission, are much larger than the region studied by Grandi et al., which means that our regions may include a significant contribution from the PSF wings of the central AGN. We therefore also extracted a spectrum for the core (using a circle of 2 arcmin) in order to to estimate its contribution to the lobe spectra. Pileup is not significant in the core. We fitted the core spectrum with a single power law, which gave a good fit (reduced ) with , consistent with the RXTE results of Eracleous, Sambruna & Mushotzky (2000). Our measured flux is a factor of below their value, but the AGN is likely to be highly variable. We then calculated the fraction of the AGN spectrum expected to have been scattered into the lobe regions. We found that the eastern lobe region should contain per cent of the total AGN emission, and the western lobe per cent, which is a significant fraction of the flux expected from the lobes based on the Chandra results. To account for this AGN component, we included a fixed power law component in our spectral fits with and a normalization obtained by scaling the normalization of the central AGN appropriately (energy-dependence of the PSF is not a complicating factor at these radii). In addition to this scattered-AGN component, we fitted a power-law model to the excess, lobe-related emission. For the eastern lobe, we obtained a good fit ( for 83 d.o.f.) with a photon index of , consistent with the Chandra results. For the western lobe, the best fit ( for 45 d.o.f.) had a photon index of , which is slightly higher than the Chandra results, but consistent within the errors with all but one of the single-component Chandra fits. We measured 1-keV flux densities of nJy (E) and nJy (W). As our extraction regions are significantly smaller than the Chandra regions due to the pn chip gaps and the larger jet and hotspot exclusion regions, we scaled these fluxes to account for this difference, and obtain scaled flux values of nJy (E) and nJy (W), which are both in good agreement with the Chandra results. For both lobes, using a mekal model resulted in a marginally worse fit, with temperatures of keV, inconsistent with the best-fitting thermal models from the Chandra analysis.
| Dataset/ | Pure power-law | Pure mekal | Power-law plus mekal | ||||||||
| Lobe/ | Flux | Photon | Norm. | Flux | Photon | Norm. | |||||
| Method | (nJy) | index | () | (keV) | (nJy) | index | () | (keV) | |||
| 2000/W/X | 51/46 | 67/46 | 47/44 | ||||||||
| 2000/W/S | 114/88 | 136/88 | 105/86 | ||||||||
| 2002/W/X | 145/128 | 166/128 | 130/126 | ||||||||
| All/W/X | 196/176 | 236/176 | 179/174 | ||||||||
| All/W/S | 414/359 | 456/359 | 392/357 | ||||||||
| 2000/E/X | 44/42 | 44/42 | 37/39 | ||||||||
| 2000/E/S | 87/75 | 88/75 | 83/72 | ||||||||
Fitting statistics and best-fitting parameters are shown. In the first column, the date refers to the Chandra dataset, with the two 2002 observations being treated as a single dataset. xspec fits are denoted with an X and sherpa fits using background response files are labelled with an S. For the sherpa fits, the fitting statistic includes the fit to the background. The errors quoted are the errors for one interesting parameter. 1-keV flux densities are derived from the power-law normalization: the mekal model normalization is the volume-normalized emission measure in standard xspec units (i.e. cm-5): an additional factor of is included for convenience of presentation. For the E lobe, two regions were used, as described in the text, and the best-fitting parameters presented are the results of joint fits, except for the fluxes and mekal normalizations, which are the sums of the normalizations of the two fitted models.
The available data thus strongly favour a non-thermal model. The Chandra-derived spectral indices () of the power laws are in the range 0.5–0.8, which is to first order consistent with the expectation from an IC model (see below), and also consistent with the power-law index measured by Grandi et al. (2003). The difference between the flux densities quoted by Grandi et al. (2003) ( nJy: their table 1) and ours ( nJy for the E lobe) can be explained entirely in terms of the small region of the E lobe that Grandi et al. considered, since our XMM analysis shows that the scaled fluxes are consistent. Our flux density and spectral index are also consistent with those quoted by Kataoka & Stawarz (2005) for the W lobe (derived from the 2000 dataset: Kataoka, priv. comm.).


We compare the X-ray observations to the predictions of an inverse-Compton model using the method outlined in Croston et al. (2005). In this case, since the integrated spectrum of the source is well known (P97) we model the electron spectrum to reproduce it in more detail than was possible in our earlier work: we assume a low-energy electron energy index of 2, as in Croston et al., and a break in energy index of 0.7 at to give the observed high-frequency synchrotron spectral index . The electron spectrum is normalized using the 1.5-GHz flux density measured from the maps of P97, using the same extraction region as was used for the X-ray data. The predicted 1-keV flux density for an equipartition magnetic field from inverse-Compton scattering of the CMB (synchrotron self-Compton emission is negligible) is then 14.5 nJy for the W lobe and 16.8 nJy for the E lobe. Fig. 3 shows the broad-band spectra of the lobes, the model synchrotron spectrum, and the predicted form of the inverse-Compton emission at equipartition.
Croston et al. define a parameter , the ratio between the observed X-ray flux density at 1 keV and the equipartition prediction: for the W and E lobes of Pic A is 3.8 and 3.3 respectively, if we take the X-ray flux densities derived from the pure power-law fits. (Note that since the E lobe flux density we quote is a slight underestimate, the value is also probably an underestimate.) These values of , while they lie at the higher end of the distribution discussed by Croston et al., are by no means extreme, and in fact lie close to the median values observed for broad-line objects. The values would be reduced (to 3.2 and 2.7) if we adopted the flux densities derived from the power law plus mekal models. As discussed by Croston et al., the true values for broad-line objects like Pic A should be lower, because of the effects of projection. Pic A’s axis should be at a relatively small angle to the line of sight, , in simple unified models for low-power FRII objects: Tingay et al. (2000) independently estimate from modelling of the parsec-scale jet, and significant projection is implied by the observed Laing-Garrington effect (P97). If Pic A lay at 30∘ to the line of sight, for example, then the true values would be a factor lower. Without invoking extreme projection there is no obvious way to reduce below 2 ( is the median value observed for narrow-line radio galaxies) and so if the observed X-ray emission is inverse-Compton it requires a magnetic field strength a factor at least below the equipartition value. This is in line with the results of Croston et al. and Kataoka & Stawarz (2005) and with previous studies of small numbers of objects (e.g. Hardcastle et al. 2002, Isobe et al. 2002, Belsole et al. 2004).
The inverse-Compton model predicts that the spectral index measured in the X-ray should reflect the low-energy electron energy index. In principle, therefore, the observed values (Table 3) can tell us something. In practice, the answer depends on the adopted model. Almost all the fitted power-laws have an energy index less than the high-frequency radio value (P97) of 0.85, and if the models containing thermal emission are adopted, the power-law indices are consistent with values in the range 0.5–0.6. The flatter X-ray spectral indices are consistent with the tentative observation by P97 of a low-frequency spectral flattening, and the lowest values would imply a low-energy electron energy index of 2–2.2, which is consistent with the predictions of simple shock acceleration models. However, we are reluctant to draw very strong conclusions from this result, since the inclusion of the thermal components in the model is by no means required by the fits (and the discrepant best-fitting temperatures in the models are a cause for concern). The predicted X-ray spectral index is also dependent on the position of the low-energy break in the electron energy index: if the break is at low enough energies, then the X-ray spectrum will steepen across the Chandra passband, and our calculations suggest that this may be the case in Pic A (this can be seen in Fig. 3), though the position of the low-energy break is not well constrained by the data. If the X-ray data for the W lobe are fitted with a broken power-law model (as a first approximation to the true shape of the inverse-Compton prediction), with the low-energy spectral index fixed to 0.5, then it is interesting, though of course not conclusive, that the best-fitting high-energy spectral index is , in excellent agreement with the observed high-frequency radio spectral index for the source.
Finally, it is worth noting the difference between the fitted X-ray spectral indices for the two lobes. The E lobe is flatter in all fits than the W lobe. This is in the opposite sense to the trend seen in the radio at higher frequencies (P97). We comment on this further below.
3.2 Lobe properties as a function of position
Fig. 2 shows that the surface brightness of the lobes in the X-ray is very much more uniform than in the radio. As an example of the surface brightness profile across the lobe, we show a slice taken from the W lobe between 80 and 125 arcsec from the core (i.e. roughly the broadest part of the lobe) in Fig. 4. Large variations in the radio surface brightness are not reflected in the X-ray data: the X-ray profile across the lobe is well modelled as a projection of a sphere or cylinder, while this is not at all the case in the radio.

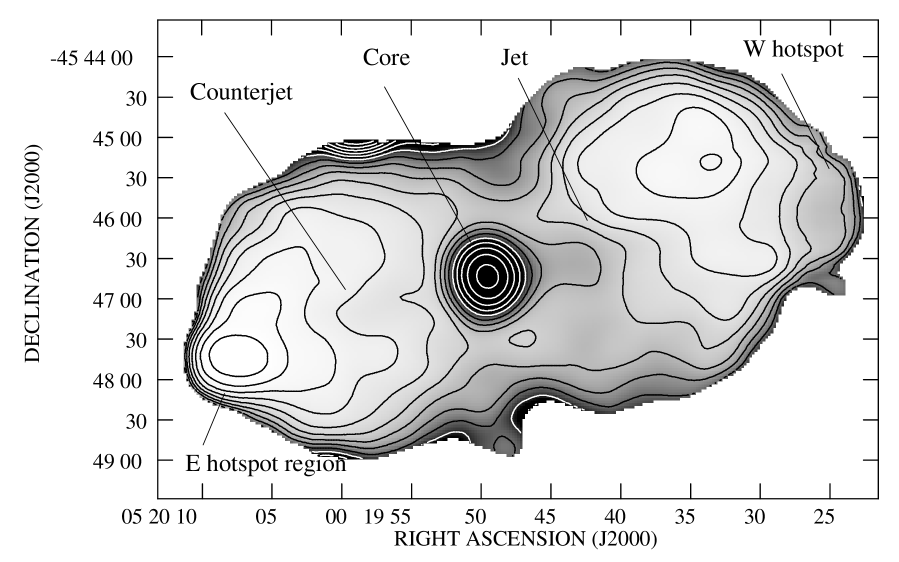
The high signal-to-noise of the X-ray data allows us to make a map of the X-ray/radio ratio. To do this we used the -arcsec resolution 330-MHz radio map of P97, as being the map (at useful angular resolution) that best traces the low-energy electrons, and convolved the exposure-corrected X-ray map from the 2000 Chandra observation to the same resolution. The ratio of these two maps is shown in Fig. 5 (very similar results are obtained using the 2002 data, but of course these show the W lobe region only). A number of interesting features can be seen here:
-
1.
The X-ray jet and W hotspot are clearly distinguished from the other regions of emission, as expected.
-
2.
The ‘counterjet’ region can also be seen (best seen as an indentation in the contours in the E lobe).
-
3.
Although the E hotspot region is visible as a high-surface brightness region in Fig. 2, its X-ray/radio ratio is actually lower than in the lobes as a whole.
-
4.
The X-ray/radio ratio in the lobes is higher (by a factor up to ) close to the nucleus relative to the value in the centre of the lobes.
-
5.
The X-ray/radio ratio is also higher at the very edges of the lobes.
We return to the jets and hotspots in later sections, but here we will focus on the explanation for the positional differences in X-ray/radio ratio in the lobes, which are reminiscent of the results obtained by Isobe et al. (2002) for 3C 452. For a constant magnetic field strength throughout the lobe, and a constant ratio between the number densities of the electron populations responsible for the synchrotron radiation and those responsible for the inverse-Compton emission, the X-ray/radio ratio should be constant across the lobe. There are thus at least three possible models for the observed spatial dependence of the ratio, which are not mutually exclusive:
-
1.
Some other emission process boosts the X-ray emission in the inner regions.
-
2.
The radio flux measurements under-represent the low-energy electrons in the central parts of the source relative to the outer parts.
-
3.
The magnetic field strength relative to the equipartition value is varying as a function of position, such that the inner lobes are more electron-dominated.
We now discuss each of these models in turn.
3.2.1 Additional emission components
Model (i) requires a plausible additional emission process. Two such processes are thermal emission and inverse-Compton scattering of nuclear photons (e.g. Brunetti et al. 1997). To test these models we need to see whether there are differences between the X-ray spectra of the inner and outer lobe regions. We extracted two matched spectral regions (circles of 50-arcsec radius) centred on the regions of high and low X-ray/radio ratio in the E lobe from the 2002 Chandra data. Each circular region represented slightly under a quarter of the total flux from the lobe. We fitted pure power-law models and power law plus mekal models to both datasets; as expected, both were good fits. The best-fitting power-law indices were different, but not significantly so ( for the region close to the core compared to for the region further out in the lobe) and although the best-fitting thermal component in the combined model (which gave flatter spectral indices, as expected) had a higher normalization in the inner extraction region, the power-law emission was still dominant, accounting for per cent of the flux. In the W lobe, as seen with the 2000 data, the situation is somewhat more extreme: examining separately the regions that lie on the S3 and S2 chips (which happen to correspond roughly to the regions of higher and lower X-ray to radio ratio) the best-fitting photon indices are respectively and , and a mekal model with plausible temperature in the S3 (central) region has negligible normalization.
The fits with thermal models imply that we can certainly rule out the model in which thermal emission dominates in the inner regions and accounts for the extra X-ray emission. A nuclear inverse-Compton model remains possible based on these spectral constraints, and the flatter spectra in the inner regions would be compatible with this if the low-energy electron spectrum flattens, since the electrons responsible for the scattering of nuclear photons have lower energies (and so presumably a flatter electron energy spectrum) than those scattering the CMB photons. However, for the nuclear photons to be comparable in energy density to the CMB at the distances we observe (up to around 80 arcsec in projection for the E lobe, or kpc) the nuclear luminosity in far-IR photons would have to be W, which seems high for Pic A (comparable to the bolometric luminosity of a luminous quasar). Moreover, we would expect a strong side-to-side asymmetry, in the sense that the counterjet-side lobe would be significantly (by a factor or more, assuming ) more dominated by nuclear emission, if the source is at the angles to the line of sight expected from unified models and the jet/counterjet asymmetry is due to beaming: in fact, if anything, the jet-side lobe has a larger region of high X-ray/radio ratio. Accordingly, we consider it unlikely that nuclear inverse-Compton emission is very important in this source, though it may make a contribution to the region of flatter X-ray spectrum in the inner part of the W lobe, and thus to the overall flatter X-ray spectrum of the W lobe discussed above.
3.2.2 Electron spectrum variation
If model (i) can be dismissed, we can consider explanations in which the X-ray emission is dominated by inverse-Compton scattering of the CMB, and is giving us information about a single low-energy electron population. Model (ii), in which it is positional differences in the electron spectrum that are responsible for the differences in X-ray/radio ratio, is favoured at first sight by the fact that the radio spectrum of the inner part of the lobes is steeper than the outer part even at the lowest frequencies (P97): in fact, the relatively X-ray bright inner parts and edges correlate extremely well with the steeper-spectrum ( rather than ) regions of the lobe shown in fig. 5 of P97. However, it is hard to explain the magnitude of the difference between the different regions of the lobes purely in terms of the changes in the electron spectrum implied by the differences in radio spectral index. Emission at 330 MHz traces electrons around , if the magnetic field implied by the inverse-Compton model for the whole lobe is adopted, while the inverse-Compton emission traces electrons around : thus, since critical frequency for synchrotron emission goes as , changes in X-ray/radio ratio of a factor 3 would require changes in the synchrotron spectral index between 10 MHz and 330 MHz across the lobe of , if magnetic field strength is held constant, which is greater than the observed change at higher frequencies. Even if we allow the magnetic field strength to take the equipartition value (taking into account the fact that a steeper spectrum also implies more low-energy electrons) a calculation using the inverse-Compton code produces similar conclusions – changes in the low-frequency spectral index of the magnitude observed in the low-frequency maps of P97 ought to produce at most a factor 2 difference in the X-ray-to-radio ratio for 330-MHz radio emission, which is somewhat less than what is observed. Only if there are more low-energy electrons than a simple extrapolation from higher frequency would predict can we explain the observed differences purely in terms of numbers of low-energy electrons in a homogenous model. However, this calculation of course assumes a single spectral index (and magnetic field strength) along the line of sight through the lobe region of interest, which is simplistic: the measured spectral index of the lowest- parts of the lobe is almost certainly an underestimate of the true lowest present, and so it seems plausible that more of the observed difference could be accounted for with a more detailed source model. A version of explanation (ii) may still be the correct one, even though we have not been able to contrive one that gives quantitatively correct answers.
3.2.3 Magnetic field variation
There is no a priori reason to reject explanation (iii), in which magnetic field varies as a function of position, and only modest changes in the ratio of actual to equipartition magnetic fields are needed to produce the observed differences – around a factor 1.5, if combined with the electron energy spectrum changes discussed above. This would imply that the magnetic field strengths overall are closer to equipartition in the parts of the lobes nearest the hotspots and fall below the equipartition values in the more distant (older?) parts of the lobe. The lower magnetic field reduces the synchrotron emissivity and so increases the X-ray/radio ratio; the low-energy electron population is essentially the same throughout the lobe, accounting for the relatively uniform inverse-Compton surface brightness (e.g. Fig. 4). Note that the X-ray observations, in this picture, are inconsistent with the models discussed by P97 in which the magnetic field strengths are higher at the periphery of the lobes.
It is interesting to ask whether explanation (iii) can also explain the correlation between high X-ray/radio ratio and steep radio spectrum without any need for electron population variations: is it possible that there is a single electron population throughout the lobe, and the changes in both radio surface brightness and spectral index are a result of varying magnetic field strength? Such a model is motivated by the results of Katz-Stone, Rudnick & Anderson (1993), which show that it is possible that a single electron energy spectrum describes all spectral regions of Cygnus A. We can test this model in Pic A if we assume (unrealistically) that the magnetic field along a given line of sight is constant: then (e.g. Longair 1994 eq. 18.50) if the electron energy spectrum at low energies is a power law with index , the magnetic field strength is proportional to the X-ray/radio ratio to the power . (The number density of electrons along the line of sight has been cancelled by dividing through by the X-ray surface brightness.) The observed changes in X-ray/radio ratio of a factor 3 thus should correspond to magnetic field changes of at most a factor 2 (depending on the choice of , but assuming ) so that, as critical frequency for a given electron energy goes as , the low-frequency () spectral indices we observe in the regions of highest X-ray/radio ratio would correspond to in the regions of lowest X-ray/radio ratio. As we know from the maps of P97 that in the high-surface-brightness regions of the lobe is , this model does not seem to be viable: we need larger variations in the magnetic field strength than are implied by the range of X-ray to radio surface brightness to shift steep-spectrum material into the low-frequency band.
Another way of visualising the problem is provided by point-to-point radio spectral analysis of the type carried out by Katz-Stone et al., and we show this in Fig. 6: although the colour-colour plot is consistent with the findings of Katz-Stone et al. for Cygnus A, an attempt to ‘correct’ each point using the X-ray/radio ratio to the expected spectrum for a fixed magnetic field strength does not produce a uniform spectrum.
3.2.4 Summary of lobe models
We find no evidence for additional emission components in the high X-ray/radio ratio regions of Pic A (model (i)) and so consider models in which Fig. 5 is telling us about real differences in lobe inverse-Compton emissivity. Our discussion of model (iii) shows that magnetic field strength changes can easily account for the X-ray/radio differences, but that there is genuine variation in the point-to-point properties of the high-energy end of the electron spectrum in Pic A; on the other hand, our discussion of model (ii) suggests that the electron energy spectrum differences cannot in themselves account for the observations if the spectrum is conventionally shaped (flatter at lower energies). Our favoured model is thus a combination of (ii) and (iii): both the electron energy spectrum and the magnetic field vary as a function of position in the lobe, with the magnetic field being somewhat weaker, and the electron energy spectrum more depleted of high-energy electrons, as a function of distance from the hotspot. Such a model can explain both the observed changes in spectral index and X-ray/radio ratio.
Finally we emphasise that the diagnostics we have used, which make use of two-dimensional projected quantities, are probably a crude representation of the true three-dimensional variation of physical conditions inside the source. Fully modelling Pic A in three dimensions would involve many assumptions, given the lack of symmetry in the source, and we have not attempted to do so. We have, however, made simple three-dimensional models treating the source as a uniformly filled sphere of electrons (this seems reasonable given the results shown in Fig. 4) with radial variation in magnetic field and using realistic electron energy spectra. This allows us to discard the assumption of a single magnetic field strength along the line of sight. These models give very similar results to our conclusion above with respect to model (iii): models that can reproduce the magnitude of the X-ray/radio ratio variation across the source purely in terms of a variation of the magnetic field strength also produce a much greater range of spectral indices (and in particular much steeper high-frequency spectral indices) than are observed in the data.


3.3 Lobe dynamics and depolarization
If we adopt the magnetic field strengths determined above for the whole lobe, then the internal pressure in the lobes is of the order Pa (somewhat less if projection is important). The pressure of any external environment must be less than or equal to this value unless there is a significant contribution to the internal energy density from other sources, such as protons. This implies a local environment comparable to, at most, a moderately rich group of galaxies, a conclusion consistent with the low temperatures found in the joint power-law/mekal fits to the lobes and with the results of Miller et al. (1999). We do not find either the Chandra nor XMM-Newton data to show any convincing evidence for a spatial detection of thermal emission on the scales of the lobes: this is not surprising, as the surface brightness of such emission would be low. Grandi et al. (2003) suggest that there may be some extended thermal emission in the central arcmin of the source, but we see no strong evidence for this in the Chandra data.
Can a poor thermal environment such as this provide the increased dispersion in the rotation measure (RM) on the counterjet side required to produce the observed low-frequency depolarization of the counterjet lobe? This question may be ill-posed – P97 suggest that the excess RM dispersion they observe is not enough to produce all the depolarization, so that the Faraday screen may not be fully resolved by their observations. Setting that aside, we can make a very crude estimate of the required properties of the medium by assuming that the density of the medium along the additional path between the jet and counterjet-side lobes is such as to give Pa for keV, i.e. m-3. If we take the scale of the RM variations to be arcsec (P97), or 7 kpc, which is similar to what is observed in other sources, then the projected magnetic field strength in the thermal environment required to produce the excess RM dispersion is of the order 0.04 nT, corresponding to a magnetic field energy density significantly less than the thermal energy density. Thus there is no difficulty in principle in producing the observed depolarization properties if the lobe is close to pressure balance with the external medium: the magnetic field energy density would start to be comparable to the thermal energy density, making such a model difficult to sustain, only if the external thermal density were about an order of magnitude lower than our estimate.
3.4 The E hotspot region
Although, as discussed above, the X-ray/radio ratio for the E hotspot is lower than elsewhere in the source, this does not necessarily imply a low value. To investigate the nature of the E hotspot region in more detail we extracted a spectrum from the 2000 dataset from the region corresponding to the region of higher radio and X-ray surface brightness seen in Fig. 2, using an elliptical extraction region with major axis 40 arcsec and minor axis 23 arcsec, and taking background from an adjacent identical region in the lobe. We fitted a power-law model to the region, obtaining a spectral index of and a total flux density of nJy. As shown in the spectral index maps of P97, this region is relatively flat-spectrum, and we modelled the radio data at 330 MHz, 1.5 and 4.8 GHz with a standard continuous injection model (Heavens & Meisenheimer 1987) with a low-energy electron energy index of 2 () which provides a good fit to the data with an electron energy break around , using an ellipsoidal volume for the region. In this model, the expected inverse-Compton flux density from the region at equipartition is 0.64 nJy, so that the value for the hotspot is around 9, much higher than that for the lobes as a whole. In terms of the X-ray/radio maps of Fig. 5, this illustrates the importance of taking into account the geometry of the region when converting between ratio and value.
There are two possible explanations for the high value in the E hotspot region: either the emission process is inverse-Compton, but the magnetic field strength is lower relative to the equipartition value than in the rest of the lobe, or else a second emission process is operating in the region around the hotspot. There is no evidence for thermal emission in the spectrum (mekal models give a high temperature and a poorer fit), but the poorly constrained spectral index is consistent with either an inverse-Compton or a synchrotron model. An interesting question is therefore whether synchrotron emission from the hotspot region can have an effect. To produce the observed value, the synchrotron emission would have to be about twice as bright as inverse-Compton from the same region. Synchrotron emission probably dominates the W hotspot (W01) but the X-ray emission from the E hotspot is not associated with any of the compact components of radio emission seen in the images of P97, whereas there is very good agreement between the bright, compact radio and X-ray structures in the W hotspot. The spectral index in the hotspot region between 5-GHz radio and X-ray is 1.1, which is entirely consistent with a synchrotron model. If the X-ray emission in the E hotspot were synchrotron in origin, there would have to be distributed particle acceleration over a 50-kpc region without obvious radio counterparts for particle acceleration sites: however, distributed particle acceleration on comparable scales is possible in the jets of low-power FRI sources (e.g. Evans et al. 2005) and even in the W hotspot a simple model involving particle acceleration at a single point is inconsistent with observations of the optical filament (P97). At the time of writing we know of two other sources that show anomalously bright diffuse X-ray emission, extended over several kpc and not primarily associated with compact radio features, near one hotspot complex: the W hotspot region of 3C 403 (Kraft et al. 2005) and the S hotspots of 3C 390.3 (Hardcastle et al. 2004: Fig. 7). As these two are both, like Pic A, low-power FRII sources with bright, almost certainly synchrotron X-ray hotspots and jets in their other lobes, the association between synchrotron emission and diffuse hotspot-associated emission of the type seen in Pic A East seems strong, and leads us to believe that the diffuse emission is most likely also synchrotron in origin. If the conclusions of Hardcastle et al. (2004) are correct, this sort of diffuse emission would be expected to be seen only in low-luminosity sources like Pic A. It is not at all clear why this type of feature should be seen only on the counterjet side of the sources in which it is detected, but only a few FRII sources of comparable luminosity have been observed at the time of writing, and it may be that this apparent trend (which would be difficult to explain in the context of unified models in which one-sided jets are an indication of beaming) will disappear with better statistics. One possible explanation is that modestly relativistic speeds persist in the backflow beyond the compact hotspots: Doppler boosting effects would then suppress X-ray emission on the jet side and enhance it on the counterjet side. A quantitative test of this idea must await the detection of more low-luminosity X-ray hotspots.
3.5 The counterjet
W01 discuss synchrotron and beamed inverse-Compton models for the bright jet seen in their images. We will not discuss the jet as seen in the 2002 data in great detail here, as it will be the subject of other work (Wilson et al. in prep.). Here we note only that the X-ray spectrum of the jet in the 2002 data is well-constrained and steep. We extract a spectrum from the narrow region of the jet, within 2 arcmin of the nucleus, using adjacent matching rectangular background regions, and find that the best-fitting power-law model (with fixed Galactic absorption, as in our other fits) has a photon index of . The 1-keV flux density in this extraction region is nJy. This steep spectrum, if we accept an inverse-Compton model for the lobes, makes a beamed inverse-Compton model for the jet very hard to accept, as it requires the low-energy electron population in the jet to have an energy index significantly steeper than that in the lobes. On the other hand, the radio and X-ray properties of the jet region can be well described by a standard continuous-injection synchrotron model, with a spectral break at a few Hz. Other factors that seem to us to strongly favour a synchrotron model are the knotty nature of the X-ray jet, which cannot be well explained in an inverse-Compton model (e.g. Tavecchio, Ghisellini & Celotti 2003) and the fact that its X-ray surface brightness drops markedly as it enters the high radio-surface-brightness region of the lobe (Fig. 2), which can be explained in terms of the efficiency of high-energy particle acceleration in a synchrotron model, but is hard to explain in terms of the low-energy electrons that would be responsible for the beamed inverse-Compton model.
A counterjet detection would completely rule out a simple beamed inverse-Compton model, since the predicted jet-counterjet asymmetry in such models is very high. The evidence for a counterjet is not strong: the most convincing region, between about 1 and 2 arcmin from the core (Fig. 2) contains only about counts in the 2000 image, or nJy. This would imply a jet-counterjet ratio at this distance from the core around , using a matched region to measure the corresponding flux density from the jet. Such a jet-counterjet ratio is easy to produce with plausible angles to the line of sight () and moderate speeds () in a synchrotron model, but the inverse-Compton models require and (for bulk Lorentz factor ) and for these beaming values the counterjet flux is expected to be three orders of magnitude below the best estimate of the observed value. Thus, if the counterjet detection is real, a beamed inverse-Compton model for the jet is only viable if there is also some X-ray synchrotron radiation from a slow-moving jet region.
4 Summary and conclusions
We confirm that the X-ray emission from the lobes of Pic A is most likely to be due to inverse-Compton scattering of CMB photons, as found by other workers (Grandi et al. 2003, Kataoka & Stawarz 2005); the magnetic field strength in the lobes as a whole is inferred to be a factor 1.6–2 below the equipartition value, as seen in other sources (Croston et al. 2005 and references therein). The inferred internal pressure implies an external thermal environment no richer than a moderate group of galaxies, but this is still consistent with the observations of Faraday depolarization in the lobes (P97).
The large number of counts in the Pic A lobes has allowed us to carry out a detailed comparison between the radio and X-ray emission. We find that there are significant differences even at the lowest frequencies currently accessible; in particular, the inner regions of the lobes are fainter in the 330-MHz radio while retaining much the same surface brightness in the X-ray, so that the X-ray/radio ratio is higher in the inner regions, which also have steep radio spectra. X-ray spectral fitting allows us to rule out a significant contribution from extended thermal emission to the X-rays emission in the inner regions, and nuclear inverse-Compton emission seems unlikely to be very significant. Simple models in which either the electron energy spectrum or the magnetic field strength vary as a function of position in the lobes cannot explain all the observations in the radio and X-ray, but models in which both vary together as a function of position can be made consistent with the data. The observations by Isobe et al. (2002) of 3C 452, which also show an increasing X-ray to radio ratio in the centre of the source, provide some evidence that these conclusions can be generalized to the population of FRII sources as a whole. More deep observations of radio-bright FRII sources are required to test this.
The region of comparatively bright X-ray emission around the E hotspot complex (Fig. 2) would require a much lower magnetic field strength relative to the equipartition value if it were to be explained by inverse-Compton emission from the hotspot region. Instead we suggest that this, and similar X-ray emission from regions around the hotspots of two other low-luminosity FRII radio sources, may be X-ray synchrotron emission, implying distributed high-energy particle acceleration in this part of the source.
There is already considerable evidence that the bright jet in the W lobe is synchrotron in origin: the possible detection of counterjet-related emission in the E lobe, if real, would rule out a simple beamed inverse-Compton model for the jet. Unfortunately the signal to noise in the counterjet region is not good enough for us to claim a firm detection, but nevertheless our work supports the idea put forward elsewhere (e.g. Kraft et al. 2005) that X-ray synchrotron is a viable mechanism for emission from FRII jets in general.
Acknowledgements
We are grateful to Andrew Wilson for discussion of Pic A and Rick Perley for providing the radio maps of the source in electronic form. We thank an anonymous referee for comments which helped us to improve the paper. MJH thanks the Royal Society for a research fellowship. The National Radio Astronomy Observatory is a facility of the National Science Foundation operated under cooperative agreement by Associated Universities, Inc. This work is partly based on observations obtained with XMM-Newton, an ESA science mission with instruments and contributions directly funded by ESA Member States and NASA.
References
- [] Belsole, E., Worrall, D.M., Hardcastle, M.J., Birkinshaw, M., Lawrence, C.R., 2004, MNRAS, 352, 924
- [] Brunetti, G., Setti, G., Comastri, A., 1997, A&A, 325, 898
- [] Croston, J.H., Birkinshaw, M., Hardcastle, M.J., Worrall, D.M., 2004, MNRAS, 353, 879
- [] Croston, J.H., Hardcastle, M.J., Harris, D.E., Belsole, E., Birkinshaw, M., Worrall, D.M., 2005, ApJ in press
- [] Eracleous, M., Sambruna, R., Mushotzky, R.F., 2000, ApJ, 537, 654
- [] Evans, D.A., Hardcastle, M.J., Croston, J.H., Worrall, D.M., Birkinshaw, M., 2005, MNRAS, 359, 363
- [] Fanaroff, B.L., Riley, J.M., 1974, MNRAS, 167, 31P
- [] Feigelson, E.D., Laurent-Muehleisen, S.A., Kollgaard, R.I., Fomalont, E., 1995, ApJ, 449, L149
- [] Grandi, P., Guinazzi, M., Maraschi, L., Morganti, R., Fusco-Femiano, R., Fiocchi, M., Ballo, L., Tavecchio, F., 2003, ApJ, 586, 123
- [] Hardcastle, M.J., Birkinshaw, M., Cameron, R., Harris, D.E., Looney, L.W., Worrall, D.M., 2002, ApJ, 581, 948
- [] Hardcastle, M.J., Harris, D.E., Worrall, D.M., Birkinshaw, M., 2004, ApJ, 612, 729
- [] Harris, D.E., 2004, To appear in the proceedings of the workshop: ”Science with Wavelengths on Human Scales” (Santa Fe, NM; 8-11 Sep. 2004) (astro-ph/0410485)
- [] Heavens, A.F., Meisenheimer, K., 1987, MNRAS, 225, 335
- [] Isobe, N., Tashiro, M., Makishima, K., Iyomoto, N., Suzuki, M., Murakami, M.M., Mori, M., Abe, K., 2002, ApJ, 580, L111
- [] Isobe, N., Makishima, K., Tashiro, M., Hong, S., 2005, ApJ in press, astro-ph/0506682
- [] Kaneda, H., et al., 1995, ApJ, 453, L13
- [] Kataoka, J., Stawarz, L., 2005, ApJ, 622, 797
- [] Katz-Stone, D.M., Rudnick, L., Anderson, M.C., 1993, ApJ, 407, 549
- [] Kraft, R.P., Hardcastle, M.J., Worrall, D.M., Murray, S.S., 2005, ApJ, 622, 149
- [] Leahy, J.P., Perley, R.A., 1991, AJ, 102, 537
- [] Longair, M.S., 1994, High energy astrophysics, Cambridge University Press, Cambridge
- [] Miller, N.A., Owen, F.N., Burns, J.O., Ledlow, M.J., Voges, W., 1999, AJ, 118, 1988
- [] Nulsen, P.E.J., Hambrick, D.C., McNamara, B.R., Rafferty, D., Bîrzan, L., Wise, M.W., David, L.P., 2005, ApJ, 625, L9
- [] Perley, R.A., Röser, H.-J., Meisenheimer, K., 1997, A&A, 328, 12 [P97]
- [] Robertson, J.G., 1973, Aust.J.Phys 26 403
- [] Simkin, S.M., Sadler, E.M., Sault, R., Tingay, S.J., Callcut, J., 1999, ApJS, 123, 447
- [] Tashiro, M., et al., 1998, ApJ, 499, 713
- [] Tashiro, M., Makishima, K., Iyomoto, N., Isobe, N., Kaneda, H., 2001, ApJ, 546, L19
- [] Tavecchio, F., Ghisellini, G., Celotti, A., 2003, A&A, 403, 83
- [] Tingay, S.J., et al., 2000, AJ, 119, 1695
- [] Wilson, A.S., Young, A.J., Shopbell, P.L., 2001, ApJ, 547, 740 [W01]