The ‘Hubble–type’ outflows from the high excitation, poly–polar planetary nebula NGC 6302.
Abstract
Spatially resolved profiles of the H and [N ii] lines have been obtained at unprecendented signal–to–noise ratios over the outflowing lobes of the high–excitation, poly–polar planetary nebula NGC 6302. A deep image in the light of [N ii] 6584 Å was also obtained of the extremities of the prominent north–western lobe. The Manchester Echelle spectrometer combined with the 2.1–m San Pedro Martir telescope (Mexico) was used for these observations.
Firstly, an accurate value of the systemic heliocentric radial velocity of = -29.8 1 km s-1 has been established. Also, from ‘velocity ellipses’ across its diameter from previous observations the parallel–sided north–western lobe is shown to have a circular section with a tilt of its axis to the plane of the sky of 12.8 deg. With this starting point the pv arrays of profiles have been very closely simulated, using the SHAPE code, with Hubble-type outflows. The faint extremities of the north–western outflow are shown to be expanding at 600 km s-1. The prominent lobes of NGC 6302 have then been generated in an eruptive event with a dynamical age of 1900 y for the expansion proper-motion distance of 1.04 0.16 kpc as measured here by comparing a 1956 image with that taken in 2002.
Kinematical evidence of a high–speed ‘skirt’ around the nebular core, expanding nearly orthogonally to the lobes, is also presented as are the unusual motions at the western extremities of the NW lobe.
1 Introduction
NGC 6302 (PN G349.5+01.0) is a poly-polar planetary nebula (PN), which was described and drawn as early as 1907 by Barnard. The many estimations of distance to NGC 6302 range from 0.15 to 2.4 kpc though Gómez et al (1989), from a radio expansion proper motion measurement of the bright nebular core give a firm lower limit to the distance of 0.8 0.3 kpc (see Sect. 3.3) and give a distance of 2.2 1.1 kpc from measurements of the pressure broadening of radio recombination lines.
The complex morphology of NGC 6302 is clearly evident in the photography of Evans (1959) and Minkowski & Johnson (1967); it is approximately bipolar consisting of two principle lobes. A dark lane covers the waist of the nebula and has prevented the optical detection of the central stellar system. This dark lane has been observed in H i absorption and is bright in a wide range of emissions i.e. PAH, free-free radio, Black Body infra-red and microwave, H i, H2 etc. (Rodriguez et al 1985; Matsuura, 2005). A massive (0.5 – 3 ) toroid of material must surround and obscure (AV = 5 – 7 mag) the central star with the line and free-free emission coming from close to the star and the neutral dusty material causing H i and optical absorption further out. Rodriguez (1985) also argue for the existence of an extended neutral hydrogen halo surrounding NGC 6302.
Feibelman (2001) suggests that the ultra-violet IUE continuum spectrum, uncorrected for interstellar extinction, indicates that the central O vi–Type White Dwarf has a G–Type companion. However, although Barral et al (1982) detect the same continuum in their own IUE spectrum, they conclude, after correction for logarithmic interstellar extinction coefficients of c between 1.0 and 1.59, that it is scattered radiation from the hot star. However a symbiotic status remains possible when compared with the similar, though lower excitation, nebula Menzel 3 (Mz–3, Bains et al 2004; Schmeja & Kimeswenger 2001).
A large range of ionization energies is present in the extended lobes of the nebula. Optical and infrared (IR) line emission has been observed from neutral species such as [O i], through ionized species such as H, [N ii], up to [O iii], He ii, [Ne v] and even as high as [Si vii] (Meaburn & Walsh 1980b; Pottasch et al 1985; Ashley & Hyland 1988; Feibelman 2001): in fact NGC 6302 is one of the highest excitation class of planetary nebulae (PNe) known. As a result, if the nebula is being photoionized by the obscured central star, the star must be extremely hot ( K e.g. Pottasch et al 1985; Ashley & Hyland 1988; Cassasus, Roche & Barlow 2000). A stellar wind (Meaburn & Walsh 1980a) could instead be shock-exciting the surrounding gas, but Barral et al (1982) have concluded that radiative ionization is almost certainly predominant, due to NGC 6302’s close spectral similarity to other radiatively-ionized, high-excitation PNe. The 800 km s-1 broad wings (Meaburn & Walsh 1980a) to the [Ne v] 3426 Å line profiles were originally considered to be direct manifestations of this particle wind: Barral et al (1982) demonstrate that this is improbable and their origin by electron scattering or even as instrumental artefacts should be considered. Feibelman (2001) though identify some very high excitation, coronal–type, spectral features that cannot be produced by radiative ionization by the central star and propose that shocks must play a part in their generation. The detection of centrosymmetric polarization of the nebular radiation (King et al 1985) suggests that the bright core light is being scattered by the dust content of the outflowing lobes.
The density sensitive [Ar iv] 4711, 4740 Å intensity ratio gives an electron density ne 80,000 cm-3 immediately adjacent to the dark waist and other density sensitive ratios, that work in less dense regimes, show that ne falls to 1000 cm-3 in the extended lobes of NGC 6302 (Barral et al, 1982). Meaburn & Walsh (1980b) though identify a knot in the extemities of the western lobe (Knot 1 in Fig. 2 b) which has ne 3000 cm-3.
The electron temperature of the nebula adjacent to the dark waist itself has been estimated a number of times using diagnostic spectral line intensity ratios. Oliver & Aller (1969) found temperatures in the range 15,200 K to 22,000 K at various points over the two principle inner lobes. Danziger et al (1973) found a temperature of 17,400 K from the IR continuum emission. Aller et al (1981) observed this brightest portion of the nebula and adopted 16,400 K after they found that a number of nebular line diagnostics converge on this value. These high temperatures (10,000 K is usually anticipated for ionised circumstellar gas) are consistent with 20,400 4000 K derived from the relative widths of the H and [N ii] 6584 Å emission line profiles (Barral et al 1982).
Evans (1959) initially suggested that the form of NGC 6302 suggests dynamic interaction with the ambient medium and the kinematics were first investigated by Minkowski & Johnson (1967), who found clear line-splitting in the lobes: it was immediately obvious that NGC 6302 is not undergoing spherically-symmetric expansion. Minkowski & Johnson (1967) and Elliott & Meaburn (1977) showed that the expansion in the inner lobes, in particular their neutral [O i] 6300 Å emitting component, is superimposed upon a velocity gradient across NGC 6302. The kinematics of the nebula were first thoroughly investigated by Meaburn & Walsh (1980b) using longslit spectroscopy. The distribution of radial velocities was found to be consistent with the existence of a number of cavities flowing out from the center of the nebular waist, hence the poly-polar description of the nebula. The dominant ‘closed’ cavity is to the NW though nebular emission certainly extends in this direction much further than suggested in the previous imagery. Early indications were found by Meaburn & Walsh (1980b) that the kinematics and morphology of this extreme region are not easily explicable within a closed lobe model with simple outflowing walls; consequently, new very deep, spatially resolved position-velocity (pv) arrays of profiles of the [N ii] 6584 Å nebular emission line over NGC 6302 have been obtained . These new observations have taken advantage of the technical improvements in the 25 years since those of Meaburn & Walsh (1980b) not least a CCD replacing the earlier photon counting detector, the use of an echelle grating in the spectrometer along with up-to-date displays of the data.
In these most recent observations particular, though not exclusive, attention has been paid to this far tip of the north-western lobe. A deep [N ii] 6584 Å image has been obtained to highlight the further extension of this part of the nebula. Morphological and kinematical modelling has also been performed to elucidate more clearly the stucture and motions of these nebular lobes. A firm expansion proper motion distance has been established by comparing a 1956 image of Evans (1959) with the most recent one obtained in the present work.
2 Observations and results
The present observations were made with the Manchester Echelle Spectrometer (MES-SPM - see Meaburn et al. 1984; 2003) combined with the 2.1-m San Pedro Martir telescope on 2001 17/18 May and 2002, 10/12 May. A SITe CCD was the detector with 10241024, 24 m pixels although 22 binning was employed throughout the observations.
2.1 Imagery
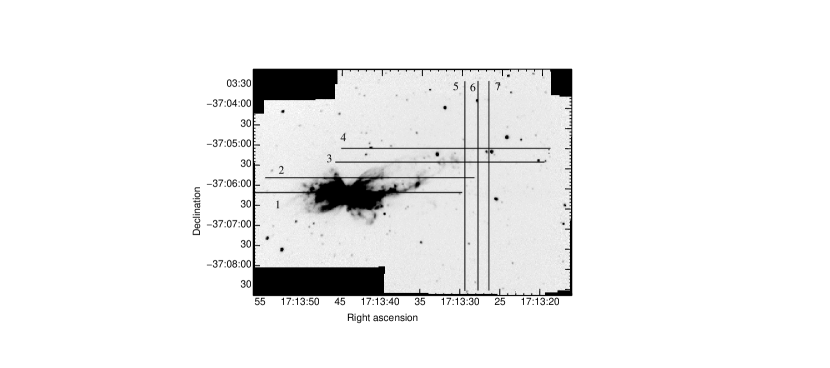
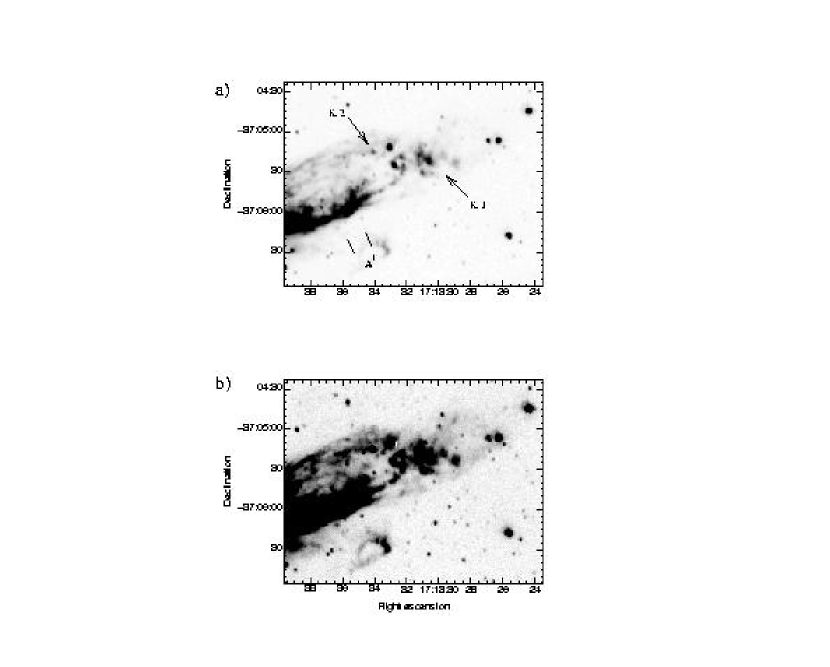
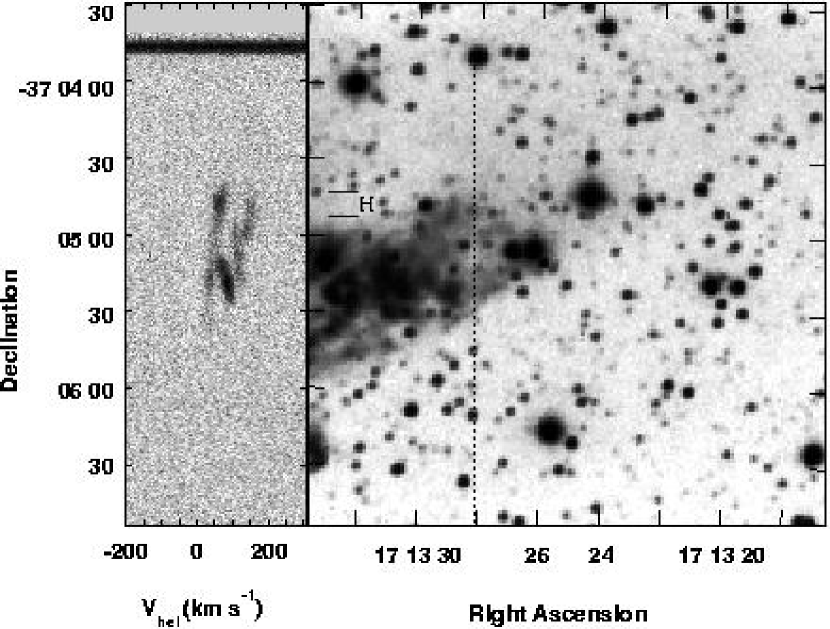
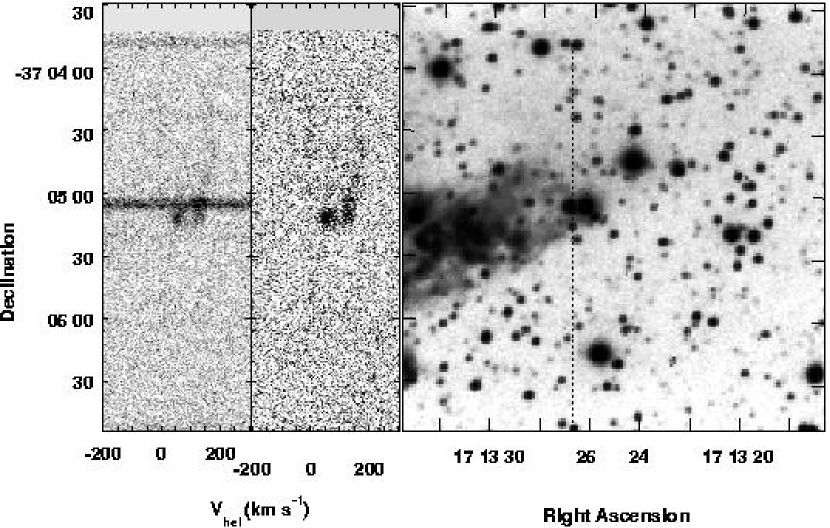
MES-SPM has a limited imaging capability with a retractable plane mirror isolating the echelle grating and a clear area (here 4.375.32 arcmin2) replacing the spectrometer slit. The image in Fig. 1 is a mosaic of those snapshot images through the 90 Å bandwidth H[N ii] interference filter taken immediately before obtaining spatially resolved longslit spectra of these lines (see Sect. 2.2). Whereas the image in Figs. 2a & b is a subset from this larger field obtained on the 2002, 12 May with this MES–SPM imaging configuration but covering only the western lobe of NGC 6302. The integration time was 900s. The coordinates (J2000) were added using the STARLINK gaia software. The 10Å bandwidth interference filter that was employed transmits only the [N ii] 6548 Å emission line.
2.2 Longslit spectroscopy
Spatially resolved, longslit line profiles were obtained with the MES–SPM along the lines marked 1–7 in Fig. 1. The details of all spectroscopic observations are listed in Table 1. In this spectroscopic mode MES–SPM has no cross–dispersion consequently, for the present observations, a filter of 90 Å bandwidth was used to isolate the 87th echelle order containing the H and [N ii] 6548, 6584 Å nebular emission lines.
| Slit Position | Slit Orientation | Slit Width (m) | Exposure Time (s) |
|---|---|---|---|
| 1 | EW | 150 | 300 |
| 2 | EW | 150 | 1200 |
| 3 | EW | 150 | 1800 |
| 4 | EW | 150 | 1800+2400 |
| 5 | NS | 300 | |
| 6 | NS | 300 | |
| 7 | NS | 300 |
The 512 increments, each 0.624″ long, give a total projected slit length of 532 on the sky. ‘Seeing’ was always ″ during these observations. A 150 m wide ( and 1.9″) slit was employed for the brighter nebulosity nearer the nebular core. For the spectrometry of the faintest but high–speed gas this slit was changed to one which is 300 m wide ( and 3.8″) to achieve sufficient signal to noise ratio though at the expense of spectral resolution.
The spectral data were bias corrected, cleaned, etc. in the usual way using the STARLINK figaro and kappa software packages. All spectra were calibrated in heliocentric radial velocity () to 1 accuracy against the spectrum of a thorium/argon lamp.
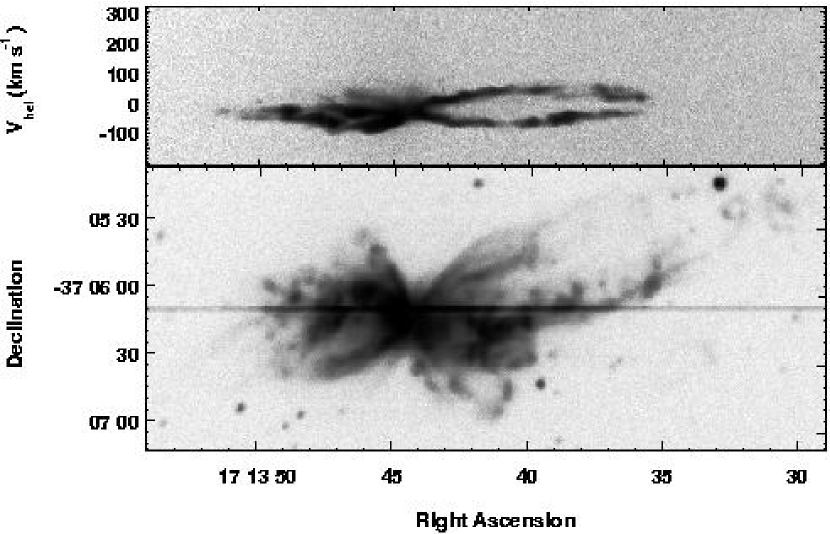
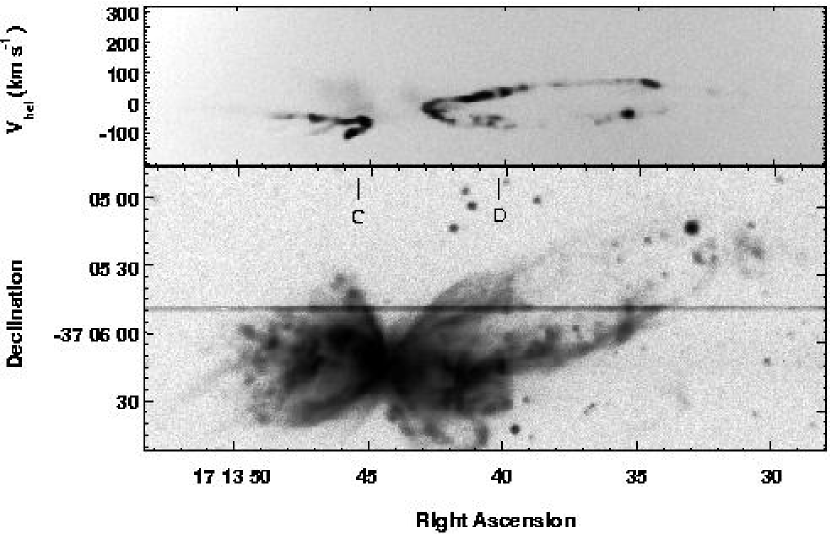
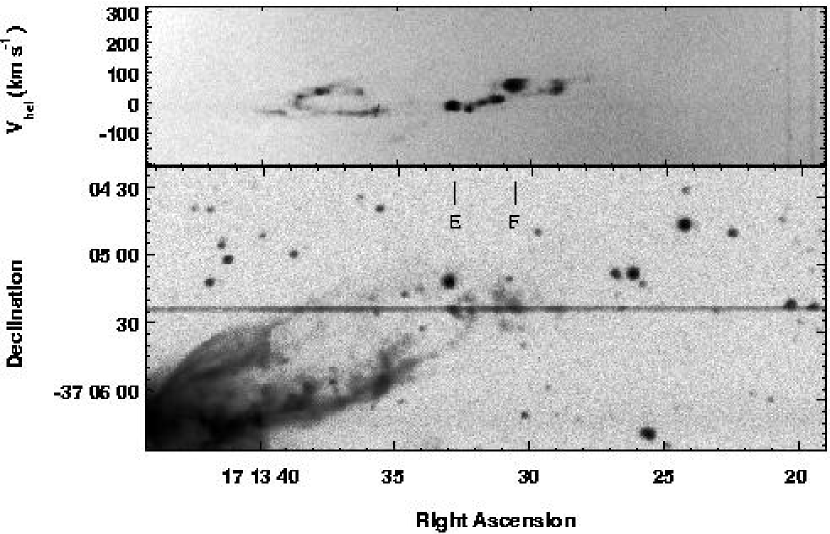
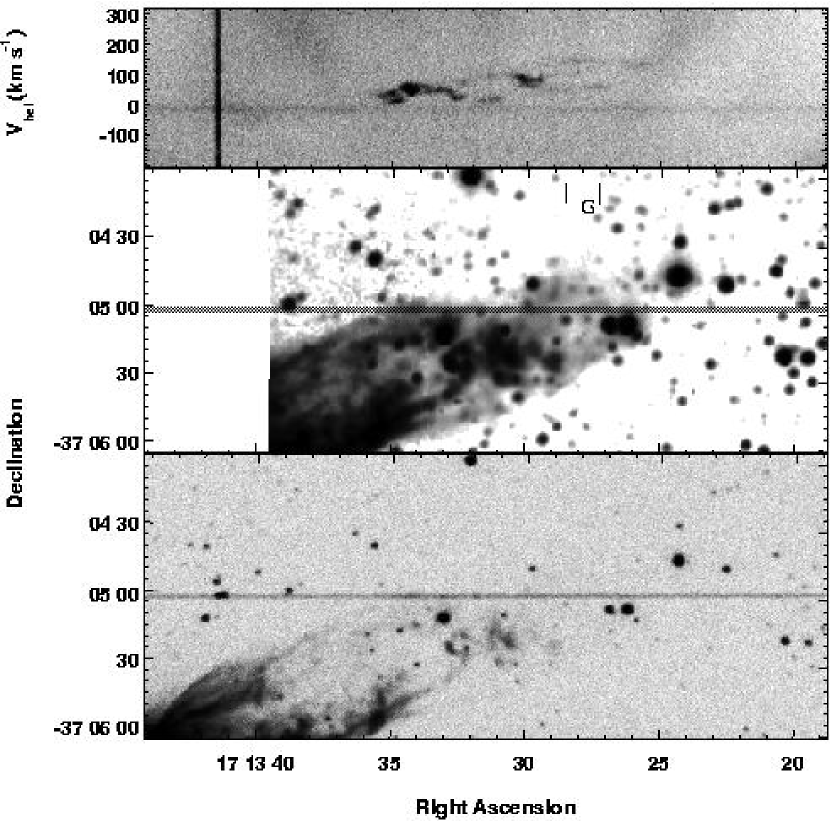
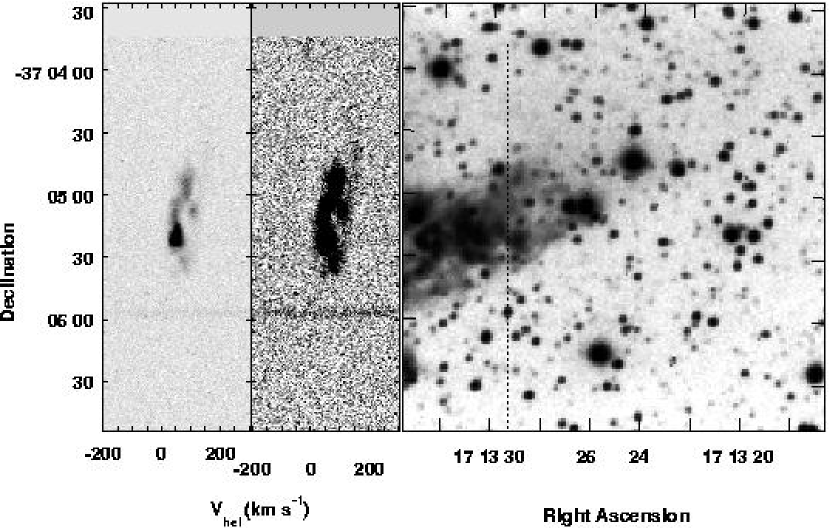
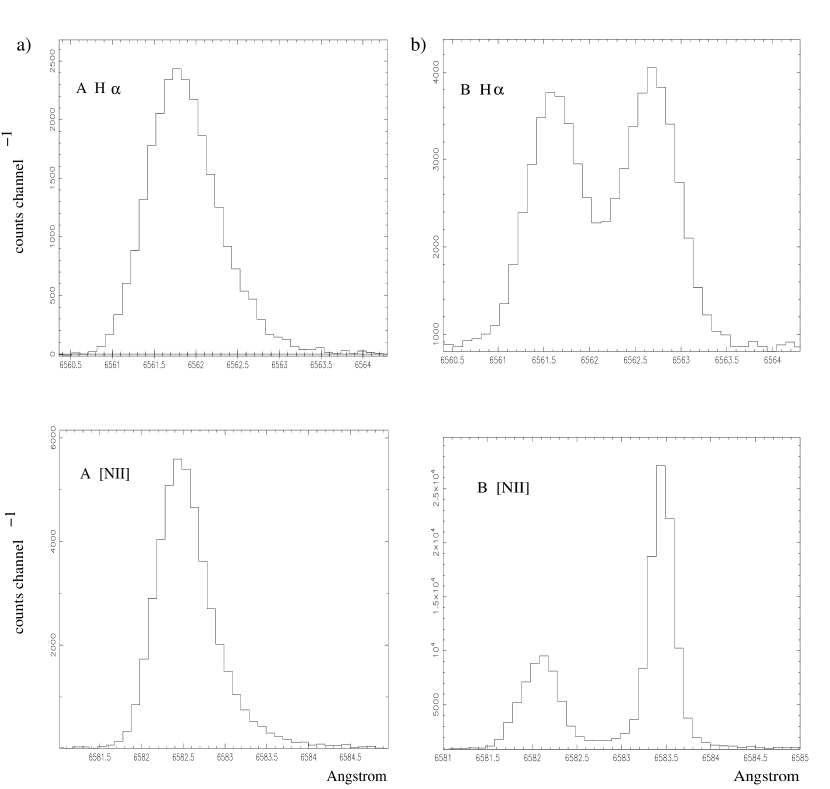
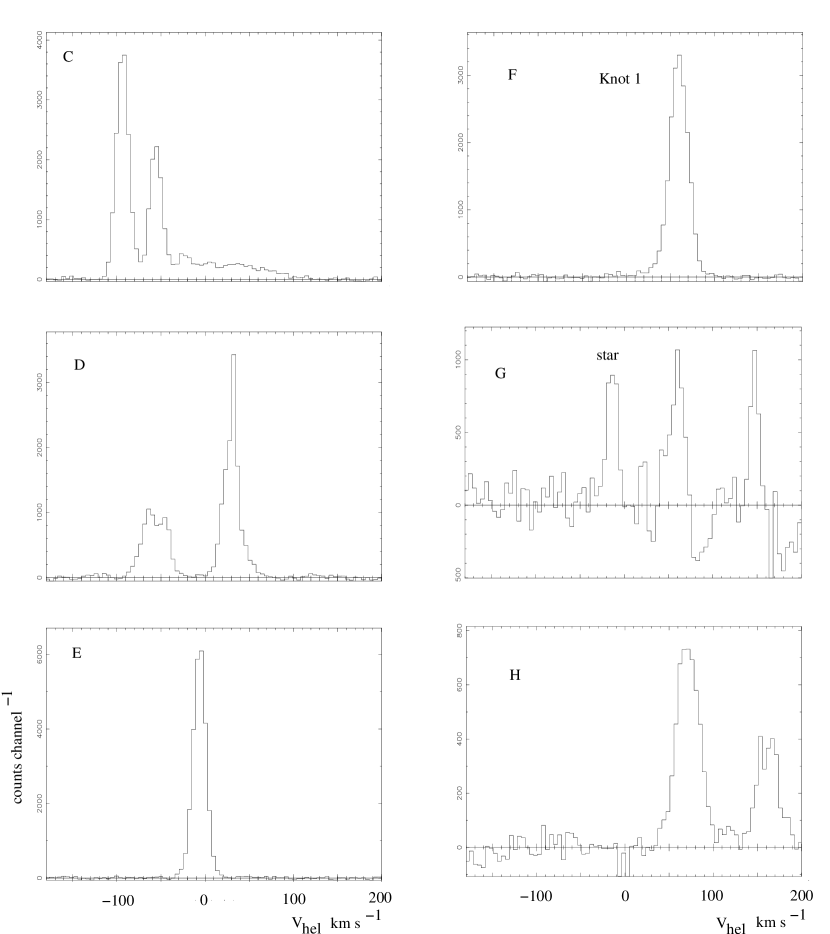
The negative greyscale representations of those parts of the position–velocity (pv) arrays for slit positions 1 – 7 are shown in Figs. 3 – 10. Only the [N ii] 6584 Å profiles are shown. These are compared in each case with the snapshot image of the sky and slit taken immediately before the spectroscopic integregation through the same 90 Å bandwidth filter. The origin of spectral features are precisely identified by this technique. Sample H and [N ii] 6584 Å line profiles for positions A and B in Fig. 4 are shown in Figs. 12a & b; similarly [N ii] 6584 Å profiles from positions C – H in Figs. 5 – 9 are shown in Fig. 13.
3 New kinematical and morphological features
3.1 Systemic velocity
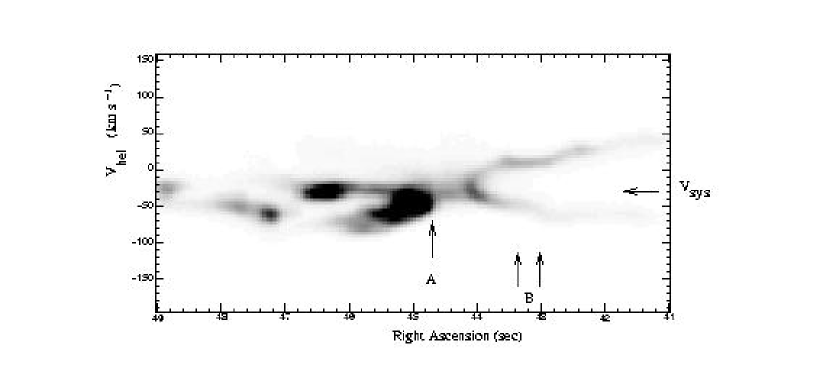
All kinematical features must be discussed with respect to the systemic heliocentric radial velocity . The radial velocities of the two [N ii] 6584 Å line profiles on either side of the central dark lane and closest to its edges for slit position 1 (Fig. 4) afford the opportunity to measure with some certainty; they are both single, narrow and reasonably Gaussian in shape. Gaussian fitting shows the western profile is centered on = -34.0 km s-1 and the eastern one shown in Fig. 12a is centered on -25.5 km s-1 with both widths (including instrumental broadening) 31 km s-1. In the assumption that these central velocities are evenly distributed around then a value of = -29.8 1 km s-1 is therefore indicated for the whole nebular complex. The rest wavelength of the [N ii] 6584 Å line is taken as 6583.45 0.01 Å (calibrated against H at 6562.82 Å) in these calculations (Meaburn et al 1996) and the less accurate [N ii] 6584 Å rest wavelength used by Meaburn & Walsh (1980b) accounts for the -9 km s-1 difference between given in that paper and the value reported here.
3.2 The prominent north western lobe
A starting point for the understanding of the morphology and kinematics of all of the lobes of NGC 6302, including their extremities, is the derivation of the detailed form and behaviour of the most prominent NW lobe. In the image in Figs. 2 (a & b) it can be seen that for a large part of its length the walls of the NW lobe are parallel. This is approximately depicted in Fig. 11 a. The pv arrays in Figs. 3, 5 & 6 show clearly both the radial expansion of this lobe and the tilt to more positive radial velocities away from the central star as found by Meaburn & Walsh (1980b). ‘Velocity ellipses’ indicative of radial expansion with a nearly circular section were shown clearly by Meaburn & Walsh (1980b) as depicted schematically in Fig. 11 b for the A’ cut across the NW lobe also marked here in Fig. 2a. Aspects of this NW lobe of NGC 6302 i.e. its parallism and velocity ellipses across its width, are found in the lobes of the comparable object Mz–3 (López & Meaburn 1983: Meaburn & Walsh 1985).
The angle = 12.8 deg. can be directly measured off the image in Fig. 2b as sketched in the XY plane in Fig. 11a. The separation of the lobe edges along the A’ cut was measured on the image with STARLINK gaia software and simple geometry gives 2. As a circular section is indicated by the velocity ellipses, and this angle is small, then to a reasonable approximation the structure and kinematics of the lobe in the XZ plane is shown in Fig. 11c (the observer is below Fig. 11c). The measured radial velocity differences w.r.t. to , from fig. 4 of Meaburn & Walsh (1980b) are = 0 km s-1, = 59 km s-1 & = 117 km s-1 which firstly implies that the nearside of the lobe along the cut A’ is flowing in the plane of the sky with expansion velocity V and that the lobe axis is = 12.8 deg. to the plane of the sky as shown in Fig. 11c.
As V = (sin (2 ))-1 and = (sin ())-1 a value of V = 263 5 km s-1 is given at the position A’ (1.71 arcmin from the central star) and along the directions shown in Fig. 11c. . The [N ii] image in Figs. 2 a & b and the spectacular one by Corradi, obtained with the 3.6–m La Silla telescope (http://sci.esa.int/science-e/www/object/index.cfm?fobjectid=34985) , are also significant to the dynamical interpretation because these suggest that the walls of the NW lobe are not uniformally filled with outflowing gas: long filaments within these walls project back to the central star. Also there are gaps in the pv arrays; most notably where the slit crosses the western edge of this lobe in Fig. 3.
3.3 Expansion distance
After distance (D in kpc) determinations of PNe based on parallax the most certain method is by measurements of expansion proper motions ( in mas y-1) particularly when the expansion tangential velocities (Vt in km s-1) are both high and well known. For the outflow depicted in Fig. 11 Vt = V cos() then
| (1) |
Gómez et al (1989 - Sect. 1) attempted this measurement of D for the core of NGC 6302 where the expansion velocity is only 10 km s-1. In the present work (Fig. 11 & Sect. 4) the NW lobe velocity is found to be both high (V = 263 km s-1 at A’ in Fig. 2a) and directed along low angles to the plane of the sky. The expansion proper motion of = 56 D-1 mas y-1 is then predicted by the parameters in Sect. 3.2 for the position A’ at 1.71 arcmin from the nebular center in Fig. 2a.
Even a simple visual comparison of the H[N ii] image taken Evans (1959) on 1956, 8 August of NGC 6302 with the [N ii] 6584 Å image in Fig. 2a reveals significant angular shifts outwards with time of many of the nebular features at the extremities of the NW lobe. As the [N ii] 6548, 6584 Å lines combined are 2–3 times as bright as H in these lobes these images are then reasonably comparable. The most certain measurement of this shift is for the knot marked K2 in Fig. 2a for it is bright and compact and conveniently between two close stellar images.
The position of K2 relative to these stars was made by ruler off an enlargement of Evan’s 1956 published image to an accuracy of 0.5 arcsec. Its position relative to the same two stars was measured to far higher accuracy using the STARLINK gaia software on the data array for the 2002 image in Fig. 2a. A shift outwards is detected along a line to the nebular center of 3.26 0.5 arcsec in the 45.762 y between the two images to give = 70.4 10 mas y-1. As the angular distance from the core of K2 is 2.24 arcmin compared with 1.71 arcmin for the position A’ and assuming a Hubble–type expansion of the lobe (see Sect. 4) then the predicted value of = 73 D-1 mas y-1 for now V = 345 km s-1 to give D = 1.04 0.16 kpc as the distance to NGC 6302. Somewhat lower accuracy measurements of knots and filaments in the vicinity of K2 indicate very similar proper motion displacements confirming that those of K2 are not anomalous. Obviously, if the original 1956 plate can be scanned and the results compared in detail with the data array for Fig. 2a both a more accurate distance can be established and the Hubble-type nature of the outflow tested independently of the kinematical modelling in Sect. 4.
3.4 The lobe extremities
The complexities of the extremities of the NW lobe are revealed in the pv arrays of [N ii] 6584 Å profiles in Figs. 7 – 10 as well as in the deep image in Fig. 2b. Separate expansions across this region are particulary apparent in Fig. 7 with values of reaching 175 km s-1 in Figs. 8 – 10. which is 205 km s-1 w.r.t. (and see the [N ii] 6584 Å profiles in Fig. 13 for position G & H). This behaviour is obviously more complex than that depicted for the principal NW lobe in Fig. 11. Radial expansion of a single coherent feature no longer seems present, because separate ‘sheets’ of material with different radial velocities can be seen in the pv arrays. This extremity is westward of the group of knots of which Knot 1 (arrowed in Fig. 2a) is a member. The more eastern knot has a radial velocity close to (Fig. 6 and [N ii] 6584 Å profiles for positions E in Fig. 13) and it appears to be the region where the prominent NW lobe changes its character. Knot 1 (position F in Fig. 13 and Fig. 6) though has a significantly more positive velocity.
3.5 High–speed ‘skirt’
High–speed velocity components in the [N ii] 6584 Å profiles are revealed in Fig. 5 and in the profile marked C in Fig. 13. Positive velocity wings are also present in the profiles in Fig. 12a from position A in Fig. 4. These continuous high speed features are most likely originating within diffuse material near the nebular core. The broad velocity feature from position C extends to = 120 km s-1 where the slit crosses a diffuse ‘ring’ seen in the 3.6–m image of Corradi. This behaviour is very similar to that observed for Mz–3 (fig. 3 of Meaburn & Walsh 1985 and Santander et al, 2004 ) where a ‘skirt’ of material expanding around the nebular core but nearly orthogonally to the axis of the main bi–polar lobes is shown to be present. A similar situation could prevail in NGC 6302. There is also a similar morphological structure in the ejected nebulosity surrounding the LBV star Eta Carinae (Smith, 2002) which may suggest that this is a fundemental property of such outflows.
4 Modelling the lobes with the SHAPE code
With the salient parameters of the NW lobe depicted in Fig. 11 as a starting point the SHAPE code (Steffen, Holloway & Pedlar, 1996; Steffen, López & Riesgo, 2005) has been used to reproduce as realistically as possible the kinematics and morphology of the broader structure of NGC 6302. In these simulations of the pv arrays along slits 1–4 a Hubble-type outflow is assumed where V in Fig. 11 is always proportional to the distance from the central stellar system and pointing along a vector away from it and the measured (Sect. 3.2) value of = 12.8 deg. Note that this is a purely morphological and kinematical model meant to establish the current structure and velocity ‘field’ in the object. No hydrodynamics or radiation transport has been calculated.
The modelling with the SHAPE code is performed in two steps. First, the structure and kinematics is set up in the commercially available software 3DStudioMax, Version 7, (3DStudioMax is a registered trademark of Autodesk, Inc.). One might chose any other similar 3D-modeling software. 3DStudioMax is the one we consider most suitable for our purpose. The model data are then rendered as an image and a long-slit spectrum (pv array) in a renderer written for the purpose. For our model of NGC 6302 we assumed a velocity proportional to distance and directed radially outwards, i.e. a Hubble-type velocity law.
The structure of the lobes of NGC 6302 has been synthesised by outlining them with splines on the direct images in Figs. 1 & 2 and rotating them around the symmetry axis of each structure, thereby producing rotationally symmetric lobes. Since the symmetry axes are close to the plane of the sky, the deviations of the true outline from the projected one, are expected to be very small. The alignments of the 2 narrow and 2 wide lobes have then been adjusted such that they coincide best with the direct image and the pv arrays. The inclination of the whole structure with respect to the plane of the sky has been adjusted according to the axis of the prominent NW lobe, for which we have used the value of 12.8 degrees away from the observer as determined in Sect. 3.2.
Two additional structures have been included, the knotty area marked as K1 in Fig. 2 and the knotty structures in the middle of the southern lobe. They have been produced each by one spheroidal surface which has been deformed applying the noise modifier feature of 3D Studio Max in order to break the spherical symmetry and obtain a more random distribution throughout the volume. The southern structure is located entirely within the opening angle of the southern wide lobe. No attempt was made at this time to reproduce all of the individual small scale structure, although a number of synthetic knots by chance do coincide with observed knots and serve as a reference. This means that the ‘weather conditions’ in NGC 6302 and in the model are different.
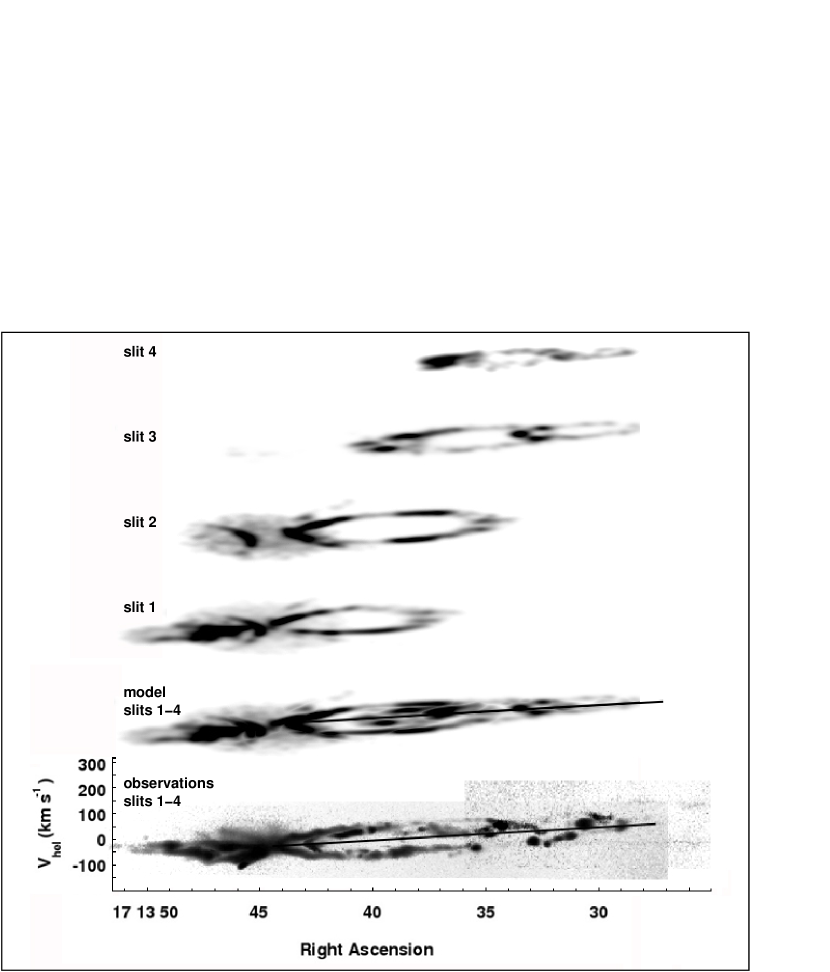
The predicted pv arrays for slits 1–4, after this process, are shown separately in Fig. 14 for comparison with the observed arrays in Figs. 3–7. The kinematical correspondence between the predicted and observed pv arrays is remarkably accurate. Also shown in Fig. 14 is the superposition of the observed pv arrays for slits 1–4 for comparison with the modelled counterpart. The linear tilt of the axis of the outflow in these pv arrays for the prominent northwest lobe is clear. There is only a small change in angle to the west of the knots at its extremity (of which Knot 1 in Fig. 2 is a member). The simulations in Fig. 14 therefore confirm conclusively that the basic outflow is Hubble–type but suggest that this flow is modified somewhat after passage through knotty material to the extreme west of this lobe. This conformity with a Hubble–type flow pattern reinforces confidence that this present model is a true representation of NGC 6302 for such flows are found in a wide range of circumstellar phenomena.
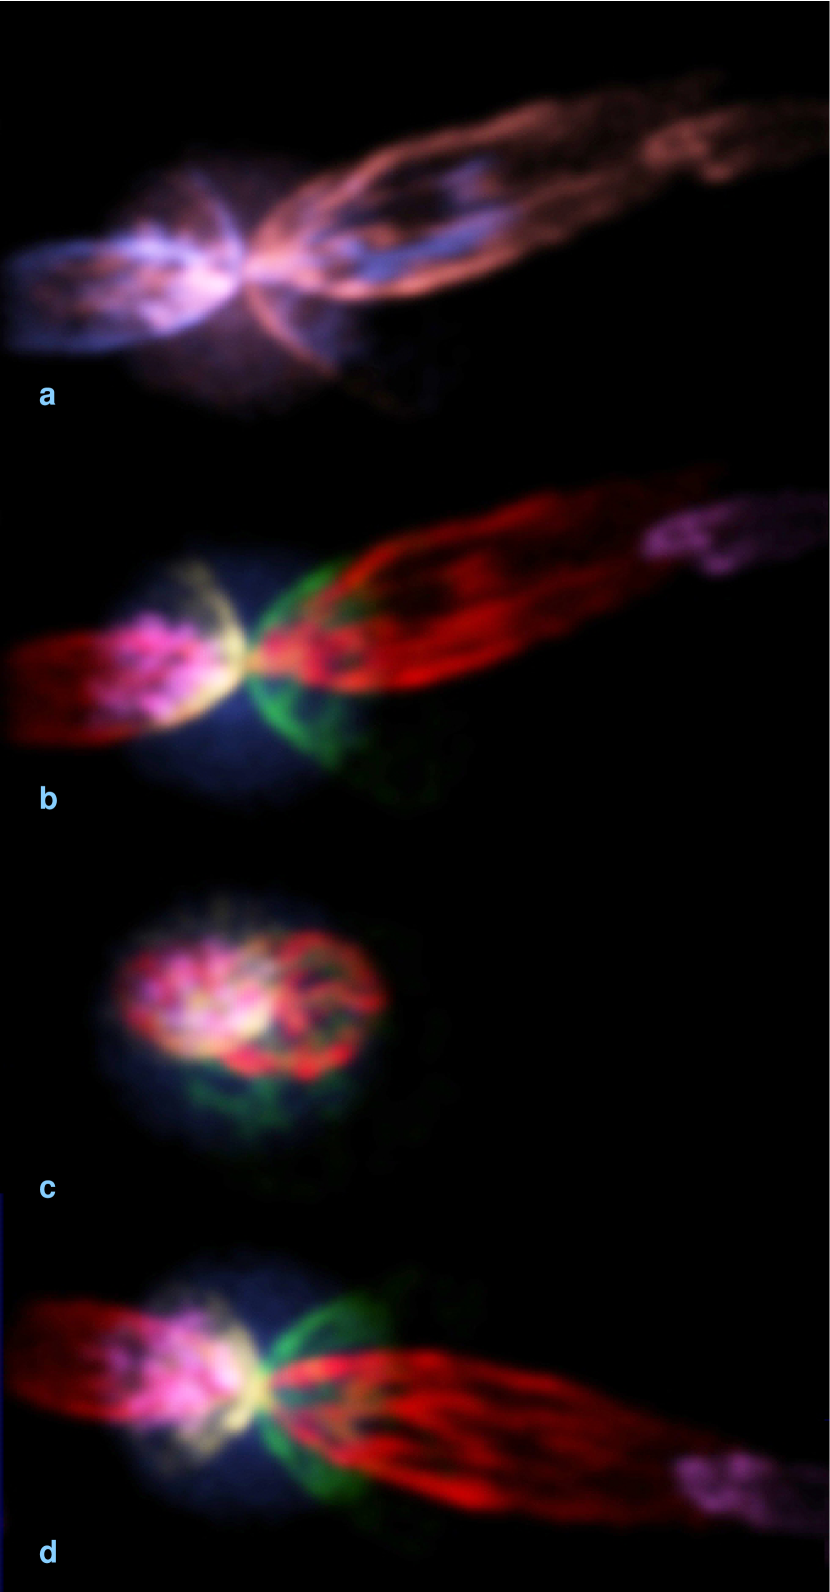
SHAPE modelling permits for the first time different predicted views (Fig. 15a–d) of the lobes of NGC 6302 along various axes; similar objects at less advantageous orientations (‘nature’ is random in this respect) can then be recognised. These ilustrations should then help when determining the structures of other poly–polar PNe from the multitude of complex shapes found when these are imaged.
The first two images are taken along the line of sight (Fig. 15a & b) and are the normal view of the object, whereas those in Fig. 15c & d are views from within the plane of the sky along the north-south and east-west axes respectively. The color coding for Fig. 15a corresponds to the red-blue Doppler shifting whereas for the rest the color coding is arbitrary to allow the separate regions of the object to be distinguished.
5 Wind driven versus ballistic outflows
There are two leading possibilities for the creation of the bi–polar lobes of NGC 6302. In the first by Cantó (1978), Meaburn & Walsh (1980b) and Barall & Cantó (1981), an isotropic particle wind from the central star embedded in a dense disk first forms bi–polar, pressure–driven, cavities perpendicular to this disk. These cavities are delineated by standing shocks across which the wind refracts to drive outflows parallel to the cavity walls. Alternatively, the bi–polar lobes are simply the ballistic consequences of an explosive event in the central stellar system.
The wind model has many attractions, not least that it predicts the dense knots (K1 etc. Fig. 2a) found at the ‘acute tip’ (Barral & Cantó 1981) of the NW lobe of NGC 6302. Within this model the outflowing cavities in the extremities of the NW lobe ( Figs.7–10) are predicted as the wind– driven, out–flowing, cavity walls first collide at this tip then expand outwards again at higher speed.
However, several objections to the wind–driven model have since arisen both here and elsewhere. Most significantly, Feibelman (2001) finds only direct evidence of a very weak wind in the nebular core with a low terminal velocity of -520 km s-1. Meaburn & Walsh (1980b) show that for a distance to NGC 6302 of 150 pc such a weak wind would be insufficiently energetic to form the cavities and then drive the bi–polar outflows (the the distance of NGC 6302 given in Sect. 3.3 is 1.04 kpc). The observed fragmentation of the lobe walls would surely also indicate that wind formation of pressure driven cavities has not occurred. Furthermore, the velocity vectors as depicted in Fig. 11 and used throughout the convincing modelling illustrated in Fig.14 point back to the central star even where the lobe walls appear parallel (e.g. A’ in Fig. 2). The ‘velocity ellipses’ in the pv arrays across the lobe diameters (Meaburn & Walsh 1980b) are a direct consequence of this behaviour and could not be produced by flows along the parallel walls of the wind–driven cavity defined by standing shocks. Elongated wind–driven cavities still in a state of pressure–driven expansion, combined with wind–driven flows parallel to their walls, need exploring dynamically to see if the present observed kinematics can be generated i.e. ‘velocity ellipses’ across the lobe diameters combined with Hubble–type outflows.
However, the ‘Hubble–type’ velocity field predicted by the modelling in Fig. 14 combined with these vectors pointing back to the central star favours the formation of the NW lobe by a single eruptive event. A dynamical age for this event of D (kpc) 1,800 y is determined for V = 263 km s-1 at A’ in Fig. 2a & 11. With the value of D = 1.04 kpc measured in Sect. 3.3 then this age becomes 1,900 y. This suggestion though leaves the creation of the complex motions at the extremities of the NW lobe (west of K1 in Fig. 2a) not easily explained other than that they could perhaps be a consequence of the fastest parts of the same eruptive event (Sect.4) overunning pre–existing dense knots. A simple consequence of the Hubble–type flows revealed in Fig. 14 is that the outflow velocity will reach V 460 km s-1 (Fig. 11) at the furthest extent of the NW lobe 3.0 arcmin from the central star. Beyond this, at 3.9 arcmin from the central star along the same axis, the Hubble-type law prevails but with a steeper slope in which case V 600 km s-1 is predicted for the faintest extremities of this NW outflow from NGC 6302. This is similar to the high maximum speeds ( 500 km s-1) found for the bi–polar lobes of He2–111 (Meaburn & Walsh 1989) and for the ejected knots from MyCn 18 (Bryce et al. 1997).
Incidentally, the bi–polar lobes of the PN Mz–3 (Meaburn & Walsh 1985) have exactly the same characteristics as those of NGC 6302, i.e. velocity ellipses are found across their lobe diameters and the lobe outflows are Hubble–type (see fig. 4 of Meaburn & Walsh 1985 and Santander et al. 2004). In the case of Mz–3 any wind could not impinge on the lobe walls for there are dense, inner, slowly expanding shells shielding the outer extensive lobes. An ejection event within the central stellar system shown to possibily consist of two stars by Smith (2003) with a symbiotic nature suggested by Bains et al (2004), is similarly favoured for the creation of the Mz–3 lobes.
The nature of the central source of NGC 6302 remains unknown. The extremely high electron temperature in the nebula points towards a very massive progenitor, though Cassasus et al. (2000) estimate a progenitor mass between 4 and 5 solar masses. Recently Matsuura et al. (2005) detected an infrared source at the location of the central star of NGC 6302 but were unable to obtain additional information on the source’s nature. Although there are no direct indications of the central source being a binary system, the complex morphology of this nebula with several systems of bipolar axes tilted with respect to each other, such as in the case of NGC 2440 (López et al. 1998), and its eruptive nature revealed here certainly suggests this possibility which should be explored further in the infrared regime with adaptive optics techniques.
6 Conclusions
The prominent NW lobe of NGC 6302 has a circular section whose walls are shown to follow very precisely a Hubble–type outflow.
At 1.71 arcmin from the central stellar system the flow velocity of this NW lobe is measured as 263 km s-1 with a lobe tilt to the sky of 12.8 deg.
A nebulous knot in the NW lobe, at 2.24 arcmin from the center, has a proper motion outwards of 70.4 11 mas y-1. The consequent expansion proper motion distance to NGC 6302 is then 1.04 0.16 kpc.
An eruptive event 1,900 y ago created the prominent NW lobe and possibly many of the other lobe structures.
High positive velocity wings to the [N ii] 6584 Å line profiles to the north of the dark waist of NGC 6302 suggest the presence of an orthogonal ‘skirt’ as found in Mz–3 (and Eta Carinae).
The western extremities of the NW lobe exhibit a small change in the slope of the Hubble–type flow suggesting that a collision with pre–existing globules of gas has occurred which modifies the outflow.
The outflow velocity at the extreme position of the NW lobe reaches 600 km s-1.
.

Acknowledgements
The authors wish to thank the staff of SPM telescope (Mexico), for their help during these observations. JAL and WS gratefully acknowledge financial support from CONACYT (Méx) grants 32214-E and 37214 and DGAPA-UNAM IN114199 and IN111803. MFG is grateful to PPARC for his research studentship.
References
- Aller et al., (1981) Aller, L. H., Ross, J. E., Omara, B. J., and Keyes, C. D., 1981, MNRAS, 197, 95.
- Ashley & Hyland, (1988) Ashley, M. C. B. and Hyland, A. R., 1988, ApJ, 331, 532.
- (3) Bains, I., Redman, M. P., Bryce, M. & Meaburn, J., 2004, MNRAS, 354, 549.
- Barnard, (1907) Barnard, E. E., 1907, Astronomische Nachrichten, 173, 123.
- (5) Barral, J. F. and Cantó, J. F., 1981, Rev. Mex. A & A, 5, 101.
- Barral et al., (1982) Barral, J. F., Cantó, J., Meaburn, J., and Walsh, J. R., 1982, MNRAS, 199, 817.
- (7) Bryce, M., López, J. A., Holloway, A. J. & Meaburn, J., 1997, ApJ, 487, L161.
- (8) Cantó, J., 1978, A&A, 70, 111.
- (9) Casassus, S., Roche, P. F. & Barlow, M. J., 2000, MNRAS, 314, 657.
- Danziger et al., (1973) Danziger, I. J., Frogel, J. A., and Persson, S. E., 1973, ApJ, 184, L29.
- Elliott & Meaburn, (1977) Elliott, K. H. & Meaburn, J., 1977, MNRAS, 181, 499.
- Evans, (1959) Evans, D. S., 1959, MNRAS, 119, 150.
- (13) Feibelman, W. A., 2001, ApJ, 550, 785.
- (14) Gómez, Y., Moran, J. M., Rodriguez, L. F. & Garay, G., 1989, AJ, 345, 862.
- King et al., (1985) King, D. J., Scarrott, S. M., and Shirt, J. V., 1985, MNRAS, 213, 11.
- (16) López, J. A. & Meaburn, J., 1983, MNRAS, 204, 203.
- (17) López, J. A. & Meaburn, J., 1998, ApJ, 493, 803.
- (18) Matsuura, M, Zijlstra, A. A., Molster, F. G., Waters, L. B. F. M., Nomura, H., Sahai, R. & Hoare, M. G., 2005, MNRAS, 359,383.
- (19) Meaburn, J. and Walsh, J. R., 1980a, MNRAS, 191, 5p.
- (20) Meaburn, J. and Walsh, J. R., 1980b, MNRAS, 193, 631.
- (21) Meaburn, J. and Walsh, J. R., 1985, MNRAS, 215, 761.
- (22) Meaburn, J. and Walsh, J. R., 1989, A&A, 223, 277.
- (23) Meaburn J., Blundell B., Carling R., Gregory D. F., Keir D., & Wynne C. G. 1984, MNRAS, 210, 463.
- (24) Meaburn, J., López, J. A., Bryce, M. & Mellema, G., 1996, A&A, 307, 579.
- (25) Meaburn, J., López, J. A., Gutiérrez, L., Quiróz, F., Murillo, J. M., Valdéz, J. & Pedrayez, M., 2003, RevMexAA, 39, 185.
- Minkowski & Johnson, (1967) Minkowski, R. and Johnson, H. M., 1967, ApJ, 148, 659.
- Oliver & Aller, (1969) Oliver, J. P. and Aller, L. H., 1969, ApJ, 157, 601.
- Pottasch et al., (1985) Pottasch, S. R., Preite-Martinez, A., Olnon, F. M., Raimond, E., Beintema, D. A., and Habing, H. J., 1985, A&A, 143, L11.
- Rodriguez et al., (1985) Rodriguez, L. F., Garcia-Baretto, J. A., Cantó, J., Moreno, M. A., Torres-Peimbert, S., Costero, R., Serrano, A., Moran, J. M., and Garay, G., 1985, MNRAS, 215, 353.
- (30) Santander–Garcia, M., Corradi, R. L. M., Balick, B. and Mampaso, A., 2004, A&A, 426, 185.
- (31) Schmeja, S. & Kimeswenger, S., 2001, A&A, 377, L18.
- (32) Smith, N., 2002, MNRAS, 337, 1252.
- (33) Smith, N., 2003, MNRAS, 342, 383.
- (34) Steffen, W., Holloway, A. J. & Pedlar, A., 1996, MNRAS, 282, 1203.
- (35) Steffen, W., López, J.A., Riesgo, H., 2005, to appear in ”The Ninth Texas-Mexico Conference on Astrophysics”, Revista Mexicana de Astronomía y Astrofísica, Serie de Conferencias, ed. Silvia Torres-Peimbert and G. MacAlpine.