The DEEP2 Galaxy Redshift Survey: Clustering of Groups and Group Galaxies at
Abstract
We study the clustering properties of groups and of galaxies in groups in the DEEP2 Galaxy Redshift Survey dataset at in three separate fields covering a total of 2 degrees2. Four measures of two-point clustering in the DEEP2 data are presented: 1) the group correlation function for 460 groups with estimated velocity dispersions of km s-1, 2) the galaxy correlation for the full DEEP2 galaxy sample, using a flux-limited sample of 9800 objects between , 3) the galaxy correlation for galaxies in groups or in the field, and 4) the group-galaxy cross-correlation function. Our results are compared with mock group and galaxy catalogs produced from CDM simulations. Using the observed number density and clustering amplitude of the DEEP2 groups, the estimated minimum group dark matter halo mass is for a flat CDM cosmology with . Groups are more clustered than galaxies in the DEEP2 data, with a relative bias of on scales Mpc. Galaxies in groups are also more clustered than the full galaxy sample, with a scale-dependent relative bias which falls from at Mpc to at Mpc. The correlation function of galaxies in groups has a steeper slope () than for the full galaxy sample (), and both samples can be fit by a power-law on scales Mpc. We empirically measure the contribution to the projected correlation function, , for galaxies in groups from a ‘one-halo’ term and a ‘two-halo’ term by counting pairs of galaxies in the same or in different groups. The projected cross-correlation between group centers and the full galaxy sample, which is sensitive to the radial distribution of galaxies in and around groups, shows that red galaxies are more centrally concentrated in groups than blue galaxies at . DEEP2 galaxies in groups appear to have a shallower radial distribution than that of mock galaxy catalogs made from N-body simulations, which assume a central galaxy surrounded by satellite galaxies with an NFW profile. Using simulations with different halo model parameters, we show that the clustering of galaxies in groups can be used to place tighter constraints on the halo model than can be gained from using just the usual galaxy correlation function alone.
Subject headings:
galaxies: statistics — cosmology: large-scale structure of universe1. Introduction
Groups of galaxies populate an intermediate range in density-contrast between galaxies and clusters and occupy a regime that is critical to understanding hierarchical galaxy formation in CDM models. Merger events between galaxies likely occur within groups rather than clusters due to their lower velocity dispersions (e.g., Ostriker, 1980; Barnes, 1985). Galaxy groups should also be more easily related to dark matter halos than galaxies themselves, which can have a complicated halo-occupation function that depends significantly on galaxy properties. In order to understand and test galaxy formation and evolution models it is useful to relate galaxies to observable groups as a proxy for their parent dark matter halos. The current halo model paradigm (e.g., Seljak, 2000; Ma & Fry, 2000; Peacock & Smith, 2000; Cooray & Sheth, 2002; Kravtsov et al., 2004) provides a statistical analytic measure for relating galaxies to their dark matter halos. A key statistic in the halo model is the halo occupation distribution (HOD) which measures the probability of a halo of a given mass hosting galaxies. The halo model also naturally explains the small deviations seen in the clustering of galaxies at from a power-law model, where there is a transition from galaxies within a single halo and between different halos. The clustering of groups and group galaxies depends not only on halo model parameters but also on the nature of bias and the details of hierarchical structure formation, as well as cosmological parameters such as and .
Observationally, clusters of galaxies have been shown to be very strongly clustered (Bahcall, 1988), with the clustering strength depending on the richness of the cluster. Kaiser (1984) show that the large clustering scale-length of massive and rare Abell clusters can be explained by a simple model in which these clusters formed in regions where the primordial density enhancement was unusually high. Objects forming in the densest peaks would naturally be biased tracers of the underlying dark matter field such that massive clusters would have a higher correlation amplitude than that of galaxies. Since their masses are intermediate, galaxy groups are therefore expected to have clustering properties between those of galaxies and clusters.
The first papers analyzing the clustering of groups in local redshift surveys at present conflicting results and were hampered by small samples and cosmic variance (e.g., Jing & Zhang, 1988; Maia & da Costa, 1990; Ramella, Geller, & Huchra, 1990). Trasarti-Battistoni, Invernizzi, & Bonometto (1997) investigated the effect of changing the linking-length parameters in the Friends-of-Friends (FoF) algorithm and its effect on the clustering signal and found that these early papers used too large a linking length, which led to a diminished clustering strength due to the presence of interlopers. Trasarti-Battistoni, Invernizzi, & Bonometto (1997) found in their data from the Perseus-Pisces redshift survey, using two fields and and 200 groups in each field, that groups are approximately twice as clustered as galaxies, but with significant error bars. All of these papers showed that determining the clustering properties of groups is a tricky endeavor, which can depend quite sensitively on the volume and magnitude depth of the survey, the handling of the selection function and varying completeness, and the method used to identify groups. In addition, these analyses all suffered from significant uncertainties, from both Poisson statistics, due to the small number of groups in the surveys, and cosmic variance, due to the small volumes surveyed, which was not quantified in any of these papers.
Significant advances have recently been made with much larger datasets. Girardi, Boschin, & da Costa (2000), with the combined CfA2 and SSRS2 surveys, have a sample of 885 groups in a volume of , much larger than earlier surveys. With this large sample size, they are able to construct volume-limited subsamples and investigate the dependence of clustering on group properties, finding that groups with more members and/or larger internal velocity dispersion are more strongly clustered. Merchán, Maia, & Lambas (2000) use a sample of 517 groups from the Updated Zwicky Catalog and 104 groups from the SSRS2 to show that groups are at least twice as clustered as galaxies, and that more massive groups have larger clustering strength.
Most recently, the 2dF Galaxy Redshift Survey has provided a vast dataset with which to study large-scale structure at . Using data from the 100k release, Zandivarez, Merchán, & Padilla (2003) measure the clustering of groups as a function of virial mass and find that more massive groups are more clustered and that their measurements match the clustering of dark matter halos in a CDM N-body simulation. Using the completed 2dF survey, Padilla et al. (2004) analyze group clustering as a function of luminosity and show that while the least luminous groups actually cluster less than the galaxies in the survey, there is a strong relation between group luminosity and correlation length, and the most luminous groups (with ) are times more clustered as the least luminous groups (with ). The relation between clustering scale length and mean group separation that they find continues the trend seen on larger scales for clusters. They find very good agreement between their data and mock catalogs constructed from CDM simulations and semi-analytic galaxy evolution recipes. These same conclusions are reached by Yang et al. (2005c), who also use the 2dF data to measure the clustering of groups as a function of luminosity. It appears that at there is now convergence among group clustering analyses.
The extensive 2dF group catalogs have now also allowed studies of groups beyond simple measures of the correlation function of groups. Several authors measure the radial profile of galaxies in groups using 2dF data (Collister & Lahav, 2005; Diaz et al., 2005; Yang et al., 2005b), and analyze the cross-correlation between group centers and galaxies (Yang et al., 2005b). These papers find that galaxies in groups are less concentrated than dark matter particles in simulations, and also find that, locally, the centers of groups are preferentially populated by red galaxies compared to blue galaxies. The HOD has now also been measured directly at using counts of galaxies in groups of different masses (Collister & Lahav, 2005; Yang et al., 2005a), constraining halo model parameters locally. Clustering measures of the correlation function of all galaxies (not just those in groups) at intermediate redshifts indicate that the HOD does not change significantly between and (Yan, Madgwick, & White, 2003; Phleps et al., 2005).
These measurements have only been performed with local samples; group catalogs have not been available at intermediate- or high-redshift. In this paper we present the first analysis of group clustering at , using group catalogs from the DEEP2 Galaxy Redshift Survey (Gerke et al., 2005). The high resolution of the DEEP2 data allows us to identify groups in three dimensions regardless of their galaxy properties, using only their overdensity in space. We focus here on the clustering of groups and galaxies within groups at , as these measures, when combined with similar measures at , will provide constraints on galaxy evolution and structure formation models. We also show how these measures can constrain the HOD at .
Four measures of two-point clustering in the DEEP2 dataset between are analyzed: 1) the group correlation function, 2) the galaxy correlation function for DEEP2 galaxies, 3) the galaxy correlation function for galaxies in groups, and 4) the group-galaxy cross-correlation function. These clustering measures can be used to constrain the halo model parameters by comparing the data to mock catalogs with different HODs. The first clustering measure, when combined with the observed number density of groups in our sample, is used to estimate the typical dark matter masses of the halos the groups studied reside in. The second measure provides constraints on the HOD, though not in an entirely unique way; further constraints on the HOD are provided by the last two measures. For the clustering of galaxies in groups, we empirically distinguish between ‘one-halo’ and ‘two-halo’ terms using pairs of galaxies within the same group and pairs in different groups, respectively. The clustering of galaxies in groups and the group-galaxy cross-correlation function can also constrain the radial distribution of galaxies within groups when compared with mock catalogs.
Lastly, groups may be used to constrain cosmological parameters like the dark energy equation of state, , if their bivariate distribution in redshift and velocity dispersion can be accurately measured (Newman et al., 2002). This test, however, requires that the relation between group velocity dispersion and dark matter halo mass be known and accurately calibrated. It has recently been suggested (Majumdar & Mohr, 2004; Lima & Hu, 2004) that the clustering properties of galaxy clusters may be used for ”self-calibration”, since the clustering properties of halos can be predicted as a function of mass and compared to the measured clustering. The group correlation function results presented here should be useful as such a self-calibration procedure for future DEEP2 studies.
An outline of the paper is as follows: §2 briefly describes the DEEP2 Galaxy Redshift Survey and the sample of galaxy groups used here, as well as the mock galaxy catalogs constructed for the survey. §3 discusses the methods used to calculate the two-point correlation functions. We present clustering results for groups in §4, where we compare with simulations and estimate the minimum dark matter halo mass for our groups. In §5 we analyze the clustering of the full galaxy sample and galaxies in groups in the DEEP2 data and in mock catalogs and show the contribution to the correlation function for galaxies in groups from the ‘one-halo’ and ‘two-halo’ terms. §6 presents the cross-correlation between the full galaxy sample and group centers, which depends upon the radial profile of galaxies in groups. The relative biases between galaxies in groups and all galaxies and between groups and galaxies are presented in §7. Mock catalogs with different halo models are used to illustrate how these various clustering measures can be used to constrain parameters of the halo model in §8. We conclude in §9.
2. Data Sample and Mock Catalogs
In this paper we use data from the DEEP2 Galaxy Redshift Survey, which is an ongoing project using the DEIMOS spectrograph (Faber et al., 2002) on the 10-m Keck II telescope to survey optical galaxies at in a comoving volume of approximately 5106 Mpc3. Using hr exposure times, the survey will measure redshifts for galaxies in the redshift range to a limiting magnitude of (Coil et al., 2004a; Faber et al., 2005). Spectroscopic targets are pre-selected using a color cut in - space to ensure that most galaxies lie beyond . This color-cut results in a sample with 90% of the targeted objects at , missing only 3% of the galaxies which meet our magnitude limit (Davis et al., 2002). Due to the high dispersion () of our spectra, our redshift errors, determined from repeated observations, are km s-1. Restframe colors have been derived as described in (Willmer et al., 2005). Details of the observations, catalog construction and data reduction can be found in Davis et al. (2002); Coil et al. (2004b); Davis, Gerke, & Newman (2004); Faber et al. (2005).
The completed survey will cover 3 square degrees of the sky over four widely separated fields to limit the impact of cosmic variance. Each field is comprised of two to four contiguous photometric ’pointings’ of size by degrees. Here we use data from six of our most complete pointings to date, in three separate fields. We use data from pointings 1 and 2 in the DEEP2 fields 2, 3 and 4. Each DEEP2 pointing corresponds to a volume of comoving dimensions Mpc in a CDM model for . The total volume of the sample used in this paper is thus . To convert measured redshifts to comoving distances along the line of sight we assume a flat CDM cosmology with and . We define and quote correlation lengths, , in comoving Mpc. Throughout the paper, we quote empirical errors calculated from the variance across the six pointings. In so doing we have treated the six DEEP2 pointings as being entirely independent, and they are not: there are two adjacent pointings in each of three independent fields. We estimate from Monte Carlo simulations using the methods outlined in Newman et al. (2002) that, for the distribution of pointings used here, the measured standard error should be increased by %, for errors which are dominated by cosmic variance; this is a conservative assumption, as (especially for the group-group correlations) other contributions such as shot noise are significant.
A description of the methods employed to detect groups is presented in Gerke et al. (2005), along with details of the group catalog. A Voronoi-Delaunay Method (VDM) group-finder (Marinoni et al., 2002) is used to identify galaxy groups. This method searches for galaxy overdensities in redshift space, using an asymmetric search window to account for redshift-space distortions. The advantage of the method over traditional FoF group-finding methods lies in the fact that it has no fixed length scale, but instead uses an adaptive search radius based on estimated group richness. The VDM group-finder thus avoids a common problem of FoF methods, in which clustered groups are merged together along filaments.
We use three galaxy samples in this paper; all are drawn from the same volume as the group sample. The full galaxy sample includes a total of 9787 galaxies in the redshift range in the same six pointings used for the group analysis. We also split the full galaxy sample into subsamples of field and group galaxies, with 5947 and 3840 objects in each. Throughout this paper we use the terms “all galaxies” and “the full galaxy sample” interchangeably; they include both the field and group galaxy samples.
Our main group sample consists of all DEEP2 groups with an estimated velocity dispersion km s-1, with a total of 460 groups and groups per pointing. We do not make a distinction between groups and clusters - clusters are simply the larger groups; they are included in all analyses, but have minimal impact on this work due to their rarity. The km s-1 group sample has similar completeness (%) and purity (%) as samples with higher cutoffs, as estimated using mock catalogs described below. Here completeness is defined as the fraction of real groups (defined as a group of galaxies belonging to the same parent halo, where halos are identified using FoF in real space on the dark matter particles in the simulations) that are successfully identified in the recovered group catalog created by the group-finder, and purity is the fraction of recovered groups that correspond to real groups (see Gerke et al. (2005) for more details). As shown in Fig. 8 of Gerke et al. (2005), these statistics are nearly independent of group velocity dispersion. There are more recovered groups than real groups in these mock catalogs by a factor of 1.4. The km s-1 group sample has a relatively high “galaxy success rate” of %, defined as the fraction of galaxies in real groups that are identified as group galaxies in our recovered group catalog, and an interloper fraction of %. We do not use the km s-1 cut that was used in Gerke et al. (2005), as that cut was used to define a sample that recovered different physical properties than the ones relevant here; instead of the distribution of groups in redshift and velocity dispersion, the relevant parameters here are the positions of groups and the interloper fraction (the fraction of identified group galaxies that are not actually in groups).
The observed richness distribution of our groups in the DEEP2 data is roughly a power-law, with most groups having two observed galaxies; the largest groups have galaxies, though there are only a few groups this large. Fig. 1 shows the observed richness distribution for groups in the DEEP2 data as well as for real and recovered groups in our mock catalogs, for groups with and km s-1.
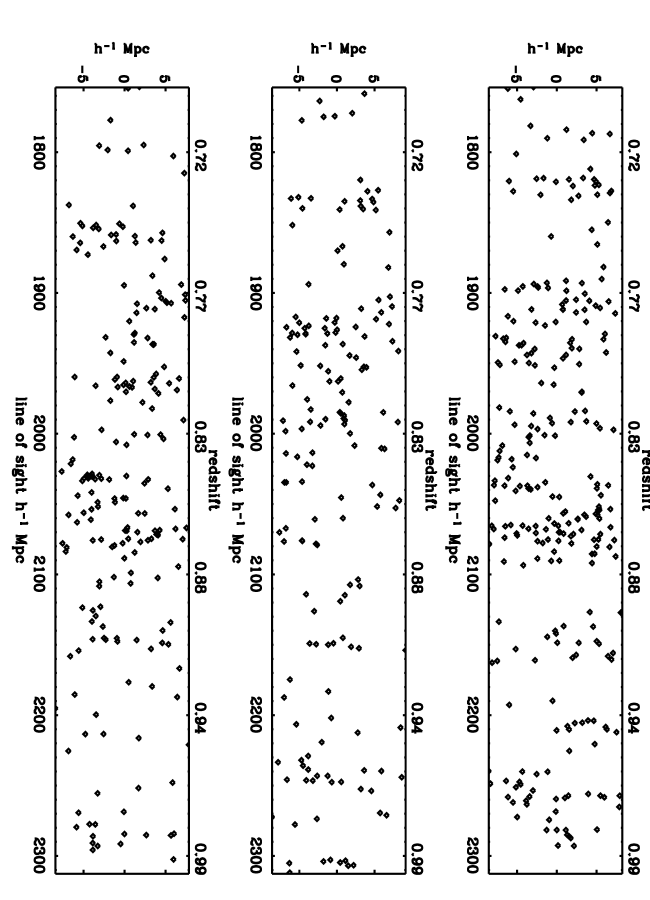
A histogram of the redshift distribution of our group sample is shown in Fig. 2. We restrict the analyses here to the redshift range to minimize systematic effects. While groups are found in the survey to higher redshifts, those groups are likely to be more massive and hence not as representative of groups in our sample as a whole. Additionally, the -band target selection of the survey corresponds to a bluer restframe color-selection at higher redshift; this results in fewer red galaxies being targeted at higher redshift compared to blue galaxies (Willmer et al., 2005), which could systematically affect the group richness and velocity dispersion estimates at . The spatial distribution of DEEP2 groups in three of the six pointings used is shown in Fig. 3. Shown are pointings 2 in the DEEP2 fields 2, 3 and 4.
The mock galaxy catalogs used throughout the paper are described in Yan, White, & Coil (2004); relevant details are repeated here. The mock catalogs are constructed from N-body simulations of dark matter particles with a particle mass of in a box with dimensions 256 Mpc on a side, for a CDM cosmology with . Dark matter halos were identified using FoF in real space and galaxies were placed within halos using a halo model prescription. To populate dark matter halos with galaxies, two functions need to be specified. The first is the halo occupation distribution function (HOD), which is the probability that a halo of mass M hosts N galaxies, . The second is the spatial distribution of galaxies within halos. The first moment of the HOD function, the average number of galaxies as a function of halo mass M, is shown in Fig. 1 in Yan, White, & Coil (2004) and in Fig. 12 of this paper (labeled as “B256”) for the HOD used in the mock galaxy catalogs here. This HOD is constrained at with the 2dF luminosity function and luminosity dependent two-point correlation function of galaxies and at with the DEEP2 and the COMBO-17 luminosity functions. In §8 of this paper we compare clustering results for mock catalogs with two different halo models; for the bulk of the paper, however, we use lightcones with the HOD as published in Yan, White, & Coil (2004). Once the number of galaxies in each halo and their corresponding luminosities are known, the most luminous galaxy is assigned to the center of mass of the halo, and positions and velocities for the other galaxies are drawn randomly from those of the dark matter particles. No other radial or velocity bias is included in assigning galaxies to particles, so that galaxies trace the mass and velocity distributions of the dark matter particles in the halo. The spatial distribution of galaxies follow the dark matter density profile, which on average is an NFW profile. Although no velocity bias is included, the velocity dispersions of the galaxies are systematically smaller than those of the mass (see Fig.8 in Yan, White & Coil 2004), due to the fact that the most luminous galaxy is always assigned to the particle at the center of mass. Here we use a set of twelve independent catalogs which each have the same spatial extent as a single DEEP2 pointing ( by degrees).
The center of each DEEP2 group (needed for the clustering measures performed here) is measured as the median of the positions (in comoving x, y, and z) of the galaxies identified in that group. Errors on the positions of the recovered groups are estimated using the differences in the mock catalogs between the centers of real groups and recovered groups. As stated above, there is a factor of 1.4 more recovered groups in the mock catalogs than real groups for km s-1. In the mock catalogs 74% of recovered groups have a real group within Mpc, while 48% have a real group within Mpc and 41% have a real group within Mpc. Here is the projected distance on the plane of the sky, which is the relevant distance for the projected clustering used in §5 and later in the paper; in §4 we use the redshift-space correlation function, but only measure it on scales Mpc. We therefore believe that on scales larger than 1 Mpc our results are robust to errors in the group positions, while on smaller scales, where we will measure the cross-correlation between group centers and galaxies, there is likely to be some degradation in the signal due to position errors; this is discussed more in §9. However, the mock catalogs have been treated in an identical manner as the data so that comparisons between the data and mock catalogs are unaffected.
3. Methods
The two-point correlation function is defined as a measure of the excess probability above Poisson of finding an object in a volume element at a separation from another randomly chosen object,
| (1) |
where is the mean number density of the object in question (Peebles, 1980).
Measuring requires constructing a random catalog with the same selection criteria and observational effects as the data, to serve as an unclustered distribution with which to compare. For each data sample we create a random catalog with the same overall sky coverage and redshift distribution as the data. This is achieved by first applying the two-dimensional window function of our data in the plane of the sky to the random catalog. Our overall redshift success rate is 70% and is not entirely uniform across the survey; some slitmasks are observed under better conditions than others and therefore yield a slightly higher completeness. This spatially-varying redshift success rate is taken into account in the spatial window function which is applied to both the random catalog and the mock catalogs, such that regions of the sky with a higher completeness have a correspondingly higher number of random points or more objects in the mock galaxy catalogs. This ensures that there is no bias introduced when computing correlation statistics or comparing the data to the mock catalogs. We also mask the regions of the random and mock catalogs where the photometric data have saturated stars and CCD defects.
We then apply a selection function, , defined as the probability of observing a group as a function of redshift, so that the random catalog has the same overall redshift distribution as the data. The selection function for groups in the DEEP2 survey is determined by smoothing the observed redshift distribution of groups in the catalog used here, as shown in Fig. 2. The apparent overdensity at seen in this figure is due to structures in several pointings and does not significantly affect our results, which are averaged over all pointings and a wide redshift range. As the group catalog includes three separate fields, the data are combined when calculating , which reduces the effects of cosmic variance. Using a smoothed redshift distribution to estimate the selection function can cause a systematic bias, but we estimate that this bias is less than the errors on . In what follows, for both the data and the mock catalogs the redshift range over which we compute is limited to , the redshift range over which the selection function varies by less than a factor of two. Each of the six pointings has between groups, and each of the twelve independent mock catalogs contains groups. We use random points in each pointing to calculate the correlation function for groups and random points to calculate the correlation function for galaxies.
The two-point correlation function is measured for both groups and galaxies using the Landy & Szalay (1993) estimator,
| (2) |
where , and are pair counts in a given separation range in the data-data, data-random, and random-random catalogs, and and are the mean number densities in the data and random catalogs. This estimator has been shown to perform as well as the Hamilton estimator (Hamilton, 1993) but is preferred as it is relatively insensitive to the size of the random catalog and handles edge corrections well (Kerscher, Szapudi, & Szalay, 2000). As the magnitude limit of our survey results in a non-uniform selection function, a standard -weighting scheme is applied (Davis & Huchra, 1982), which attempts to weight each volume element equally while minimizing the variance on large scales. As the redshift range is limited to for all analyses in this paper, this effect is not large (%).
Measurements of the cross-correlation between two samples (presented in §6) use a symmetrized version of Eqn. 2. Each data sample, with pair counts labeled and , has an associated random catalog, with pair counts and , with the same selection function as the data. After normalizing each data and random catalog by its number density, the cross-correlation is estimated using
| (3) |
Redshift-space distortions due to peculiar velocities along the line-of-sight will introduce systematic effects to the estimate of . At small separations, random motions within a virialized overdensity cause an elongation along the line-of-sight (“fingers of God”), while on large scales, coherent infall of galaxies into forming structures causes an apparent contraction of structure along the line-of-sight (the “Kaiser effect”). What is actually measured then is , where is the redshift-space separation between a pair of galaxies. As we will show in the next section using mock group catalogs, for galaxy groups over the scales relevant here, the systematic effects of redshift-space distortions are of order 20%. Mock catalogs are used to correct for redshift-space distortions and infer from by multiplying the observed for DEEP2 groups by the ratio of to for groups in the mock catalogs.
However, redshift-space distortions are more significant when measuring for galaxies, as smaller scales are probed. We are able to measure on small scales for the galaxy sample both because of the larger sample size, which allows us to stably measure the clustering on small scales, and also because there is no exclusion radius, unlike with groups, which typically have a radius of Mpc. To uncover the real-space clustering properties of galaxies we measure in two dimensions, both perpendicular to and along the line of sight. Following Fisher et al. (1994), and are the redshift positions of a pair of galaxies, is the redshift-space separation (), and ( is the mean distance to the pair. The separation between the two galaxies across () and along () the line of sight are defined as
| (4) |
| (5) |
In applying the Landy & Szalay (1993) estimator to galaxies, pair counts are computed over a two-dimensional grid of separations to estimate .
To recover is projected along the axis. As redshift-space distortions affect only the line-of-sight component of , integrating over the direction leads to a statistic , which is independent of redshift-space distortions. Following Davis & Peebles (1983),
| (6) |
where is the real-space separation along the line of sight. If is modeled as a power-law, , then and can be readily extracted from the projected correlation function, , using an analytic solution to Equation 6:
| (7) |
where is the gamma function. A power-law fit to will then recover and for the real-space correlation function, .
4. Group Clustering Results
This section presents results on the clustering of groups at . The two-point correlation function for groups in the DEEP2 data is measured. The clustering properties of groups in our mock catalogs are analyzed, which allows us to quantify our systematic errors and to correct the observed clustering in the DEEP2 data for redshift-space distortions and the effects of the group-finder. The number density of groups in the DEEP2 data is then used to infer the minimum dark matter halo mass which hosts our groups; we then compare the clustering of halos with this mass to the clustering of our group sample.
4.1. Clustering of Groups in DEEP2 Data and Mock Catalogs
The left panel of Fig. 4 shows the observed two-point correlation function in redshift space, , for our km s-1group sample, for both the full sample (solid line) with two or more galaxies in each group () and for a subsample with four or more galaxies in each group (). Also shown is for the recovered group sample in the mock catalogs with and (dotted line). We show the standard error across the six pointings; this empirical error therefore includes both cosmic variance and Poisson error. The data sample shows a stronger clustering amplitude than the data sample. This is likely due to the sample containing more massive groups, on average, than the sample. The sample is also less likely to have interlopers, which may also increase the observed clustering.
Power-law fits to over the range Mpc are given in Table 1. Below Mpc does not continue to rise as a single power-law in our data; this lack of pairs on scales Mpc is likely due to the finite physical extent of groups. To take into account the covariance between and , we perform a minimization and marginalize over each parameter separately. This procedure leads to errors which are roughly a factor of two larger than if we neglected this covariance.
The mock galaxy catalogs described in §2 are used to quantify systematic errors in our group clustering analysis. Effects that may be introduced by the group-finder are tested by comparing in redshift space for both real and recovered groups. The results are shown in Table 1. The recovered groups have a slightly higher clustering amplitude (5%) than the real groups. Redshift-space distortions are quantified by measuring in redshift space and in real space for real groups. Redshift-space distortions appear to enhance the clustering properties of groups by % on scales Mpc and decrease the clustering amplitude on smaller scales. The clustering scale length increases by % when measured in redshift space, while there is no change to the slope over the scales used here. The effects of our slitmask target selection algorithm on the clustering of groups are also tested using the mock catalogs. Our target selection code determines which galaxies would be observed on slitmasks; because spectra from neighboring galaxies can not overlap on the CCD, not all galaxies can be selected to be observed. In particular, in overdense regions on the plane of the sky the number of galaxies which can be observed decreases in a non-trivial way. By running our slitmask target selection code on the mock catalogs we can quantify the effect on the measured .
Under the assumption that corrections for the above effects should be proportional to the clustering strength, these results from the mock catalogs can now be used to correct the observed for groups in the DEEP2 data for target selection effects, redshift space distortions, and the group-finder, in order to estimate in real space for real groups. We can either apply corrections to the power-law fits themselves or to the data points as a function of scale. If we apply the corrections to and as measured for the DEEP2 groups, the corrections would infer that Mpc and for the real-space correlation function of real groups in the DEEP2 data with . If we explicitly correct the observed for the DEEP2 groups as a function of scale, using the ratio of / in the mock catalogs, the resulting has a power-law fit of Mpc and , within the 1 error of the inferred values. The corrected is shown as the solid line in the right panel of Fig. 4, for both the and samples. The clustering of groups in the DEEP2 data is therefore 1-3 lower than the clustering of real groups before target selection in the mock catalogs, where and , for .
4.2. Minimum Group Mass Derived from Clustering Results
The minimum dark matter halo mass that our groups reside in can be inferred from the observed number density and clustering strength of our groups using either analytic formulations of the dark matter halo mass function or by comparing directly to simulations. Here we estimate a minimum dark matter halo mass from the observed number density using analytic theory and then compare the corresponding predicted clustering strength of those halos in both theory and simulations with the observed clustering strength of our groups.
The km s-1 group sample has an observed density of , calculated from the observed number of groups between , where the group selection function is the highest, divided by the comoving volume occupied by the groups. The mock catalogs are used to estimate the effects on the observed number density due to our slitmask target selection (which decreases the number of observed groups, as most groups have only two or three observed galaxies) and the false interloper rate due to the group-finder. Correcting for these effects, the actual comoving number density is estimated to be . This corresponds to a mean inter-group spacing of Mpc. For comparison to the sample used by Gerke et al. (2005), the number density of groups with km s-1 is , after applying the above corrections, which corresponds to an intergroup spacing of Mpc.
For a CDM cosmology with , , , , , a comoving number density of results in at and at for a Sheth & Tormen (1999) mass function. A comoving density of , estimated for the km s-1 sample, corresponds to at and at . These masses are only approximate as the group number and volume are both just estimates. The errors on the minimum dark matter halo masses inferred from the observed number densities are likely %, given cosmic variance errors and the uncertainties in the corrections made to the number densities from the mock catalogs.
We check for consistency between the observed and predicted clustering of these halos. Mo & White (2002) use the Sheth & Tormen (1999) model to predict the evolution in the clustering of dark matter halos and find that halos of mass will have a clustering amplitude of at . Here is defined as the standard deviation of halo count fluctuations in a sphere of radius 8 Mpc; it can be preferable to quoting a scale-length, , as it removes the significant covariance with . can be calculated from a power-law fit to using the formula,
| (8) |
where
| (9) |
(Peebles, 1980). Using the power-law fits to for groups in the DEEP2 data, we find , in agreement with the predicted value of Mo & White (2002).
Kravtsov et al. (2004) find using dark matter simulations with the same concordance cosmology that a number density of at corresponds to a minimum mass of . This value is comparable to the Sheth & Tormen (1999) value quoted above. They predict a clustering amplitude of Mpc and for these halos, which corresponds to , in good agreement with our observed value of for the DEEP2 groups.
We verify from the mock catalogs that the actual minimum dark matter halo masses for these group samples are similar to those estimated above. For the group sample defined as having an estimated km s-1, the mass distribution has a rough minimum dark matter halo mass of and the km s-1 sample has a rough minimum dark matter halo mass of . The mass distributions for the group samples in the mock catalogs do not have a very clearly defined lower-mass cutoff, however, and these values are roughly half of the values quoted above. Even though the galaxies in the mock catalogs are randomly drawn from the velocity distribution of individual dark matter particles, the fact that only a small number of galaxies are observed in a single group leads to significant scatter between the estimated from the observed galaxies and the actual and therefore the mass of the underlying dark matter particles; this scatter likely accounts for the factor of two discrepancy between the halos in the mock catalogs and the predictions of Sheth & Tormen (1999).
5. Clustering of Galaxies in Different Environments
In this section the clustering properties for galaxies in groups relative to the full galaxy population and to field galaxies are investigated. Unlike for the group sample, which has larger Poisson errors and can only be measured on scales Mpc, where redshift-space distortions are small, here we are interested in measuring clustering properties of galaxies on small scales where redshift-space distortions are much more significant. Instead of inferring in real space from measurements of in redshift space, we measure the projected two-point correlation function, , from which can be more directly inferred. Color information additionally allows us to divide the sample of group galaxies into red and blue populations and measure for each. We test the effects of our slitmask target selection algorithm and group-finder on these results using mock catalogs. Finally, we are able to empirically separate the observed for galaxies in groups into a ‘one-halo’ and a ‘two-halo’ term, by keeping pair counts where both galaxies are in the same or in different groups.
5.1. Clustering of Full Galaxy Sample and Galaxies in Groups in DEEP2 data
The full galaxy sample here refers to all DEEP2 galaxies between in the same six pointings for which we have group catalogs. The group and field galaxy samples are identified using the km s-1 group catalog, and these samples combined make up the full galaxy sample. Fig. 5 shows the spatial distribution of galaxies in three DEEP2 pointings, with different symbols for group (open triangles) and field (crosses) galaxies. In the DEEP2 data 39 +/-4% of all galaxies are identified as belonging in recovered groups which have km s-1 in the redshift range , where the error quoted is the standard error across the six pointings. This rate is artificially increased by false interlopers, but it is also decreased by our slitmask target selection by roughly the same amount, as estimated using mock galaxy catalogs. In the mock catalogs, 27% of all galaxies are identified as belonging in recovered groups after target selection (24% are in real groups before target selection), significantly less than in the DEEP2 data. This difference is most likely due to the free parameters in the group-finding algorithm having been tuned to reproduce the observed for km s-1, not the km s-1 cutoff in the present sample (see Fig. 6 in Gerke et al. (2005) for details). The clustering results shown here do not depend on the absolute number of galaxies in each of the samples (all, group, and field galaxies).
Fig. 6 presents for the full galaxy sample (solid lines), galaxies in groups (dashed lines) and for field galaxies (dotted lines), in both the DEEP2 data (top) and in the mock catalogs (bottom). The top left panel compares as measured in the observed DEEP2 data (thin lines with no error bars) with after correcting for effects due to target selection and the group-finder (thick lines with error bars). To make this correction, we have used the ratio of as a function of scale in the mock catalogs for group galaxies, field galaxies, and all galaxies separately, identified using real groups before target selection (thick lines with error bars in the bottom right panel), to for galaxies identified using recovered groups after target selection (thick lines with error bars in the bottom left panel). Power-law fits to the corrected points are shown in the top right panel of Fig. 6 and are listed in table 2, along with fits to the observed points. Field galaxies are well fit by a power-law on scales Mpc. On smaller scales the correlation function is negative, as field galaxies are not found within Mpc of each other. Pairs of galaxies within that distance are likely to be part of a group.
We will present updated results for for galaxies in the DEEP2 dataset as a function of galaxy color, luminosity, redshift, etc. in a future paper (Coil et al. 2005, in preparation). Here we focus on the difference between the clustering of galaxies in groups relative to the full galaxy sample (throughout this paper we use the terms “all galaxies” and “the full galaxy sample” interchangeably; they include both field and group galaxies). The full galaxy sample used here includes a total of 9787 galaxies in the redshift range in the same six pointings used for the group analysis. This represents a great advance over the sample used in Coil et al. (2004a), which contained 2219 galaxies in one pointing over the redshift range . The fits for and here agree with our earlier results, but the errors, both Poisson and cosmic variance, are much smaller in the current sample. For example, we can now address whether the significant rise in slope of on small scales predicted by Kravtsov et al. (2004) for galaxies at based upon their simulations is present in the DEEP2 data. They find that for a galaxy sample with a comoving number density of (similar to the DEEP2 sample at ; see Lin et al. (2004)) that the slope of changes from when measured on scales of Mpc, where is measured to be Mpc, to over scales Mpc, where Mpc. Fitting our corrected for the full galaxy sample over the same range in results in Mpc, Mpc and , while for scales Mpc, Mpc and , with no change at all in either amplitude or slope. Therefore no evidence is found for a rise in the slope on small scales as predicted by Kravtsov et al. (2004). We also do not find a significant difference in the slope on scales Mpc compared to scales Mpc, as is seen for the galaxies in groups. Fitting for a power-law on scales Mpc, Mpc and , while on scales Mpc, and . The full galaxy sample therefore appears to be consistent with a single power-law slope over the range Mpc. We note that in the mock catalogs, the slope measured for is consistent with the data, though the amplitude of is % higher. As stated before, the mock catalogs were designed to match the previously published measurements of for the full DEEP2 galaxy sample.
The correlation function for galaxies in groups is relatively well-fit by a power-law over all scales; a broken power-law fit with a break at Mpc results in a steeper slope on small scales, with low significance. The slope for a single power-law is for scales Mpc, while it increases to for scales Mpc and decreases to for scales Mpc. Note the significantly different shape of for group galaxies in the mock catalogs, which exhibit a strong break at Mpc. This sharp rise on small scales is not seen in the DEEP2 data. As we will show in the next subsection, this difference between the mock catalogs and the data is not due to any systematic effect from our slitmask algorithm or in our group identification, as the general shape of the correlation function in the mock catalogs is not changed by these. This difference in the clustering of galaxies in groups between the mock catalogs and the data is the first indication that the mock catalogs, which were constructed to match the luminosity function and clustering of all galaxies in the DEEP2 data, do not reproduce additional properties of the data. It appears that the spatial distribution of galaxies in groups is less concentrated in the data than in the mock catalogs. We discuss the implications of this in §9.
We also investigate for group galaxies as a function of color. Fig. 7 shows for galaxies in the DEEP2 data which are identified as belonging to groups and have red or blue colors, defined by the minimum in the color bi-modality in restframe , at . In the group galaxy sample, 20% of group galaxies are red, while for the full galaxy sample 15% of galaxies are red. Corrections for target selection and our group-finder are made using the mock catalogs as above. Red galaxies in groups have a steeper slope in and a higher correlation length than blue galaxies; power-law fits result in Mpc and for blue group galaxies and Mpc and for red group galaxies. The steeper slope for the red galaxy sample implies that red galaxies are more centrally concentrated in their parent dark matter halos; we investigate this more directly in §6. Colors are not currently included in the mock catalogs and so we can not present this measurement for the mock catalogs.
5.2. Effects of Slitmask Target Selection and Group-finder
As for the clustering of groups in the DEEP2 data, mock catalogs are used to quantify systematic errors in our measurements of for each galaxy sample, where real groups are used to define galaxies in groups or in the field. The bottom left panel of Fig. 6 shows measured for all galaxies, group galaxies, and field galaxies in the mock catalogs, before (thin lines without error bars) and after (thick lines with error bars) target selection. Separate power-law least-squares fits to in the mock catalogs are performed for the full galaxy sample and for galaxies in groups and in the field; the results before and after target selection are shown in Table 2. Field galaxies are only affected by the target selection on the very smallest scales, Mpc, and there is no significant change to the correlation function of field galaxies on the scales over which we measure a power-law, Mpc. For the full galaxy sample, our target selection algorithm causes to be slightly underestimated on small scales ( Mpc) due to our inability to target all close neighbors. Before target selection is applied, a power-law fits well for the full galaxy sample on scales Mpc, with a steeper slope on small scales, Mpc. This change in slope on small scales in the mock catalogs is more significant (2.5 vs 1.3) for the sample before target selection than after, due to the smaller error bars for the larger sample. We note that the scale at which the slope changes is larger than predicted by Kravtsov et al. (2004) in their simulations, and that this difference in slope is not seen in the DEEP2 data, as discussed above.
For galaxies in groups, however, the effects of target selection are more complicated; it increases their observed clustering on all scales. In further tests, we find that target selection does not affect the measured clustering of galaxies in mock catalogs known to belong in real groups, so long as the group membership is identified before target selection. However, galaxies can be identified as belonging to a group after target selection only if two or more observed galaxies are in that group. We can identify only half of the groups after target selection that were detectable before target selection, and the groups which are preferentially lost are those with a low richness. This causes for galaxies in groups to be greater when groups are identified after target selection, as only galaxies in the richest, and presumably highest mass and most clustered, groups will be included in the observed sample.
The mock catalogs are also used to investigate the effect of our group-finder on the measured clustering of galaxies in groups, as we want to be sure that our group-finding algorithm is not imposing (even indirectly) a preferred scale for groups, which could potentially artificially cause a change in slope at small scales in for group galaxies. This is tested by comparing the clustering of galaxies in real and recovered groups in the mock catalogs, where both samples have had the DEEP2 target selection algorithm applied. The results are shown in the bottom right panel of Fig. 6, where both real and recovered groups are seen to have an inflection in such that the slope rises on small scales ( Mpc). the group-finder, then, is not imposing this scale on the clustering results. We also find that the group-finder effectively cancels much of the effect of our slitmask target selection, in that for galaxies in recovered groups after target selection is similar to for galaxies in real groups before target selection. The overall correction applied to the observed for group galaxies in the DEEP2 data is therefore small.
Throughout the paper we compare for the DEEP2 data with mock catalogs by applying corrections to the observed correlation function to account for effects of our slitmask target selection and group-finder and compare to results in the mock catalogs before target selection for real groups. None of our results change if instead we compare results for the observed in the data to results in the mock catalogs before target selection for real groups.
5.3. One- and Two-Halo Terms of the Group Galaxy Correlation Function
As it is known which group each of the group galaxies belongs to, we can empirically measure the contribution to from pairs of galaxies in the same or in different groups. This is akin to determining the ‘one-halo’ and ‘two-halo’ terms of in the halo model language, where each group is identified with a single dark matter halo. The total correlation function is then the sum of these two terms:
| (10) |
We calculate the ‘one-halo’ and ‘two-halo’ correlation functions using the following estimators:
| (11) |
| (12) |
where and are pair counts of galaxies within the same group and in different groups, respectively. We then sum these along the line of sight (in the direction, to ) to obtain and . The projected correlation functions sum such that
| (13) |
Fig. 8 shows and for galaxies in groups in both the DEEP2 data (left) and for real groups in the mock catalogs (right). The data have been corrected for effects due to our target slitmask and group-finder algorithms.
In the DEEP2 data the scale at which the ‘one-halo’ and ‘two-halo’ terms intersect is Mpc; the scale in the mock catalogs is Mpc. Exactly where the break occurs between the ‘one-halo’ and ‘two-halo’ terms will presumably depend on the type of groups we are probing; larger groups may have this break at a larger radius. The change in slope seen in for group galaxies in the mock catalogs is easily understood as the scale at which the ‘one-halo’ and ‘two-halo’ terms equally contribute to . However, the ‘one-halo’ term has a very different shape in the DEEP2 data than in the mock catalog, such that galaxies in the data which belong to the same group are not as clustered on small scales as in the mock catalogs. This is likely due the mock catalogs having an incorrect spatial distribution of galaxies within dark matter halos on small scales; we discuss this further in §9.
Yang et al. (2005c) measure for group galaxies in 2dF Galaxy Redshift Survey data at and find that it is not well fit by a single power-law; the ‘one-halo’ term is enhanced relative to the ‘two-halo’ term and there is a rise in on scales Mpc. The strength of the rise depends on the abundance and luminosities of the groups; galaxies in more luminous (and presumably more massive) groups have a larger ‘one-halo’ term and a stronger rise in the slope of on small scales. It is only for the full galaxy population (including field galaxies) that they find a single power-law fit to . For our group sample at , the shape for for galaxies in groups is similar to what is seen by Yang et al. (2005c) for groups with a comparable number density. Yang et al. (2005c) find a small rise in the slope of on scales below Mpc but do not quantify this. Our results at appear to be similar to their findings at , though with larger errors due to our smaller sample size.
6. Group-Galaxy Cross-Correlation Function
In this section we present the cross-correlation function between group centers and the full galaxy sample, which is sensitive to the radial profile of galaxies in and around groups. As with the group and galaxy correlation functions, to avoid redshift-space distortions we measure the projected cross-correlation, . As discussed in §2, errors in the positions of group centers will have some effect on scales Mpc; for this reason we do not plot results for Mpc. However, comparisons between data and mock catalogs are unaffected, as the mock catalogs have been treated in an identical manner as the data.
Fig. 9 shows the projected cross-correlation between group centers and the full galaxy sample in the DEEP2 data (left) and the mock catalogs (right). The left panel shows the observed as a dashed line and the corrected as a solid line, where corrections for target selection and the group-finding algorithm as a function of scale are made using the ratio of in the mock catalogs between real group centers and all galaxies before (solid line, right panel) target selection and between recovered group centers and all galaxies after (dashed line, right panel) target selection. The dotted line in the right panel shows the cross-correlation between real groups and all galaxies after target selection. The target selection algorithm has the effect of increasing the cross-correlation on scales Mpc, while decreasing the amplitude on smaller scales. The small-scale decrease is due to our inability to target galaxies which are in close projection on the plane of the sky; this causes us to undersample close neighbors. On large scales, the effect is due to the slitmask target algorithm affecting which groups we identify; after target selection we lose many of the pairs of galaxies which were identified as groups before such that we preferentially identify the groups with more observed members, which are presumably more massive and therefore more clustered. The effect of the group-finding algorithm is to increase the cross-correlation on scales Mpc, where the group-finder has by definition targetted overdensities in the galaxy distribution.
Comparing the solid lines in the two panels of Fig. 9, which shows for real groups before target selection to the corrected data, the overall shape of the cross-correlation agrees reasonably well, though the amplitude is somewhat higher in the mock catalogs on both small and large scales. This is consistent with what is seen for the correlation function of galaxies in groups shown in Fig. 6, which are more strongly clustered in the mock catalog than in the DEEP2 data.
We also investigate the dependence of the radial distribution of galaxies in groups on galaxy color. Fig. 10 shows the projected cross-correlation function between either red or blue galaxies and group centers, where again the galaxy sample has been split at the bi-modality in the restframe color distribution at . Within groups, on small scales, Mpc, red galaxies are much more strongly clustered than blue galaxies, i.e., red galaxies are preferentially found near the centers of groups. In the DEEP2 data 20% of group galaxies in our sample are red, while 13% of field galaxies and 15% of the full galaxy sample (used in this cross-correlation) are red.
Similar trends are seen at by Yang et al. (2005b), who measure the cross-correlation between group centers and all galaxies in 2dF and SDSS data. They also find a difference between the radial distribution of red and blue galaxies, though it is only apparent for groups with masses , and the differences are smaller than those found here at .
7. Relative Bias Between Groups and Galaxies
Measuring the clustering properties of groups, all galaxies, and galaxies in groups in the DEEP2 data allows us to measure the relative bias between galaxies in groups and all galaxies and between groups and galaxies. Fig. 11 plots the relative bias of group galaxies to the full galaxy sample, which we define as the square root of for group galaxies (dashed lines in Fig. 6) divided by for the full galaxy sample (solid lines in Fig. 6), as a function of scale for Mpc in both the DEEP2 data (top left panel) and the the mock catalogs (bottom left panel), after correcting for target selection and the group-finder. The bias seen between group galaxies and all galaxies is not surprising, as group galaxies reside in more massive dark matter halos. There is a clear scale-dependence to the relative bias between group galaxies and all galaxies in the DEEP2 data, which falls from at Mpc to at Mpc. The mock catalogs have a much higher relative bias on small scales ( Mpc) which does not match the bias seen in the data. This reflects the strong rise in slope of the correlation function of galaxies in groups seen on small scales in the mock catalogs.
The ratio of the group center-full galaxy sample cross-correlation function (Fig. 9) to the galaxy correlation function (solid lines in Fig. 6) provides a measure of the relative bias of groups to galaxies, which is shown on the right side of Fig. 11. We have corrected for slitmask target selection and the group-finder. There is some scale-dependence to the relative bias between groups and galaxies in the DEEP2 data (top right panel) and the weighted mean relative bias is over scales Mpc. The mock catalogs have a mean value of for Mpc, in reasonable agreement with the data, though the mock catalogs again show a higher bias on small scales, below Mpc, and the agreement with the data is better on scales Mpc. These measures of the relative biases of groups to galaxies and galaxies in groups to all galaxies at are further constraints which simulations and galaxy evolution models must match, in addition to measures of for all galaxies and for groups. We discuss the implications of these differences between the data and mock catalogs in the next two sections.
8. Effect of Varying the Halo Model Parameters
The differences seen between the clustering of group galaxies on small scales in the DEEP2 data and the mock catalogs could be due to the mock catalogs having the wrong spatial distribution for galaxies within their parent dark matter halos and/or the wrong HOD, which specifies the probability that a dark matter halo of mass M hosts N galaxies, . To illustrate how much these differences may be due to the HOD used to create the mock catalogs, we investigate the clustering of group galaxies in two mock catalogs with similar number densities and different HODs. In addition to the mock catalog used throughout this paper (labeled as “B256”), we also analyze a mock catalog in which a different HOD was applied to the same dark matter simulation; this model is labeled as “C256” and was chosen as one of the most discrepant HOD models that has an observed for the full galaxy sample that, by design, matches the results for the DEEP2 data published in Coil et al. (2004a). The HODs for galaxies with for these two models are shown in the upper left of Fig. 12, where model B256 is seen to have a lower minimum halo mass hosting a single galaxy, and a steeper slope on larger mass scales ( compared to for the C256 model), which results in having a greater fraction of galaxies residing in massive halos. The curves for galaxies with lower luminosity thresholds have a similar shape and higher amplitude than what is shown here (see Fig. 1 in Yan, White, & Coil (2004)). Mock catalogs made with the C256 model have 35% of galaxies in recovered groups after target selection, similar to what is found for the DEEP2 data (39%), and higher than the value found in the B256 model (27%), even though the C256 model has relatively fewer galaxies in more massive halos. This is due to the parameters of the group-finding algorithm having been tuned to match the observed of the DEEP2 data for km s-1; we have not re-tuned the group-finder to the C256 mock catalogs or our km s-1 cutoff. Both the B256 and C256 mock catalogs have the same number density for the full galaxy sample. The clustering measures shown here have all been corrected for slitmask target effects and the group-finder.
Fig. 12 shows the correlation function for all galaxies (top right panel) and for group galaxies (bottom left panel) in each of the two halo model mock catalogs. The for the full galaxy sample is very similar in the two catalogs; the only differences are on scales less than Mpc, where the C256 model has a slightly higher clustering amplitude. For for group galaxies, the overall shape is similar for the two models but the amplitude in model B256 is higher at all scales, as this model has more galaxies in massive halos, such that the group galaxies will be more clustered. These figures show that the amplitude of the group galaxy correlation function adds an additional constraint on the HOD, which is not gained from the correlation function of all galaxies alone. It also shows that the general shape of the group galaxy correlation function, and in particular, the rise in slope on small scales, is not sensitive to the parameters of the HOD used.
The bottom right panel of Fig. 12 presents the cross-correlation function of group centers and all galaxies in both mock catalogs. Here there is a difference in the shape of the cross-correlation on small scales for the different HODs. The C256 model has a lower amplitude than the B256 model over almost all scales but shows a distinct rise on the smallest scales, Mpc, which is not seen in the B256 model. Indeed, both the correlation function for all galaxies and the group-galaxy cross-correlation function in the C256 model show a rise on small scales that is not seen in the B256 model; this results from the C256 model having preferentially more galaxies in smaller mass halos which dominate the pair counts at small separations.
Results from the DEEP2 data are also compared to the different halo model mock catalogs in Fig. 12. By design, for all galaxies matches both mock catalogs well, though the data do not show the rise on the smallest scales that is seen for the C256 model. The shape of the correlation function for group galaxies in the DEEP2 data does not match either of the halo model mock catalogs; the data show a significantly shallower slope on small scales. The amplitude of the cross-correlation function agrees better with the B256 model than the C256 model, and the shape of the cross-correlation disagrees with the C256 model on small scales. The significant difference in for group galaxies on small scales is presumably due to a difference in the spatial distribution of galaxies in groups in the data and the mock catalogs, as it does not appear to be reconcilable by altering the HOD. This implies that the spatial distribution of galaxies in groups in the mock catalogs is incorrect. This will be discussed further in the next section.
We note that if the C256 mock catalogs had been used to correct the observed for the full DEEP2 galaxy sample and galaxies in groups as presented in Fig. 6 for slitmask target effects, none of our conclusions in the paper would change, as the relative differences before and after target selection are similar in the two mock catalogs. The differences for all DEEP2 galaxies if using the C256 mock catalogs to correct for target selection effects are negligable, well within the errors quoted in Table 2. The differences for group galaxies are within the errors, with both the corrected and being lower ( Mpc and ), and there is still no significant difference in the slope of on small and large scales in the DEEP2 data.
9. Discussion and Conclusions
Groups bridge the gap between galaxies and clusters in both mass and scale, and are also the likely locations of galaxy mergers. Measurements of the clustering of groups can constrain cosmological parameters, and measurements of the clustering of galaxies in groups can constrain both halo model parameters and the spatial profile of galaxies in their parent dark matter halos. Here we present the first results on the clustering of groups and galaxies in groups at . We measure four types of correlation function statistics in the DEEP2 dataset: 1) the group correlation function, 2) the galaxy correlation for the full galaxy sample, 3) the galaxy correlation function for galaxies in groups, and 4) the group-galaxy cross-correlation function. The first clustering measure probes the dark matter halo-halo correlation function on mass scales of galaxy groups, which is well-understood from dark matter simulations alone. The clustering of groups in the DEEP2 data at matches predictions for a CDM cosmology and is used to estimate the typical dark matter masses of the halos the groups studied reside in.
The second clustering measure, the galaxy correlation function for the full DEEP2 galaxy sample, is an update on results using early DEEP2 data presented in Coil et al. (2004a). Here we present this measurement for the full galaxy sample using a much larger dataset, with over four times as many galaxies covering three fields in the sky; the statistical error on is now 2%. We show that for the full galaxy sample provides constraints on the halo occupation distribution (HOD), the number of galaxies that reside in a dark matter halo of a given mass), though not in an unique way. There is some leeway in how halos can be populated which results in a correlation function that matches our measurements, as shown in the upper right panel of Fig. 12.
The third clustering measure, the correlation function of galaxies in groups, is similar to the second but is restricted to galaxies in more massive halos, as measuring the clustering of galaxies in groups is sensitive to a higher halo mass range than for the full galaxy sample. The contribution from the ‘one-halo’ term is necessarily higher for galaxies in groups as these galaxies are identified as belonging in halos with several other galaxies. This provides further constraints on the halo model parameters than those from the measurement of for all galaxies alone. We also find that red galaxies in groups have a steeper slope and higher clustering amplitude than blue galaxies in groups.
The fourth clustering measure, group-galaxy cross-correlation function, reflects the spatial distribution of galaxies within dark matter halos above a given mass, and depends as well upon the parameters of the halo model. We find using the group center-galaxy cross-correlation function that red galaxies are found preferentially in the centers of groups compared to blue galaxies, which has also been seen locally (Collister & Lahav, 2005; Yang et al., 2005b). We find that this trend is in place at .
All four of these measurements are compared to mock catalogs constructed from N-body simulations and depend differently on, and can therefore simultaneously constrain, both parameters of the halo model and the spatial profile of galaxies within halos. Comparing these clustering measurements in the DEEP2 data with the mock catalogs of Yan, White, & Coil (2004), three of the four measures agree fairly well with the simulations, with the exception of the correlation function for galaxies in groups. The clustering amplitude for the full galaxy sample roughly matches the mock catalogs; this is by design: the catalogs were constructed with an HOD that is consistent with earlier DEEP2 clustering results for all galaxies. The HOD used is not uniquely determined however; the observed for the full DEEP2 galaxy sample can be matched with substantially different HODs (two samples are shown in the upper left panel of Fig. 12). We leave an improved HOD reconstruction from for the full galaxy sample for a future paper, where we will study the clustering as a function of galaxy properties such as luminosity, color, redshift, etc., in volume-limited samples; here we focus on comparing the clustering of galaxies in groups to all galaxies and the different constraints they provide on the HOD. We do note that for all galaxies is fit by a single power-law on scales Mpc, with and .
While the mock catalogs have similar projected clustering for the full galaxy population to the DEEP2 data by design, there is a strong discrepancy in the clustering of galaxies in groups. The DEEP2 data do not show a significant rise in the slope of on small scales, for either group galaxies or the full galaxy sample (upper panels of Fig. 6). In contrast, our mock catalogs have a very strong rise on small scales for for group galaxies, though not for the full galaxy sample (bottom panels of Fig. 6). To test whether this discrepancy can be accounted for by the halo model parameters used, we analyze mock catalogs constructed with a different HOD but similar clustering for the full galaxy sample (Fig. 12). We find that there is still a rise in slope for the clustering of galaxies in groups in the second mock catalogs (model C256) which is not seen in the data. This result is unaffected by our definition of the group center.
The slope of for group galaxies on small scales should depend quite sensitively on the spatial distribution of galaxies within dark matter halos. We therefore conclude that there is a difference in the spatial distribution of galaxies within their parent dark matter halos in the DEEP2 data and our mock catalogs. The mock catalogs assume no spatial bias, except for the assumption of a central galaxy; the most luminous galaxy in a halo is placed at the center of the halo, while all subsequent galaxies are assigned to random dark matter particles, following an NFW profile. Assuming that the brightest galaxy occupies the very center of the halo is likely not to be correct, as groups at are not expected to have a large, dominant, bright galaxy in their centers. This assumption will result in a higher correlation function on small scales.
In our mock catalogs the satellite galaxies are assumed to follow the same NFW profile as the dark matter particles; this appears to not be the correct spatial profile for the galaxy population at . There is evidence in both simulations and data at that satellite galaxies do not follow the same spatial profile as the dark matter particles. Simulations have found that subhalos have a shallower spatial profile than the dark matter particles at (e.g., Gao et al., 2004; Diemand, Moore, & Stadel, 2004; Nagai & Kravtsov, 2005), though exactly how galaxies are related to subhalos is still not entirely known. Observationally, several authors have measured the spatial profiles of galaxies in groups in data at . Using the Two Micron All Sky Survey, Lin, Mohr, & Stanford (2004) stack groups and clusters to measure the radial mass-to-light profile and find that galaxies are less concentrated in the centers of groups and clusters than the dark matter. Collister & Lahav (2005) use the 2dF 2PIGG group catalog to directly measure the radial profile of galaxies within groups and find that galaxies are less centrally concentrated than what is seen for dark matter particles in simulations. Similar results are found by Hansen et al. (2005) for clusters in SDSS, and by Diaz et al. (2005) and Yang et al. (2005b) for groups in SDSS and 2dF.
The cross-clustering between groups and galaxies matches the mock catalogs well on scales Mpc; on smaller scales the mock catalogs have a slightly steeper slope. The cross-correlation between groups and galaxies is linearly proportional to the radial distribution of galaxies in groups, while the correlation of group galaxies is proportional to the second power of the radial distribution; this may be why the shape agreement between the data and the mock catalogs is better for the cross-correlation than for the correlation of group galaxies. The group-galaxy cross-correlation function can also be affected by uncertainties in the location of the center of each group which can dilute the signal on small scales, unlike for the correlation function of galaxies in groups. Yang et al. (2005b) find that the cross-correlation between group centers and galaxies at in 2dF and SDSS data is lower on scales Mpc than in their mock catalogs, which do not have a spatial bias with respect to the dark matter distribution. They create a series of mock catalogs with NFW profiles for the galaxies with lower concentration parameters, , than in the dark matter and find that catalogs with concentration values of about one-third the value for the dark matter halos match their data well. These mock catalogs show the same trend which is required here, namely a lower cross-correlation on small scales of Mpc.
We show here that the clustering properties of galaxies in groups can be used to break degeneracies among different HODs that can not be distinguished by the clustering of all galaxies alone. We find that galaxies in the DEEP2 data do not have the same spatial profile as in our mock catalogs, which assumes a central galaxy surrounded by satellite galaxies following an NFW profile. Using the clustering statistics presented in this paper will allow us to now construct more realistic mock catalogs for the DEEP2 survey that have a better constrained HOD and radial profile for galaxies within dark matter halos.
References
- Bahcall (1988) Bahcall, N. A. 1988, ARA&A, 26, 631
- Barnes (1985) Barnes, J. 1985, MNRAS, 215, 517
- Coil et al. (2004a) Coil, A. L., et al. 2004a, ApJ, 609, 525
- Coil et al. (2004b) Coil, A. L., Newman, J. A., Kaiser, N., Davis, M., Ma, C., Kocevski, D. D., & Koo, D. C. 2004b, ApJ, 617, 765
- Collister & Lahav (2005) Collister, A. A., & Lahav, O. 2005, Accepted to MNRAS (astro-ph/0412516)
- Cooray & Sheth (2002) Cooray, A., & Sheth, R. 2002, Phys. Rep., 372, 1
- Davis et al. (2002) Davis, M., et al. 2002, Proc. SPIE, 4834, 161 (astro-ph 0209419)
- Davis & Huchra (1982) Davis, M., & Huchra, J. 1982, ApJ, 254, 437
- Davis & Peebles (1983) Davis, M., & Peebles, P. J. E. 1983, ApJ, 267, 465
- Davis, Gerke, & Newman (2004) Davis, M., Gerke, B. F., & Newman, J. A. 2004, In Proceedings of ”Observing Dark Energy: NOAO Workshop”, Mar 18-20, 2004
- Diaz et al. (2005) Diaz, E., Zandivarez, A., Merchan, M., & Muriel, M. 2005, Accepted to ApJ (astro-ph/0504457)
- Diemand, Moore, & Stadel (2004) Diemand, J., Moore, B., & Stadel, J. 2004, MNRAS, 352, 535
- Faber et al. (2002) Faber, S., et al. 2002, Proc. SPIE, 4841, 1657
- Faber et al. (2005) Faber, S., et al. 2005, in preparation
- Fisher et al. (1994) Fisher, K. B., et al. 1994, MNRAS, 267, 927
- Gao et al. (2004) Gao, L., De Lucia, G., White, S. D. M., & Jenkins, A. 2004, MNRAS, 352, L1
- Gerke et al. (2005) Gerke, B. F., et al. 2005, ApJ, 625, 6
- Girardi, Boschin, & da Costa (2000) Girardi, M., Boschin, W., & da Costa, L. N. 2000, A&A, 353, 57
- Hamilton (1993) Hamilton, A. J. S. 1993, ApJ, 417, 19
- Hansen et al. (2005) Hansen, S., McKay, T., Wechsler, R., Annis, J., Sheldon, E., & Kimball, A. 2005, Submitted to ApJ (astro-ph/0410467)
- Jing & Zhang (1988) Jing, Y., & Zhang, J. 1988, A&A, 190, L21
- Kaiser (1984) Kaiser, N. 1984, ApJ, 284, L9
- Kerscher, Szapudi, & Szalay (2000) Kerscher, M., Szapudi, I., & Szalay, A. S. 2000, ApJ, 535, L13
- Kravtsov et al. (2004) Kravtsov, A. V., Berlind, A. A., Wechsler, R. H., Klypin, A. A., Gottlöber, S., Allgood, B., & Primack, J. R. 2004, ApJ, 609, 35
- Landy & Szalay (1993) Landy, S. D., & Szalay, A. S. 1993, ApJ, 412, 64
- Lima & Hu (2004) Lima, M., & Hu, W. 2004, Phys. Rev. D, 70, 043504
- Lin et al. (2004) Lin, L., et al. 2004, ApJ, 617, L9
- Lin, Mohr, & Stanford (2004) Lin, Y., Mohr, J. J., & Stanford, S. A. 2004, ApJ, 610, 745
- Ma & Fry (2000) Ma, C., & Fry, J. N. 2000, ApJ, 543, 503
- Maia & da Costa (1990) Maia, M. A. G., & da Costa, L. N. 1990, ApJ, 349, 477
- Majumdar & Mohr (2004) Majumdar, S., & Mohr, J. J. 2004, ApJ, 613, 41
- Marinoni et al. (2002) Marinoni, C., Davis, M., Newman, J. A., & Coil, A. L. 2002, ApJ, 580, 122
- Merchán, Maia, & Lambas (2000) Merchán, M. E., Maia, M. A. G., & Lambas, D. G. 2000, ApJ, 545, 26
- Mo & White (2002) Mo, H. J., & White, S. D. M. 2002, MNRAS, 336, 112
- Nagai & Kravtsov (2005) Nagai, D., & Kravtsov, A. V. 2005, ApJ, 618, 557
- Newman et al. (2002) Newman, J. A., Marinoni, C., Coil, A. L., & Davis, M. 2002, PASP, 114, 29
- Ostriker (1980) Ostriker, J. P. 1980, Comments on Astrophysics, 8, 177
- Padilla et al. (2004) Padilla, N. D., et al. 2004, MNRAS, 352, 211
- Peacock & Smith (2000) Peacock, J. A., & Smith, R. E. 2000, MNRAS, 318, 1144
- Peebles (1980) Peebles, P. J. E. 1980. The Large-Scale Structure of the Universe, Princeton, N.J., Princeton Univ. Press
- Phleps et al. (2005) Phleps, S., Peacock, J. A., Meisenheimer, K., & Wolf, C. 2005, submitted to A& A (astro-ph/0506320)
- Ramella, Geller, & Huchra (1990) Ramella, M., Geller, M. J., & Huchra, J. P. 1990, ApJ, 353, 51
- Seljak (2000) Seljak, U. 2000, MNRAS, 318, 203
- Sheth & Tormen (1999) Sheth, R. K., & Tormen, G. 1999, MNRAS, 308, 119
- Trasarti-Battistoni, Invernizzi, & Bonometto (1997) Trasarti-Battistoni, R., Invernizzi, G., & Bonometto, S. A. 1997, ApJ, 475, 1
- Willmer et al. (2005) Willmer, C., et al. 2005, submitted to ApJ, astro-ph/0506041
- Yan, Madgwick, & White (2003) Yan, R., Madgwick, D. S., & White, M. 2003, ApJ, 598, 848
- Yan, White, & Coil (2004) Yan, R., White, M., & Coil, A. L. 2004, ApJ, 607, 739
- Yang et al. (2005a) Yang, X., Mo, H. J., Jing, Y. P., & van den Bosch, F. C. 2005a, MNRAS, 358, 217
- Yang et al. (2005b) Yang, X., Mo, H. J., van den Bosch, F. C., Weinmannn, S. M., Li, C., & Jing, Y. P. 2005b, submitted to MNRAS (astro-ph/0504477)
- Yang et al. (2005c) Yang, X., Mo, H. J., van den Bosch, F. C., & Jing, Y. P. 2005c, MNRAS, 357, 608
- Zandivarez, Merchán, & Padilla (2003) Zandivarez, A., Merchán, M. E., & Padilla, N. D. 2003, MNRAS, 344, 247
| Sample | No. of | Observed | Corrected | ||
|---|---|---|---|---|---|
| groups | |||||
| Mpc | Mpc | ||||
| DEEP2 data | |||||
| 460 | |||||
| 204 | |||||
| Mock Catalog | |||||
| Recovered | 395 | ||||
| Real | 281 | ||||
| Before Target Selection | 527 |
| Sample | No. of | range | Observed | Corrected | ||
|---|---|---|---|---|---|---|
| galaxies | ||||||
| Mpc | Mpc | Mpc | ||||
| DEEP2 data | ||||||
| Group galaxies | 3840 | |||||
| Red group galaxies | 794 | |||||
| Blue group galaxies | 3046 | |||||
| All galaxies | 9787 | |||||
| Field galaxies | 5947 | |||||
| Mock Catalogs (B256) | ||||||
| Group galaxies | 3020 | |||||
| All galaxies | 11262 | |||||
| Field galaxies | 8242 | |||||