Infrared Spectral Energy Distributions of Nearby Galaxies
Abstract
The Spitzer Infrared Nearby Galaxies Survey (SINGS) is carrying out a comprehensive multi-wavelength survey on a sample of 75 nearby galaxies. The 1-850 µm spectral energy distributions are presented using broadband imaging data from Spitzer, 2MASS, ISO, IRAS, and SCUBA. The infrared colors derived from the globally-integrated Spitzer data are generally consistent with the previous generation of models that were developed based on global data for normal star-forming galaxies, though significant deviations are observed. Spitzer’s excellent sensitivity and resolution also allow a detailed investigation of the infrared spectral energy distributions for various locations within the three large, nearby galaxies NGC 3031 (M 81), NGC 5194 (M 51), and NGC 7331. A wide variety of spectral shapes is found within each galaxy, especially for NGC 3031, the closest of the three targets and thus the galaxy for which the smallest spatial scales can be explored. Strong correlations exist between the local star formation rate and the infrared colors and , suggesting that the 24 and 70 m emission are useful tracers of the local star formation activity level. Preliminary evidence indicates that variations in the 24 m emission, and not variations in the emission from polycyclic aromatic hydrocarbons at 8 m, drive the variations in the colors within NGC 3031, NGC 5194, and NGC 7331. If the galaxy-to-galaxy variations in spectral energy distributions seen in our sample are representative of the range present at high redshift then extrapolations of total infrared luminosities and star formation rates from the observed 24 m flux will be uncertain at the factor-of-five level (total range). The corresponding uncertainties using the redshifted 8.0 m flux (e.g. observed 24 m flux for a source) are factors of 10–20. Considerable caution should be used when interpreting such extrapolated infrared luminosities.
1 Introduction
Emission from interstellar dust comprises a wide-ranging portion of the overall energy budget in galaxies, ranging from typically a few percent for ellipticals (Xilouris et al. 2004), to tens of percent for normal star-forming galaxies (Dale et al. 2000), to greater than 95 percent for many Ultraluminous Infrared Galaxies (Soifer et al. 1984). To take advantage of this energetically-important view of galaxies, many current and planned instruments are pushing infrared, submillimeter, and millimeter astronomy into new sensitivity regimes. Increasingly deep cosmological surveys carried out at these long wavelengths are already revealing a rich diversity of spectral energy distributions (SEDs) at every redshift (e.g. Yan et al. 2004; Rowan-Robinson et al. 2005). In order to exploit these surveys to their full potential, it is paramount to empirically characterize the details of individual galaxy infrared SEDs and their broad characteristics for a diverse sample of galaxies.
The 75 galaxies studied in detail in the SINGS Legacy Science Program represent a fair sampling of the range of galaxies found in the Local Universe (Kennicutt et al. 2003). The suite of Spitzer Space Telescope cosmology surveys, on the other hand, will produce vast catalogs of infrared-bright sources at much larger distances. Tremendous advances in the understanding of galaxy infrared SEDs could potentially be made with such huge catalogs. However, due to sensitivity and confusion limitations, these surveys will not constrain the far-infrared fluxes for most sources (the initial SWIRE catalog has detections at 70 and 160 m for only 0.7% of its sources with photometric redshifts; Rowan-Robinson et al. 2005), whereas most SINGS targets will have robust detections at near-, mid-, and far-infrared wavelengths in addition to submillimeter data for a third of the sample. In other words, though it only comprises 75 targets, the broad multi-wavelength coverage for the SINGS sample should enable unique advances in SED understanding. In addition, inferring a galaxy’s total infrared luminosity from just 24 m or 24+70 m measurements alone would be useful to cosmology surveys, and the collection of SINGS SEDs make it possible to calibrate these extrapolations and quantify the uncertainties involved. Finally, another important advantage to the SINGS sample lies in its proximity. The unprecedented combination of Spitzer sensitivity and angular resolution, coupled with the nearness of the SINGS targets, will enable us to learn about differences in the infrared SEDs as a function of the local (sub-kpc to kpc) environment. The various cosmological efforts being pursued via the Spitzer Space Telescope will profit from this compilation of SINGS infrared spectra.
The focus of this study is to make a preliminary exploration of the broad variations of SINGS 1-850 m SEDs using both globally-integrated data and data stemming from smaller spatial scales within galaxies. A complementary study of SINGS infrared spectra will concentrate on a narrower wavelength range to quantify the variations observed in the mid-infrared spectral shapes.
2 The Sample
The full SINGS sample is described in Kennicutt et al. (2003). Mid- and far-infrared images are now becoming available for a good portion of the SINGS sample. The galaxies chosen for study in this work are simply those first SINGS galaxies with Spitzer mid- and far-infrared broadband data in hand. The sample spans a wide range in the infrared/optical ratio and morphological type. In this work we also present results on the infrared SEDs for various locations within three SINGS galaxies: NGC 3031 (M 81), NGC 5194 (M 51), and NGC 7331. These three galaxies span large enough solid angles to allow many local environments to be explored. Figures 1 and 2 indicate the particular regions selected for analysis in each galaxy overlaid on (unsmoothed) 8.0 m images. Apertures were selected using 8.0 and 24 m images. The diameter of each aperture is at least as large as 38″, the Full Width at Half Maximum (FWHM) of the poorest resolution Point Spread Function in the dataset (i.e. the 160 m beam). Each image was smoothed to the 160 m resolution before fluxes were extracted (§ 4.2). “Nuclear” apertures are centered on the brightest central location; “arm” regions follow the bright regions of the spiral patterns; “inter-arm” regions sample the diffuse emission between spiral arms; “inner disk” and “outer disk” apertures are centered on areas that appear to be a combination of arm and inter-arm regions.
3 Observations and Data Reduction
The broad scope of the SINGS imaging program is described in Kennicutt et al. (2003), though a few modifications have since been incorporated, based on our initial validation data for NGC 7331 (e.g. Regan et al 2004). In brief, mid-infrared mosaics centered on each source are executed for all four IRAC channels (Fazio et al. 2004). The mosaics are large enough and deep enough to detect, on average, emission out to the optical radius , in addition to providing generous sky coverage for excellent measurements of the background/foreground sky. The removal of asteroids and detector artifacts is enabled via a second mapping that typically occurs a few days after the first visit. The Basic Calibrated Data images have been processed with the standard SINGS IRAC pipeline. The final pixel scale is 075.
All of the 24, 70, and 160 m images are being obtained in the MIPS scan mode (Rieke et al. 2004). As with the IRAC imaging strategy, the MIPS maps are large enough to detect emission out to the optical radius, there is sufficient sky coverage, and asteroid removal is enabled via two separate passes at each source. The final pixel scales are 075, 30, and 60 at 24, 70, and 160 m, respectively. These pixel scales allow us to finely sample the point spread function at each wavelength and were chosen to match (or be an integer multiple of) the IRAC pixel scale. The MIPS data were processed using the MIPS Instrument Team Data Analysis Tool (Gordon et al. 2005). Note that the MIPS data processing has evolved since our validation work on NGC 7331; removal of stimflash latent images in the 70 m data were only performed for NGC 7331, for example. Further details of the MIPS data reduction procedures can be found in Bendo et al. (2005).
Foreground stars (and obvious background galaxies) were edited from each IRAC and MIPS image before flux extraction was performed. Foreground stars were identified for this process by examining and color images. Global flux densities are extracted from apertures that cover the entire optical disk (see Table 1). The same apertures are used to measure flux densities in all MIPS and IRAC wavebands. Sky subtraction was carried out through the use of multiple sky apertures placed near the source, yet do not overlap with the faintest isophotes visible from the galaxy. Statistical uncertainties related to sky subtraction are usually less than 1%, but can be appreciable (tens of percent) for faint sources. Systematics in the IRAC calibration result in fluxes uncertain at the 10% level (see Table 2). The uncertainties in the MIPS fluxes are also dominated by the uncertainties in the calibration: 10% at 24 m and 20% at 70 and 160 m. The uncertainties listed in Table 1 include both systematic and statistical uncertainties. No aperture corrections have been applied to the IRAC fluxes listed in Table 1, nor in the plots throughout this work. Aperture corrections for extended sources are still unknown and none of our conclusions would rely on such small changes (estimated to be between 4% and 25% in Pahre et al. 2004).
Submillimeter maps have been obtained with SCUBA for 27 SINGS galaxies, including 25 of the 71 in the present sample (Holland et al. 1999). Thirteen of the maps were taken by us in jiggle map mode, whereas 14 of the maps are archival jiggle or scan maps. Depending on the galaxy size, the maps run from 3′ to several arcminutes in extent. The maps are large enough to capture essentially all of the submillimeter emission for the galaxies in this work except for those listed in Table 3 with aperture correction factors. Based on the fractional MIPS flux contained within apertures similar to the submillimeter map sizes and assuming no far-infrared-submillimeter color gradients, for these galaxies it is likely that we have only detected 45-90% of the total submillimeter emission. The submillimeter fluxes listed in Table 3 have been corrected by the multiplicative factors in the same table. The data were processed with the SCUBA User Reduction Facility (Jenness & Lightfoot 1998). The data were first flatfielded and corrected for atmospheric extinction. Contributions from noisy bolometers were then removed, followed by spike removal. For the jiggle maps the background signal was subtracted using the signal from several bolometers along the edges of the maps (the SCUBA maps are large enough to include sky for all galaxies except for NGC 5033; the sky estimation for this galaxy is suspect). For the scan maps the signal baseline and sky background were removed and then the data were calibrated, grouped according to chop throw and angle, and regridded. The data were then smoothed with a 9″ Guassian beam and combined together using the remdbm procedure in SURF. A residual background was subtracted by smoothing the map with a boxcar function 150-300″ in size and then subtracting the smoothed map from the original. Note that this step may additionally subtract some diffuse, extended emission. Further details of the submillimeter data processing can be found in Bendo et al. (2005). The data were calibrated using observations of submillimeter standards and regridded onto the sky plane. The calibration of the 450 m and 850 m fluxes are uncertain at the 25% and 15% levels, respectively.
Archival near-infrared, mid-infrared, and far-infrared data are used to supplement the Spitzer and SCUBA data, where available. The 2MASS near-infrared fluxes used in this study are the total fluxes listed in the NASA/IPAC Extragalactic Database and are obtained by extrapolating the near-infrared surface brightness profiles out to about five disk scale lengths (see Jarrett et al. 2003). Fluxes from the 2MASS All-Sky Extended Source Catalog exist for all but the six faintest of the 75 SINGS galaxies. For these six sources we have extracted 2MASS fluxes using the same apertures used to determine IRAC and MIPS fluxes. Flux uncertainty is at the 5% level. Archival 6.8 and 15 m fluxes (ISOCAM) are taken from Dale et al. (2000) and Roussel et al. (2001) for 13 SINGS galaxies. In addition, we have extracted 6.8 and 15 m fluxes from archival ISOCAM data for another eight sources. ISOCAM fluxes are typically 20% uncertain, though this percentage can substantially rise for very faint sources like Holmberg II. Finally, IRAS fluxes, accurate to 20% and obtained from SCANPI and HIRES data, are available in at least one wavelength for all but three SINGS targets.
H imaging was obtained for NGC 3031, NGC 5194, and NGC 7331 at the Kitt Peak National Observatory 2.1 m telescope in March 2001 (NGC 3031 and NGC 5194) and November 2001 (NGC 7331). Integrations were 1800 s for the narrowband imaging and 420 s for the R band imaging that was used for continuum subtraction. Single pointings of the 104 field of view (03 pixel-1) were sufficient to capture the H emission for NGC 7331, but mosaics were necessary to encompass the large angular diameters of NGC 3031 and NGC 5194. Flux calibration was obtained through observations of spectrophotometric sources from Massey et al. (1998). The data were processed using standard IRAF routines. A correction for [N II] in these relatively metal-rich galaxies was made assuming a uniform value of [N II]/H (Hoopes & Walterbos 2003). Fluxes were further corrected for internal extinction (assuming 1 mag; e.g. Kennicutt 1998) and foreground Milky Way extinction (Schlegel, Finkbeiner, & Davis 1998). The overall uncertainty in the H fluxes, including systematics, is estimated to be 25%.
4 Results
4.1 Global Infrared-Submillimeter Spectral Energy Distributions
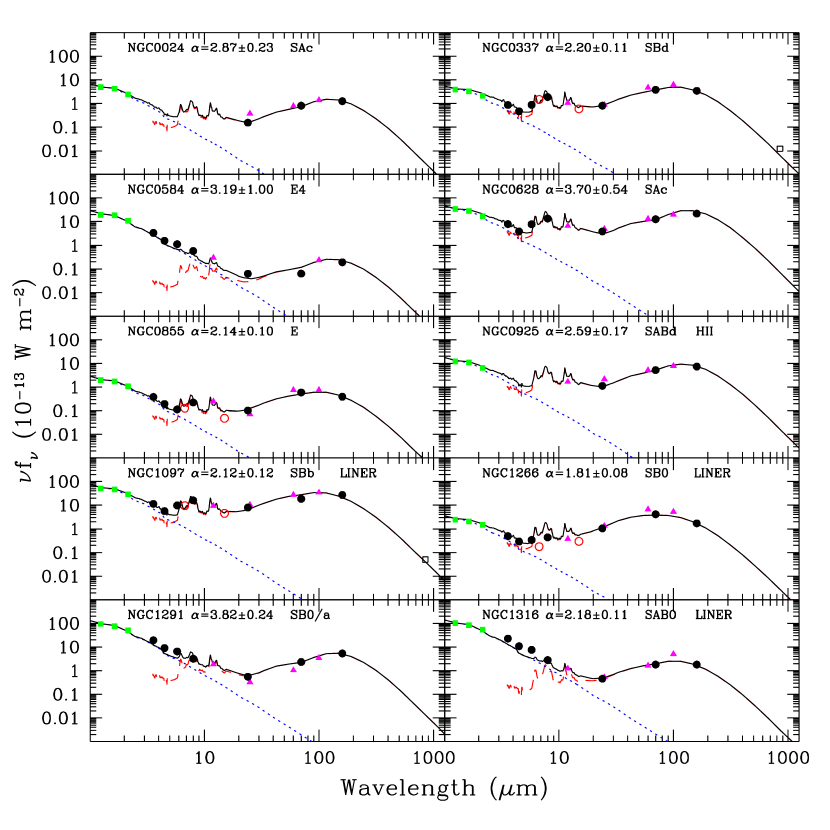
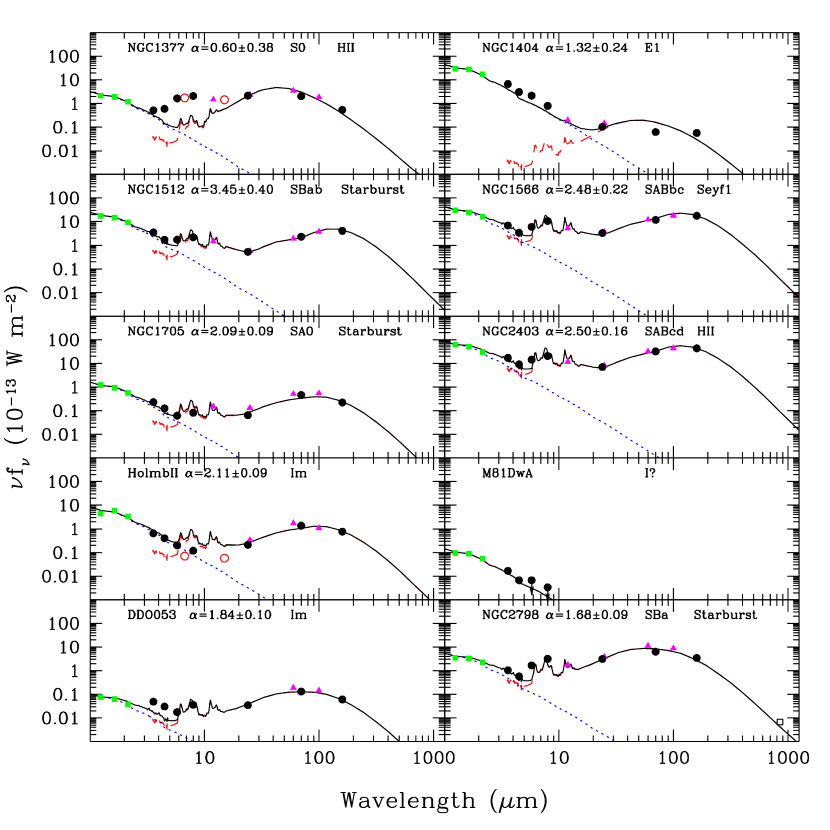
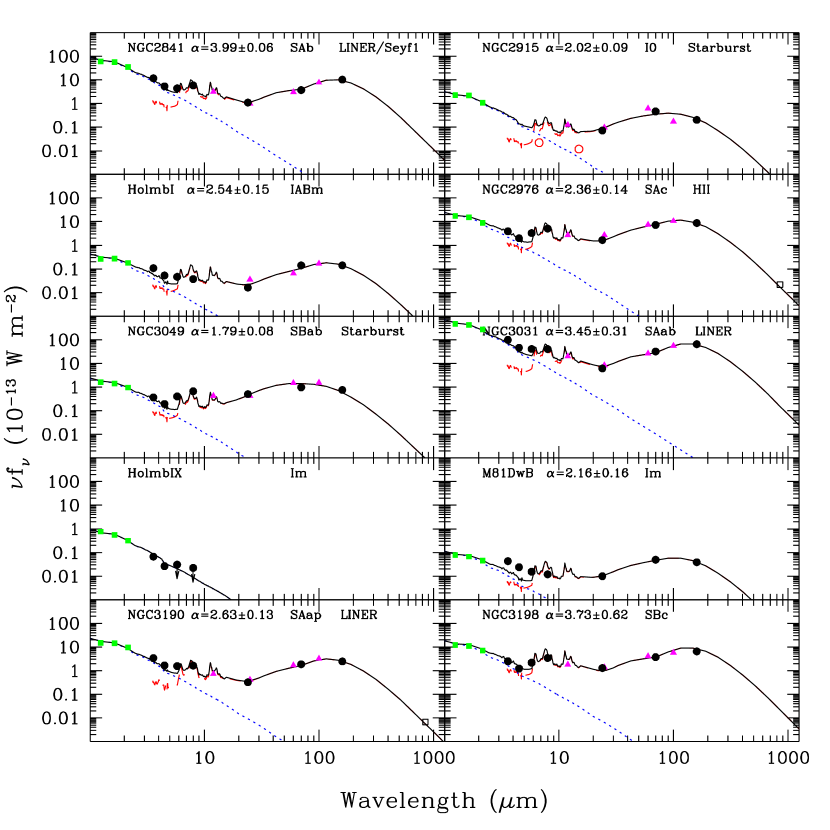
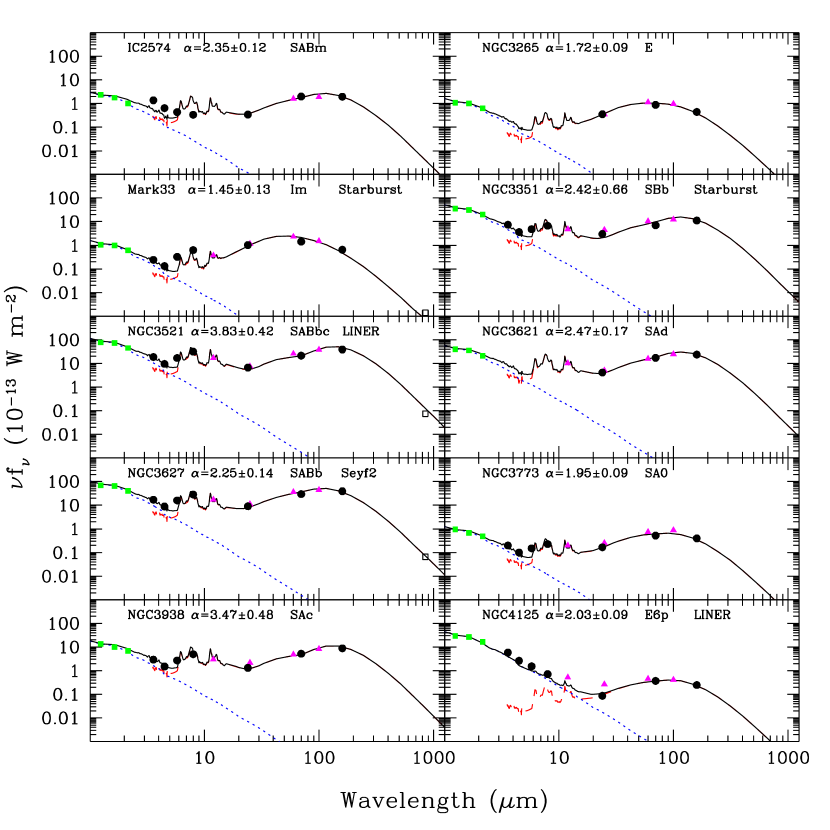
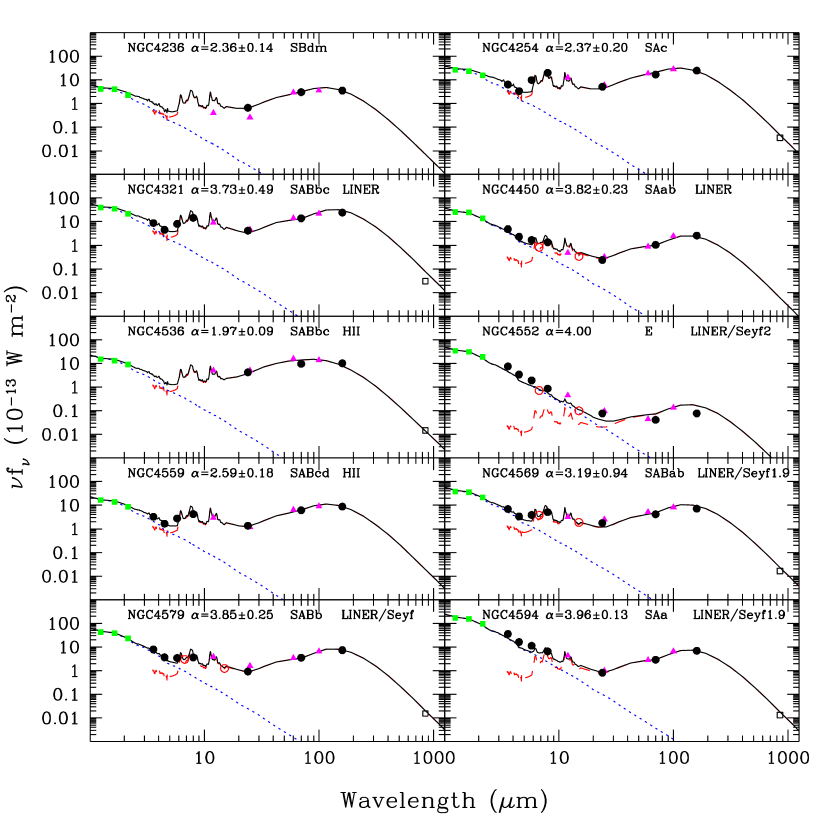
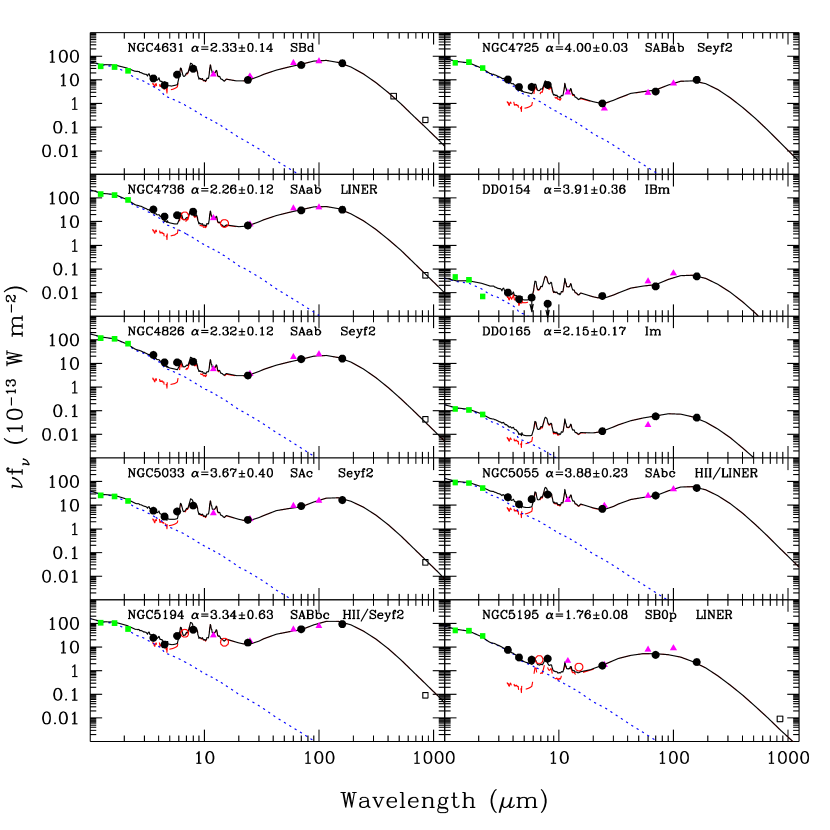
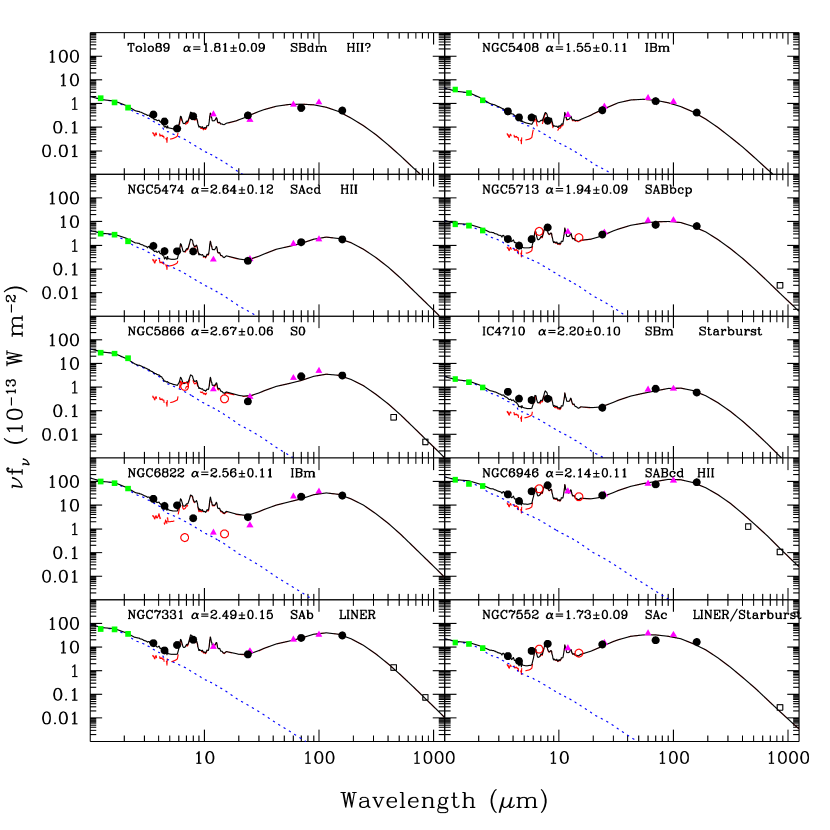
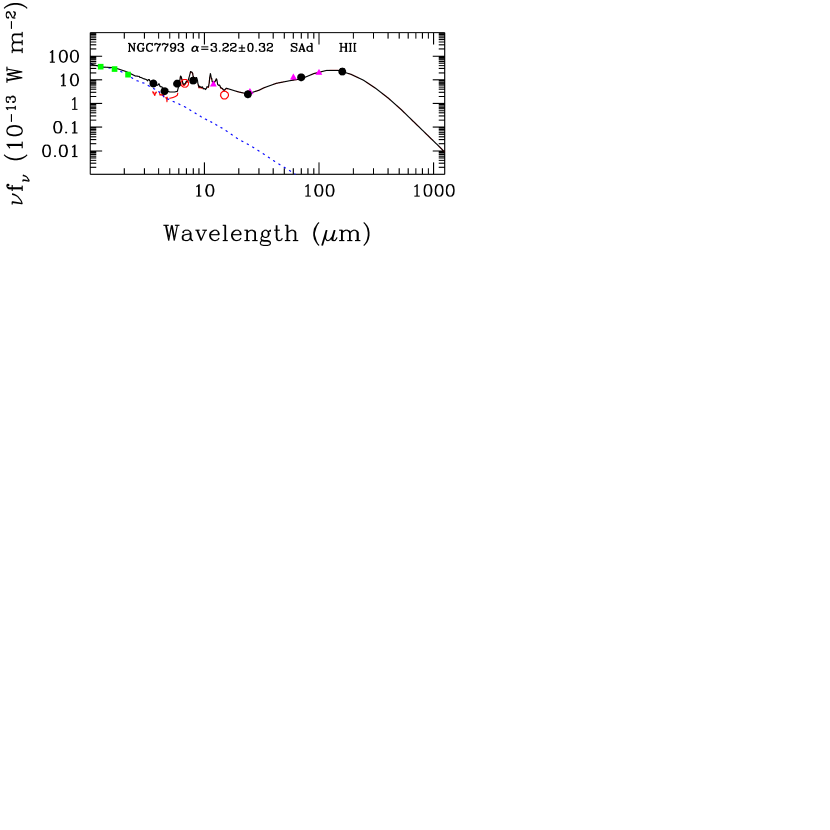
Figures 3-10 show the infrared data for each galaxy; 2MASS, IRAS, ISO, and SCUBA data are shown where available. Included in each plot are two model curves and their sum. The dashed curve is a dust-only model from the semi-empirical work of Dale & Helou (2002) on normal star-forming galaxies. The dust-only templates have the advantage of being parametrized by a single parameter family, essentially defined by the far-infrared color. The listed within each panel parametrizes the distribution of dust mass as a function of local heating intensity
| (1) |
The dust curve () is computed for each galaxy via 10,000 Monte Carlo simulations of a least-squares fit to the MIPS data. For each simulation we add a random component to the MIPS fluxes, Gaussian-scaled by the fluxes’ uncertainties. The average and its dispersion is given in each panel. We have likewise adopted a conceptually simple approach for the stellar template. The dotted curve is the 900 Myr continuous star formation, solar metallicity, Salpeter IMF () curve from Vazquez & Leitherer (2005) fitted to the 2MASS fluxes. Though our current approach is mostly illustrative and avoids a more sophisticated suite of multi-parameter dust and stellar models, it is remarkable how well the data are generally fit by such a simple combination. Note that for a few galaxies the far-infrared emission appears to peak at a wavelength that is slightly longer than that in the most quiescent dust model (i.e. ). The dust-only models will be updated, and a more refined approach will be pursued for the stellar profiles, once all the SINGS data are in hand. Finally, we note that the mid-infrared data for NGC 1377 are quite discrepant from the model predicted by the far-infrared fluxes. Roussel et al. (2003) suggest that NGC 1377 is in the initial throes of an intense starburst, and that this heavily extincted system is being observed at such an early stage of the star formation that it is yet to show any optical signatures or synchrotron radiation. The unusual mid-infrared properties of NGC 1377 are studied in detail by Roussel et al. (in preparation).
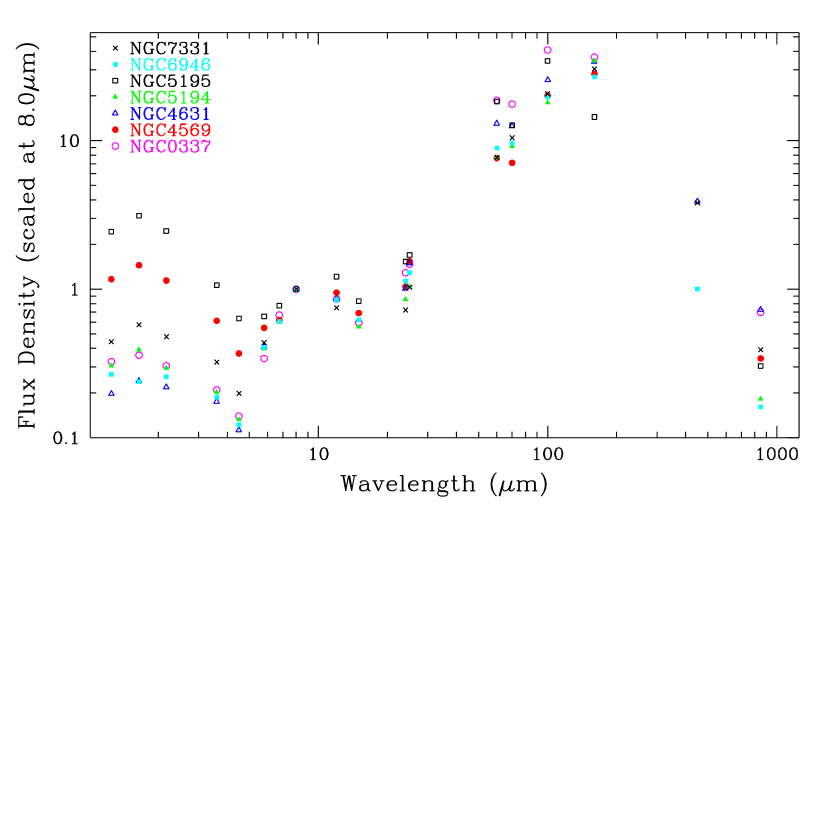
Information on our collection of infrared spectra can be more compactly displayed in a single SED plot and in an infrared color-color diagram. The examples presented in Figure 11 portray the variety of spectral shapes in the SINGS sample. Arbitrarily normalizing the spectra at 8.0 m emphasizes the significant dispersion in the sample’s near-infrared/mid-infrared and far-infrared/mid-infrared colors. The top panel of Figure 12 shows the (dust-only) mid-infrared color as a function of the far-infrared color. The stellar contribution is subtracted from the 8.0 and 24 m measures via extrapolation of the 3.6 m emission, assuming the 3.6 m emission is completely stellar:
| (2) |
where and are chosen such that the dust-only flux densities vanish for a standard stellar spectrum (e.g. Helou et al. 2004; Engelbracht et al. 2005). Likewise, the ratio of 8.0 m dust emission to total dust emission is plotted in the bottom panel of Figure 12 using the relation
| (3) |
where and the denominator is obtained from MIPS fluxes using Equation 4 in Dale & Helou (2002). The solid and dotted lines in Figure 12 respectively indicate the flavors of SED models presented in Dale & Helou (2002) and Dale et al. (2001), derived from the average global trends for a sample of normal star-forming galaxies observed by ISO and IRAS. The solid curve incorporates an improved approach to modeling the far-infrared/submillimeter emission (Dale & Helou 2002).
Some of the low-metallicity objects lie dramatically below the canonical star-forming galaxy curves, consistent with the Engelbracht et al. (2005) empirical finding that low metallicity galaxies show relatively low 8.0 m emission. These low-metallicity galaxies drive the scatter in the ratio between the inferred dust-only flux at 8 m and the 8 m flux as predicted from the dust model fitted to the MIPS fluxes. The dispersion in this ratio is 2.90 and 1.82 dex including and not including, respectively, the low-metallicity systems. A likely reason for the relatively low 8 m flux for low-metallicity galaxies is a different balance between PAH destruction and formation within these systems (PAHs dominate the emission at 8 m; see Figures 8 and 12 in Li & Draine 2001). For example, if PAHs are formed by grain-surface chemistry in the interstellar medium (so the grain formation rate would vary as the metallicity squared), and destroyed by gas-phase processes (sputtering in shock waves, or photodestruction) one might expect lower PAH/dust ratios in low metallicity systems. Finally, we note that the SINGS sample fills in more of the quiescent portion of the color-color space (e.g. small values of ), and in fact some of the points lie beyond the most quiescent values predicted by the previous generation of models. The SINGS sample spans a larger range of galaxy types, infrared/optical ratios, metallicities, and infrared colors than the sample from the ISO Key Project on the Interstellar Medium of Normal Galaxies, so it is unsurprising that some of the data points in Figure 12 do not exactly match the models’ predictions.
4.2 Local Infrared-Submillimeter Spectral Energy Distributions
To properly execute a multi-wavelength investigation within galaxies, all the images were first convolved to match the point-spread function of the 160 m beam which has FWHM of 38″ (see Engelbracht et al. 2004). At the distances to NGC 3031, NGC 5194, and NGC 7331, 38″ corresponds to spatial scales of 0.6, 1.5, and 2.8 kpc, respectively. After the data were all smoothed to the same resolution, sky-subtracted flux densities were extracted from the 170 various regions within each galaxy (Figures 1 and 2).
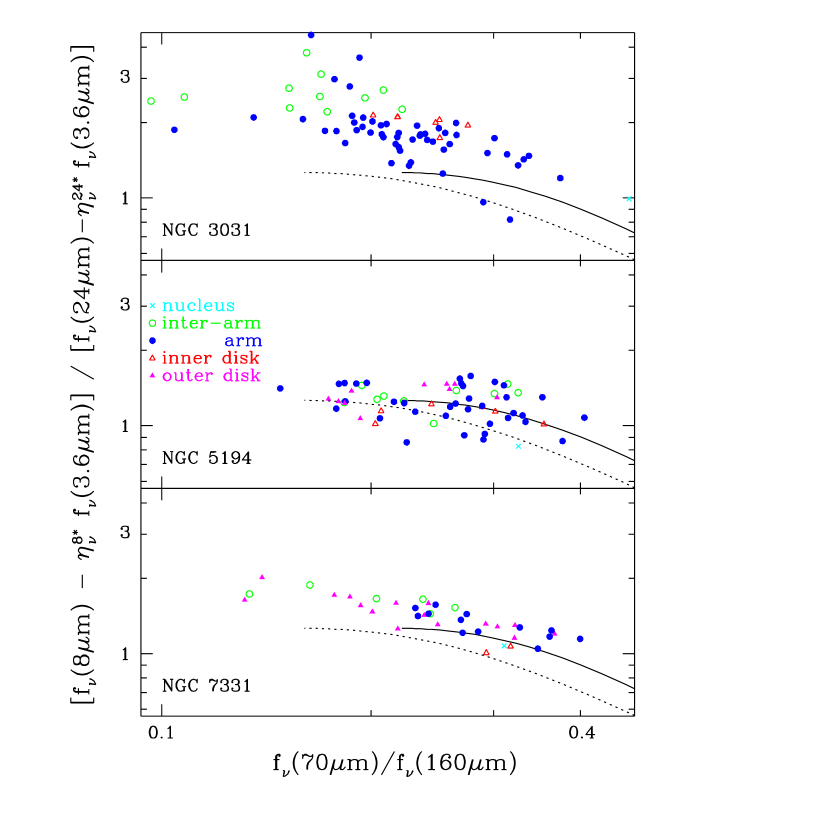
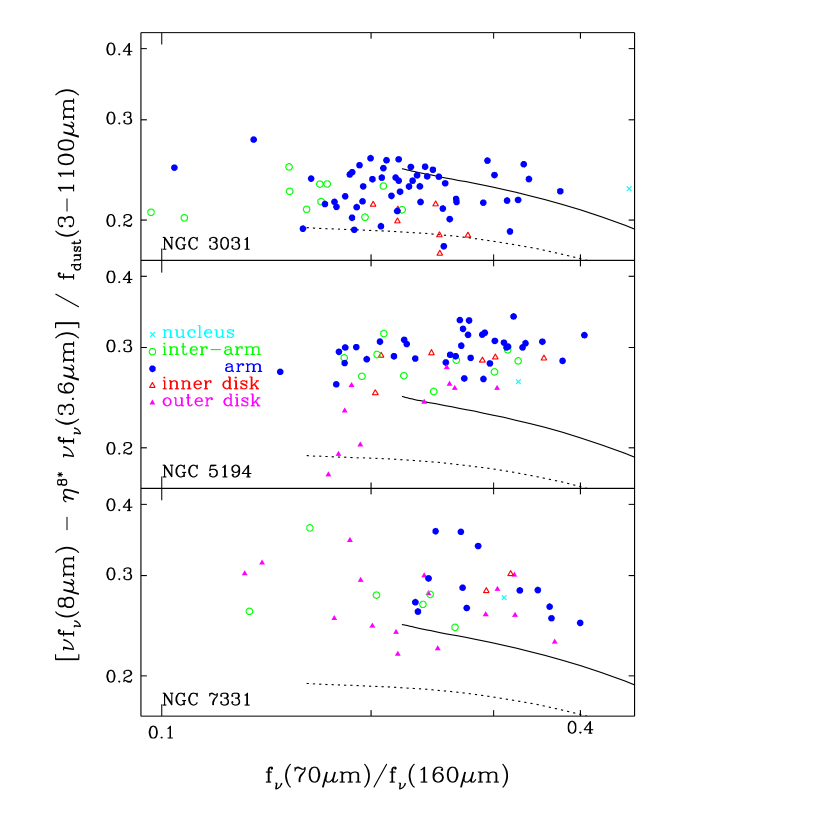
Figure 13 shows the mid-infrared color as a function of the far-infrared color for the various regions in these three galaxies. In general, the observed SEDs are indicative of more intense radiation fields for regions closer to the nucleus and arms, with larger ratios due to hotter large grains and smaller ratios due to elevated small grain emission at 24 m. The relatively low values for near the nuclei and arm regions are unlikely explained by a diminution of the 8.0 m flux as a result of the destruction of polycyclic aromatic hydrocarbons, since the radiation fields suggested by within these galaxies are fairly mild. This issue is addressed in Figure 14. The overall constancy of the 8.0 m-to-total infrared ratio in Figure 14 supports the conclusion that the relatively low values of for high are due to elevated 24 m emission and not a reduction in the PAH emission. Another interesting facet of the data plotted in Figure 14 is the comparatively small variation in 8.0 m-to-total dust emission: the typical scatter within each galaxy is 15% even as varies by a factor of four. This result reinforces the notion that the observed variations in do not arise from variations in 8.0 m-to-total dust emission, but rather from variations in 24 m-to-total dust emission.
Another obvious feature to Figure 13 is the substantial variations seen within a given galaxy’s disk. The and colors vary by a factor of two or more within each disk, and the dispersion is larger the closer the galaxy. NGC 3031 shows the largest scatter because in this galaxy we are sampling the smallest spatial scales and thus the widest variety of environments. Moreover, some of the local values are smaller than that predicted from the globally-integrated properties of the most quiescent galaxies studied by ISO and IRAS (i.e. the leftmost values of the model curves displayed in Figure 13). In other words, many of the local regions within these galaxies are more quiescent than what is seen for the global emission in normal star-forming galaxies. This is not unexpected, as globally-integrated emission will inevitably encompass some hot spots, raising the overall average ratio above the typical cirrus value.
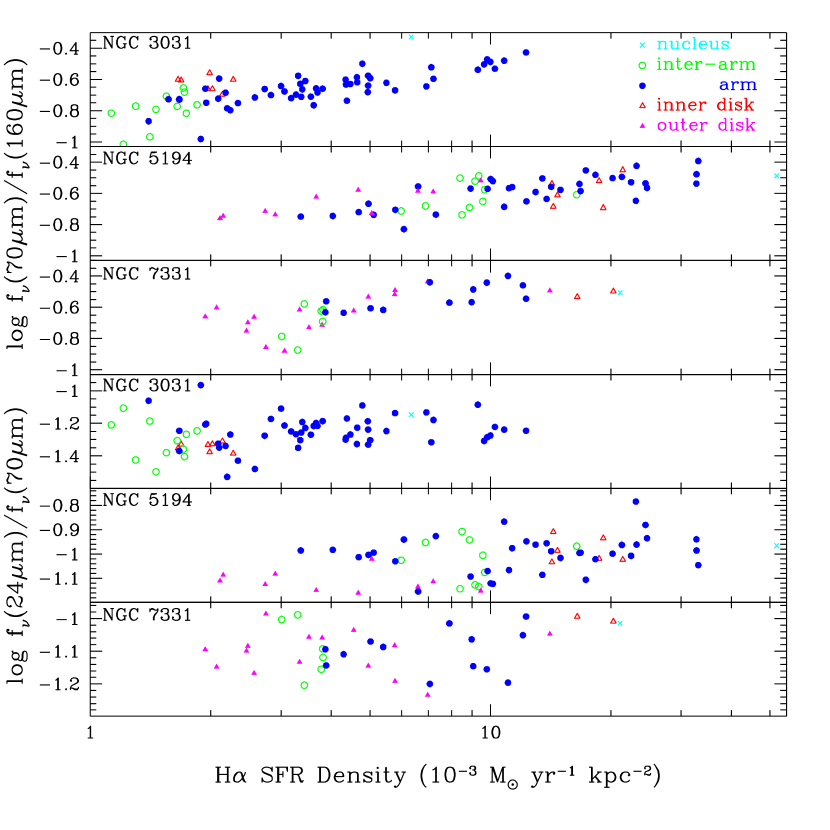
As alluded to above, the star formation rate is conceptually linked to the shape of the far-infrared spectrum—regions near enhanced star formation should have more intense interstellar radiation fields, and thus the large grains in such regions should be hotter than their counterparts in the diffuse interstellar medium. However, before the advent of the Spitzer Space Telescope and its superior angular resolving power, it was difficult to explore correlations between the far-infrared color and the local star formation rate in all but the closest of galaxies (e.g. Xu & Helou 1994; Xu & Helou 1996). Figure 15 shows the far-infrared color as measured by Spitzer versus the local star formation rate for NGC 3031, NGC 5194, and NGC 7331. Star formation rates were computed using the relation presented in Kennicutt (1998): SFR ( year(H) (ergs s-1). The two quantities are clearly correlated; a non-parametric ranking analysis indicates a correlation at the level. The ratio is likewise correlated with the local star formation rate, and much less so. These results suggest that both 24 and 70 m trace warmer dust phases, consistent with morphological studies carried out by Hinz et al. (2004) for M 33, Helou et al. (2004) for NGC 300, Gordon et al. (2004), and Rieke et al. for M 31 (private communication). A large fraction of the 70 m emission may come from the same grains that are thought to produce the 24 m emission (e.g. Désert, Boulanger, & Puget 1990), grains that are particularly sensitive to the effects of local star formation.
4.3 Implications for High-Redshift Observations: A Cautionary Tale
One of the long-range goals of the SINGS project is to provide a reference set of empirical SED templates of nearby galaxies and regions within these galaxies that cover the full range of properties and interstellar environments found locally. These templates can then be applied in turn to model the observed redshifted SEDs of galaxies observed at cosmological distances. Such templates are already available from ISO and IRAS observations, such as the ISO Key Project sample (e.g. Dale & Helou 2002). The SINGS sample is more diverse than the Key Project sample (metallicity, colors, morphology, etc.), and will eventually provide a definitive set of reference SEDs for such applications. The preliminary data presented here already provide some useful guidance (and warnings) for interpreting infrared observations of high-redshift galaxies from 24 m or 8.0 m data alone (or together).
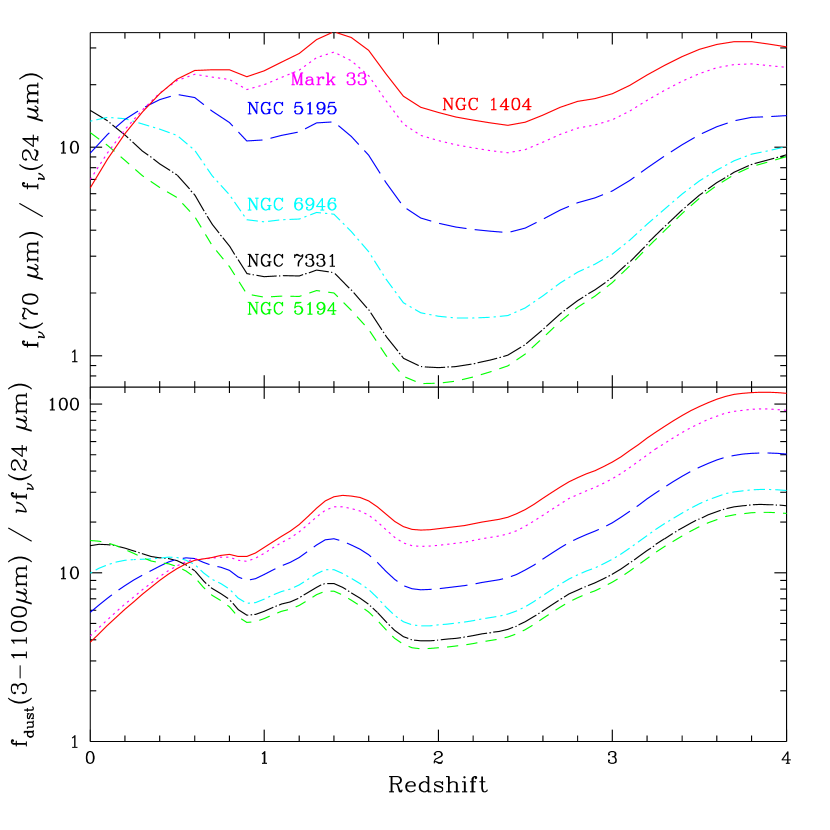
As a guide for Spitzer-based cosmological studies, we show in Figure 16 how the and the (dust-only) bolometric-to-24 m ratios would change as a function of redshift for a variety of SINGS-like objects. The tracks are pinned at redshift zero according to each source’s observed infrared properties, and traced out to higher redshifts using the model of Dale & Helou (2002). Figure 16 shows that SED variations remain a considerable source of systematic uncertainty even when the redshift is known. Given the range of infrared spectral energy distributions observed for this portion of the SINGS galaxy sample, extrapolating the total infrared luminosity from the 24 m emission alone would yield uncertainties at the factor-of-five level. This level of uncertainty can be reduced with some a priori constraints on the types and the redshifts of sources being studied (e.g. Papovich & Bell 2002), as well as information on the infrared colors (e.g. ratio or their redshifted equivalents).
However, for many current applications even the redshifted 24 m emission is inaccessible, and one must rely on the observed 24 m flux, which at corresponds to 8.0 m in the rest frame. An in-depth analysis of the application of this index at high redshift will be presented in a separate paper (Smith et al. 2005), but in the meantime we make some preliminary assessments based on the SED data shown in Figures 12 and 14. Within individual large, metal-rich galaxies such as NGC 3031, NGC 5194, and NGC 7331 the ratio of 8.0 m-to-total infrared luminosity has a surprisingly low dispersion, less than a factor of two (maximum to minimum) within individual galaxies and hardly more among the three galaxies plotted in Figure 14. However if one considers a much larger galaxy sample (Figure 12), the total range in 8.0 m-to-total infrared luminosity ratios swells to more than a factor of twenty. Much of this large scatter can be attributed to a few metal-poor dwarf galaxies, in which the 8.0 m PAH emission is quenched. If one excludes the metal-poor dwarfs the total range of 8.0 m-to-total ratios shrinks to a factor of 10, and this probably should be taken as a minimum systematic uncertainty in total infrared luminosities and star formation rates inferred from rest-frame 8.0 m fluxes alone (also see Calzetti et al. 2005). If the metal abundance of the population cannot be inferred a priori then the uncertainties may be considerably higher.
5 Summary
New Spitzer imaging data are coupled with data from 2MASS, ISO, IRAS, and SCUBA to investigate the properties of the 1-850 m SEDs for 71 nearby galaxies from the SINGS sample. The various shapes of the globally-integrated dust continuum generally follow the trends expected from the previous generation of infrared dust models that are based on ISO and IRAS observations of normal star-forming galaxies from the ISO Key Project sample. However, the SINGS sample is more diverse than the Key Project sample (metallicity, colors, morphology, etc), so it is perhaps not surprising that the SINGS sample shows larger variations in infrared colors.
We also take advantage of Spitzer’s unprecedented angular resolving power to explore over 170 regions within NGC 3031, NGC 5194, and NGC 7331. All three galaxies exhibit interesting trends in their infrared emission over the various environments sampled in this study. Within each of these galaxies we find a wide variety of spectral shapes, especially for NGC 3031, the closest of the three targets and thus the galaxy for which we are able to sample the smallest spatial scales. In particular we notice fairly constant ratios of dust-only 8.0 m emission with respect to both bolometric dust emission, over large dynamic ranges of dust temperature as measured by . The relative contribution from PAHs does not appear to significantly vary on kiloparsec scales, suggesting that the variations observed in are largely driven by variations in the local 24 m emission. The emission from galaxies at 24 m, along with that at 70 m, traces grains that are particularly sensitive to changes in the local interstellar radiation field and thus can be used as proxies for gauging the strength of the local star formation (e.g. Calzetti et al. 2005).
This dataset on a wide-ranging sample of local galaxies is useful for estimating how accurately one can predict the total infrared luminosity (and star formation rate) from just the 8.0 or 24 m data alone. Though the 8.0 m-to-total infrared ratio varies by less than a factor of two within NGC 3031, NGC 5194, and NGC 7331, the global ratio varies by more than a factor of 20 among our diverse sample of galaxies. The 24 m-to-total infrared ratio likewise spans a large range in the SINGS sample (factor of 5). In conjunction with models of infrared SEDs for normal star-forming galaxies, we predict that the observed 24 m-to-total infrared ratio (e.g. rest-frame 8.0 m-to-total at ) maintains at least this dispersion at most epochs back to a redshift of four.
As mentioned above, the characteristics of the infrared SEDs as seen by Spitzer are broadly consistent with normal galaxy models developed based on ISO and IRAS data, but with perhaps more significant dispersion. Once the complete SINGS dataset is in hand, the suite of empirical SED models referenced here will be updated according to the diversity of spectral shapes exhibited by the SINGS project. A more generally comprehensive and quantitative analysis will be pursued as well. For example, how much more dispersion in infrared colors is seen within galaxies versus between galaxies? How do the global spectral shapes depend on metallicity in this sample? Are the infrared surface brightnesses correlated with the far-infrared color or galaxy type? Data from all 75 galaxies in the diverse SINGS sample will help to answer these questions.
References
- (1) Bendo, G. et al. 2005, ApJ, submitted
- (2) Calzetti, D. et al. 2005, ApJ, in press
- (3) Dale, D.A. et al. 2000, AJ, 120, 583
- (4) Dale, D.A. et al. 2001, ApJ, 549, 215
- (5) Dale, D.A. & Helou, G. 2002, ApJ, 576, 159
- (6) Désert, F.X, Boulanger, F. & Puget, J.L. 1990, A&A, 237, 215
- (7) Engelbracht, C.W. et al. 2004, ApJS, 154, 248
- (8) Engelbracht, C.W., Gordon, K.D., Rieke, G.H., Werner, M.W., Dale, D.A., & Latter, W.B. 2005, ApJ, 628, L29
- (9) Fazio, G. et al. 2004, ApJS, 154, 10
- (10) Gordon, K. et al. 2004, ApJS, 154, 215
- (11) Gordon, K. D. et al. 2005, PASP, 117, 503
- (12) Helou, G. et al. 2004, ApJS, 154, 253
- (13) Hinz, et al. 2004, ApJS, 154, 259
- (14) Holland, W.S. 1999, MNRAS, 303, 659
- (15) Hoopes, C.G. & Walterbos, R.A.M. 2003, ApJ, 586, 902
- (16) Jarret, T.H., Chester, T., Cutri, R., Schneider, S.E., & Huchra, J.P. 2003, AJ, 125, 525
- (17) Jenness, T. & Lightfoot, J. F. 1998, “Reducing SCUBA Data at the James Clerk Maxwell Telescope”, in Astronomical Data Analysis Software and Systems VII, ASP Conf. Ser., 145, 216
- (18) Kennicutt, R.C. 1998, ARA&A, 36, 189
- (19) Kennicutt, R.C. et al. 2003, PASP, 115, 928
- (20) Li, A. & Draine, B.T. 2001, ApJ, 554, 778
- (21) Massey, P., Strobel, K., Barnes, J.V., & Anderson, E. 1988, ApJ, 328, 315
- (22) Pahre, M.A., Ashby, M.L.N., Fazio, G.G., & Willner, S.P. 2004, ApJS, 154, 229
- (23) Papovich, C. & Bell, E.F. 2002, ApJ, 579, L1
- (24) Regan, M.W. et al. 2004, ApJS, 154, 204
- (25) Rieke, G. et al. 2004, ApJS, 154, 25
- (26) Rowan-Robinson, R. et al. 2005, AJ, 129, 1183
- (27) Roussel, H. et al. 2001, A&A, 369, 473
- (28) Roussel, H., Helou, G., Beck, R., Condon, J.J., Bosma, A., Matthews, K., & Jarrett, T.H. 2003, ApJ, 593, 733
- (29) Schlegel, D.J., Finkbeiner, D.P., & Davis, M. 1998, ApJ, 500, 525
- (30) Soifer, B.,T., Neugebauer, G., Helou, G., Lonsdale, C.J., Hacking, P., Rice, W., Houck, J.R., Low, F.J., & Rowan-Robinson, M. 1984, ApJ, 283, L1
- (31) Vazquez, G.A. & Leitherer, C. 2005, ApJ, 621, 695
- (32) Xilouris, E.M., Madden, S.C., Galliano, F., Vigroux, L., & Sauvage, M. 2004, A&A, 416, 41
- (33) Xu, C. & Helou, G. 1994, ApJ, 426, 109
- (34) Xu, C. & Helou, G. 1996, ApJ, 456, 152
- (35) Yan, L. et al. 2004, ApJS, 154, 60
| Galaxy | 3.6 m | 4.5 m | 5.8 m | 8.0 m | 24 m | 70 m | 160 m |
|---|---|---|---|---|---|---|---|
| (Jy) | (Jy) | (Jy) | (Jy) | (Jy) | (Jy) | (Jy) | |
| NGC 0024 | 0.13 0.01 | 1.89 0.39 | 6.7231.36 | ||||
| NGC 0337 | 0.110.01 | 0.0700.007 | 0.17 0.02 | 0.50 0.05 | 0.65 0.07 | 8.83 1.77 | 18.30 3.69 |
| NGC 0584 | 0.400.04 | 0.23 0.02 | 0.22 0.02 | 0.15 0.02 | 0.05 0.006 | 0.15 0.07 | 1.02 0.40 |
| NGC 0628 | 0.950.10 | 0.58 0.06 | 1.50 0.15 | 3.62 0.36 | 3.08 0.31 | 29.73 5.95 | 116.64 23.34 |
| NGC 0855 | 0.0460.005 | 0.0290.003 | 0.0220.003 | 0.0600.006 | 0.0820.008 | 1.38 0.28 | 2.09 0.44 |
| NGC 0925 | 0.90 0.09 | 12.20 2.45 | 39.52 7.95 | ||||
| NGC 1097 | 1.360.14 | 0.85 0.09 | 1.89 0.19 | 4.29 0.43 | 6.40 0.64 | 43.40 8.68 | 144.63 28.93 |
| NGC 1266 | 0.0590.006 | 0.0440.004 | 0.0660.007 | 0.12 0.01 | 0.84 0.08 | 9.64 1.93 | 9.14 1.84 |
| NGC 1291 | 2.320.23 | 1.35 0.14 | 1.25 0.13 | 0.86 0.09 | 0.44 0.05 | 5.41 1.09 | 28.47 5.75 |
| NGC 1316 | 2.720.27 | 1.63 0.16 | 1.46 0.15 | 0.75 0.08 | 0.36 0.04 | 4.22 0.85 | 9.66 1.94 |
| NGC 1377 | 0.0620.006 | 0.0900.009 | 0.32 0.03 | 0.55 0.06 | 1.73 0.17 | 4.76 0.95 | 2.91 0.60 |
| NGC 1404 | 0.800.08 | 0.46 0.05 | 0.42 0.04 | 0.21 0.02 | 0.0830.009 | 0.15 0.09 | 0.31 0.18 |
| NGC 1512 | 0.430.04 | 0.26 0.03 | 0.34 0.03 | 0.59 0.06 | 0.42 0.04 | 5.40 1.08 | 21.85 4.38 |
| NGC 1566 | 0.820.08 | 0.51 0.05 | 1.16 0.12 | 2.84 0.28 | 2.65 0.27 | 27.82 5.57 | 95.26 19.05 |
| NGC 1705 | 0.0280.003 | 0.0190.002 | 0.0120.002 | 0.0220.002 | 0.0520.005 | 1.09 0.22 | 1.20 0.25 |
| NGC 2403 | 2.060.21 | 1.38 0.14 | 2.79 0.28 | 5.53 0.55 | 5.64 0.56 | 75.58 15.12 | 231.56 46.32 |
| Holmberg II | 0.0780.008 | 0.0600.006 | 0.0390.005 | 0.0320.005 | 0.17 0.02 | 3.18 0.64 | 4.05 0.87 |
| M81 Dwarf A | 0.0020.001 | 0.0010.001 | 0.001 | 0.001 | |||
| DDO 053 | 0.0060.001 | 0.0050.001 | 0.0030.001 | 0.0100.001 | 0.0280.003 | 0.31 0.07 | 0.32 0.11 |
| NGC 2798 | 0.130.01 | 0.0860.009 | 0.32 0.03 | 0.84 0.08 | 2.51 0.25 | 14.70 2.94 | 18.45 3.69 |
| NGC 2841 | 1.390.14 | 0.80 0.08 | 0.85 0.09 | 1.56 0.16 | 0.88 0.09 | 8.66 1.74 | 54.87 10.98 |
| NGC 2915 | 0.0580.006 | 1.09 0.22 | 1.09 0.30 | ||||
| Holmberg I | 0.0130.001 | 0.0080.001 | 0.0090.002 | 0.0100.002 | 0.0130.004 | 0.33 0.12 | 0.76 0.23 |
| NGC 2976 | 0.470.05 | 0.30 0.03 | 0.64 0.06 | 1.36 0.14 | 1.33 0.13 | 16.99 3.40 | 46.81 9.40 |
| NGC 3049 | 0.0440.004 | 0.0290.003 | 0.0780.008 | 0.18 0.02 | 0.41 0.04 | 2.27 0.46 | 4.05 0.82 |
| NGC 3031 | 11.871.19 | 6.90 0.69 | 7.90 0.79 | 10.78 1.08 | 4.94 0.49 | 74.37 14.88 | 347.10 69.43 |
| Holmberg IX | 0.0080.001 | 0.0040.001 | 0.006 | 0.006 | |||
| M81 Dwarf B | 0.0050.001 | 0.0040.001 | 0.0030.001 | 0.0030.001 | 0.0080.001 | 0.12 0.03 | 0.21 0.14 |
| NGC 3190 | 0.410.04 | 0.25 0.03 | 0.30 0.03 | 0.44 0.04 | 0.26 0.03 | 4.34 0.87 | 13.19 2.65 |
| NGC 3198 | 0.300.03 | 0.18 0.02 | 0.42 0.04 | 0.92 0.09 | 1.03 0.10 | 8.68 1.74 | 34.96 7.00 |
| IC 2574 | 0.170.02 | 0.0960.01 | 0.0840.008 | 0.0890.009 | 0.27 0.03 | 4.61 0.92 | 10.31 2.12 |
| NGC 3265 | 0.28 0.03 | 2.05 0.42 | 2.35 0.49 | ||||
| Markarian 33 | 0.0290.003 | 0.0200.002 | 0.0630.006 | 0.17 0.02 | 0.82 0.08 | 3.34 0.67 | 3.46 0.71 |
| NGC 3351 | 0.890.09 | 0.55 0.06 | 0.93 0.09 | 1.80 0.18 | 2.40 0.24 | 16.42 3.29 | 59.72 11.95 |
| NGC 3521 | 2.230.22 | 1.44 0.14 | 3.29 0.33 | 8.36 0.84 | 5.36 0.54 | 49.85 9.97 | 206.65 41.35 |
| Galaxy | 3.6 m | 4.5 m | 5.8 m | 8.0 m | 24 m | 70 m | 160 m |
|---|---|---|---|---|---|---|---|
| (Jy) | (Jy) | (Jy) | (Jy) | (Jy) | (Jy) | (Jy) | |
| NGC 3621 | 3.30 0.33 | 40.21 8.04 | 126.15 25.24 | ||||
| NGC 3627 | 2.050.21 | 1.32 0.13 | 3.06 0.31 | 7.50 0.75 | 7.25 0.73 | 68.92 13.79 | 208.13 41.63 |
| NGC 3773 | 0.0240.002 | 0.0150.002 | 0.0290.003 | 0.0610.006 | 0.13 0.01 | 1.22 0.25 | 2.12 0.48 |
| NGC 3938 | 0.350.04 | 0.23 0.02 | 0.52 0.05 | 1.32 0.13 | 1.05 0.11 | 12.14 2.43 | 46.78 9.36 |
| NGC 4125 | 0.700.07 | 0.39 0.04 | 0.30 0.03 | 0.19 0.02 | 0.0690.007 | 0.86 0.18 | 1.33 0.30 |
| NGC 4236 | 0.53 0.05 | 7.08 1.42 | 18.87 3.85 | ||||
| NGC 4254 | 0.770.08 | 0.50 0.05 | 1.89 0.19 | 5.28 0.53 | 4.09 0.41 | 39.02 7.80 | 131.79 26.36 |
| NGC 4321 | 1.040.10 | 0.68 0.07 | 1.55 0.16 | 3.88 0.39 | 3.33 0.33 | 32.28 6.46 | 128.41 25.68 |
| NGC 4450 | 0.580.06 | 0.35 0.03 | 0.32 0.03 | 0.36 0.04 | 0.19 0.02 | 2.46 0.50 | 13.73 2.76 |
| NGC 4536 | 3.37 0.34 | 22.49 4.50 | 54.39 10.89 | ||||
| NGC 4552 | 0.910.09 | 0.51 0.05 | 0.37 0.04 | 0.23 0.02 | 0.0620.006 | 0.0970.04 | 0.41 0.41 |
| NGC 4559 | 0.390.04 | 0.25 0.03 | 0.53 0.05 | 1.13 0.11 | 1.08 0.11 | 14.32 2.87 | 46.81 9.37 |
| NGC 4569 | 0.830.08 | 0.50 0.05 | 0.75 0.08 | 1.36 0.14 | 1.41 0.14 | 9.65 1.93 | 38.21 7.66 |
| NGC 4579 | 0.950.10 | 0.55 0.06 | 0.66 0.07 | 0.97 0.10 | 0.74 0.07 | 8.21 1.65 | 39.07 7.82 |
| NGC 4594 | 4.290.43 | 2.44 0.24 | 2.18 0.22 | 1.74 0.17 | 0.65 0.07 | 6.71 1.36 | 36.84 7.39 |
| NGC 4631 | 1.380.14 | 0.89 0.09 | 3.22 0.32 | 7.89 0.79 | 7.97 0.80 | 98.78 19.76 | 269.01 53.80 |
| NGC 4725 | 1.250.13 | 0.75 0.08 | 0.97 0.10 | 1.63 0.16 | 0.81 0.08 | 7.48 1.50 | 53.42 10.70 |
| NGC 4736 | 3.950.40 | 2.46 0.25 | 3.61 0.36 | 6.97 0.70 | 5.50 0.55 | 69.89 13.98 | 170.28 34.06 |
| DDO 154 | 0.00120.0004 | 0.00080.0003 | 0.0012 | 0.0009 | 0.00580.002 | 0.0430.03 | 0.26 0.14 |
| NGC 4826 | 2.760.28 | 1.67 0.17 | 2.13 0.21 | 3.16 0.32 | 2.47 0.25 | 35.68 7.14 | 85.39 17.09 |
| DDO 165 | 0.0110.003 | 0.14 0.05 | 0.27 0.15 | ||||
| NGC 5033 | 0.700.07 | 0.50 0.05 | 1.05 0.11 | 2.59 0.26 | 1.92 0.19 | 21.50 4.30 | 88.15 17.63 |
| NGC 5055 | 2.610.26 | 1.64 0.16 | 3.47 0.35 | 7.60 0.76 | 5.59 0.56 | 59.76 11.95 | 286.34 57.27 |
| NGC 5194 | 2.910.29 | 1.90 0.19 | 5.70 0.57 | 14.33 1.43 | 12.25 1.23 | 131.36 26.30 | 494.34 98.99 |
| NGC 5195 | 0.910.09 | 0.54 0.05 | 0.56 0.06 | 0.85 0.09 | 1.31 0.05 | 10.85 2.17 | 12.34 2.49 |
| Tololo 89 | 0.0410.004 | 0.0260.003 | 0.0170.002 | 0.0770.008 | 0.25 0.03 | 1.52 0.31 | 2.69 0.59 |
| NGC 5408 | 0.0560.006 | 0.0390.004 | 0.0500.005 | 0.0500.005 | 0.42 0.04 | 2.95 0.59 | 2.21 0.49 |
| NGC 5474 | 0.110.01 | 0.0850.009 | 0.11 0.01 | 0.15 0.02 | 0.18 0.02 | 3.17 0.64 | 9.49 1.92 |
| NGC 5713 | 0.220.02 | 0.15 0.02 | 0.35 0.04 | 1.52 0.15 | 2.28 0.23 | 17.23 3.45 | 34.77 6.96 |
| NGC 5866 | 0.20 0.02 | 6.66 1.33 | 16.53 3.31 | ||||
| IC 4710 | 0.0760.008 | 0.0490.005 | 0.0550.006 | 0.0860.009 | 0.11 0.01 | 1.97 0.40 | 3.15 0.67 |
| NGC 6822 | 2.240.22 | 1.41 0.14 | 1.91 0.19 | 0.75 0.08 | 2.51 0.25 | 53.21 10.65 | 136.22 27.27 |
| NGC 6946 | 3.470.35 | 2.26 0.23 | 7.51 0.75 | 18.49 1.85 | 20.87 2.09 | 177.89 35.58 | 498.35 99.71 |
| NGC 7331 | 1.75 0.17 | 1.08 0.11 | 2.36 0.24 | 5.40 0.54 | 3.92 0.39 | 56.49 11.30 | 164.12 32.89 |
| NGC 7552 | 0.50 0.05 | 0.38 0.04 | 1.33 0.13 | 3.63 0.36 | 10.30 1.03 | 45.40 9.09 | 86.65 17.34 |
| NGC 7793 | 0.85 0.08 | 0.50 0.05 | 1.33 0.13 | 2.49 0.25 | 1.97 0.20 | 29.86 5.97 | 119.53 23.91 |
| Band | ConversionaaThe values for NGC 7331 IRAC data are 0.111, 0.133, 0.583, 0.195. |
|---|---|
| (MJy sr-1 per DN s-1) | |
| IRAC 3.6 m | 0.1125 |
| IRAC 4.5 m | 0.1375 |
| IRAC 5.8 m | 0.5913 |
| IRAC 8.0 m | 0.2008 |
| MIPS 24 m | 0.0439 |
| MIPS 70 m | 634. |
| MIPS 160 m | 42.6 |
| Galaxy | 450 m | 850 m | 450 m | 850 m |
|---|---|---|---|---|
| (Jy) | (Jy) | Correction | Correction | |
| NGC 0337 | 0.350.05 | |||
| NGC 1097 | 1.440.78 | 2.09 | ||
| NGC 2798 | 0.190.03 | 1.08 | ||
| NGC 2976 | 0.610.24 | 1.56 | ||
| NGC 3190 | 0.190.04 | 1.12 | ||
| Markarian 33 | 0.040.01 | |||
| NGC 3521 | 2.110.82 | 1.56 | ||
| NGC 3627 | 1.860.70 | 1.53 | ||
| NGC 4254 | 1.010.54 | 2.06 | ||
| NGC 4321 | 0.880.49 | 2.19 | ||
| NGC 4536 | 0.420.11 | 1.30 | ||
| NGC 4569 | 0.470.08 | 1.11 | ||
| NGC 4579 | 0.440.07 | |||
| NGC 4594 | 0.370.11 | 1.33 | ||
| NGC 4631 | 30.7010.02 | 5.731.21 | 1.27 | 1.17 |
| NGC 4736 | 1.540.66 | 1.67 | ||
| NGC 4826 | 1.230.31 | 1.24 | ||
| NGC 5033 | 1.100.55 | 1.93 | ||
| NGC 5194 | 2.610.39 | |||
| NGC 5195 | 0.260.04 | |||
| NGC 5713 | 0.570.12 | 1.17 | ||
| NGC 5866 | 0.790.20 | 0.140.02 | ||
| NGC 6946 | 18.534.63 | 2.980.45 | ||
| NGC 7331 | 20.568.10 | 2.110.38 | 1.44 | 1.11 |
| NGC 7552 | 0.800.17 | 1.17 |